
Bitcoin (BTC)’s rally above $87,000 has brought the $100,000 level back into focus. The strong inflows into the ETF and recent corporate buying support the recovery but higher Treasury yields could slow the rally. Bitcoin has also started to regain ground against gold (XAU) after a long decline in their price ratio. The next test is whether Bitcoin can hold above $82,300 and continue to outperform gold. This article presents the latest developments behind the rebound, the performance of Bitcoin against gold and the technical levels that could shape the next move in Bitcoin.

Bitcoin News: $999 Million ETF Inflows Support Rally Above $87,000
Bitcoin climbed above $87,000 on September 21, the highest level since January, before pulling back from the high. Technology stocks also rose. That suggests investors were more willing to take risks while traders closing bets against Bitcoin may have added speed to the rally.
Fund flows give the move more support. U.S. spot Bitcoin ETFs received $999 million. BlackRock’s IBIT accounted for $381 million while ARKB drew $289 million. These inflows show strong demand through regulated funds but one day of buying cannot establish a lasting trend.
Corporate buying has also stayed in focus. Strategy disclosed that it had bought 950 Bitcoin for $75.7 million during the previous week. But interest rates remain a risk. Richmond Fed President Tom Barkin said that the inflation was still too high and left open the possibility of further rate hikes. If yields rise again, investors may become less willing to hold Bitcoin.
Bitcoin vs. Gold: BTC/Gold Ratio Rebounds From Long-Term Support
The recent ETF inflows help explain the rally in Bitcoin. The comparison with gold is more demanding. The chart below shows that the Bitcoin to gold ratio reached 35 when Bitcoin topped $126,000 and gold moved above $3,500. It then dropped to 15 as Bitcoin tested near the $60,000 zone while gold held near $4,100. Gold held the value better through that decline. The recovery in the ratio to 20 shows that Bitcoin has started to regain ground.
Bitcoin Price Forecast
Every new Bitcoin analysis as it publishes, today's technical signal and key levels, live price — on one page.
See all Bitcoin forecasts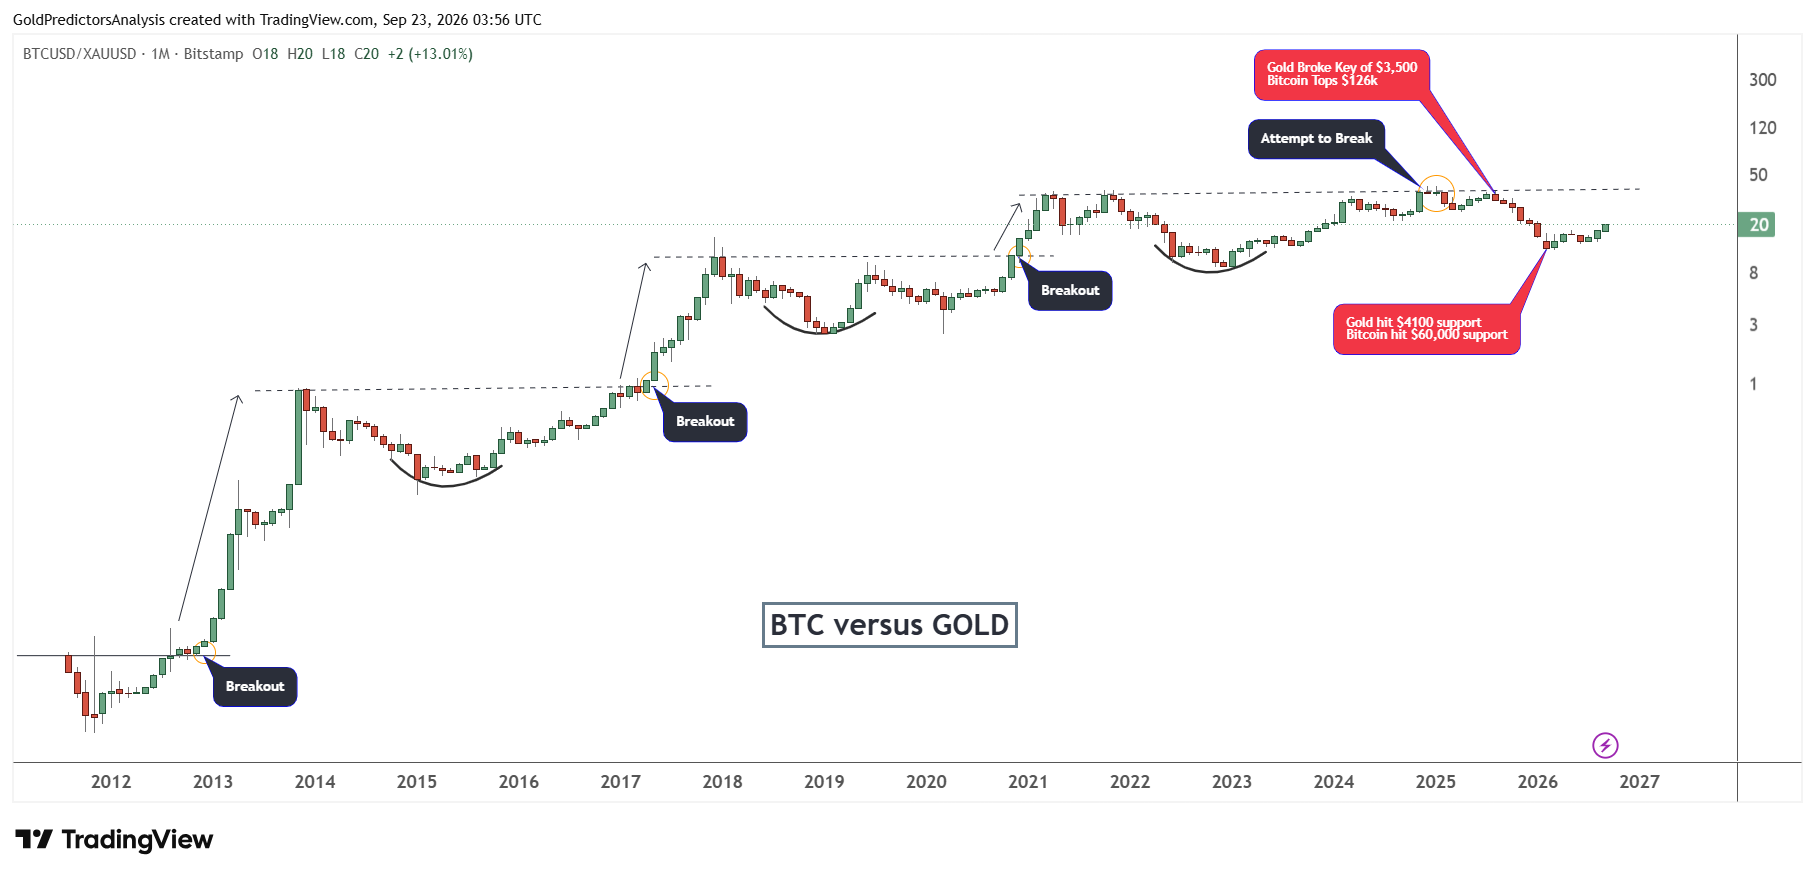
The chart shows the ratio has turned higher near the lower edge of broader rising channel that stretches from 2013. The area that supported earlier declines has held again. The Bitcoin to gold ratio needs to hold above the 12 level and build higher monthly lows to show that the strength against gold is returning.
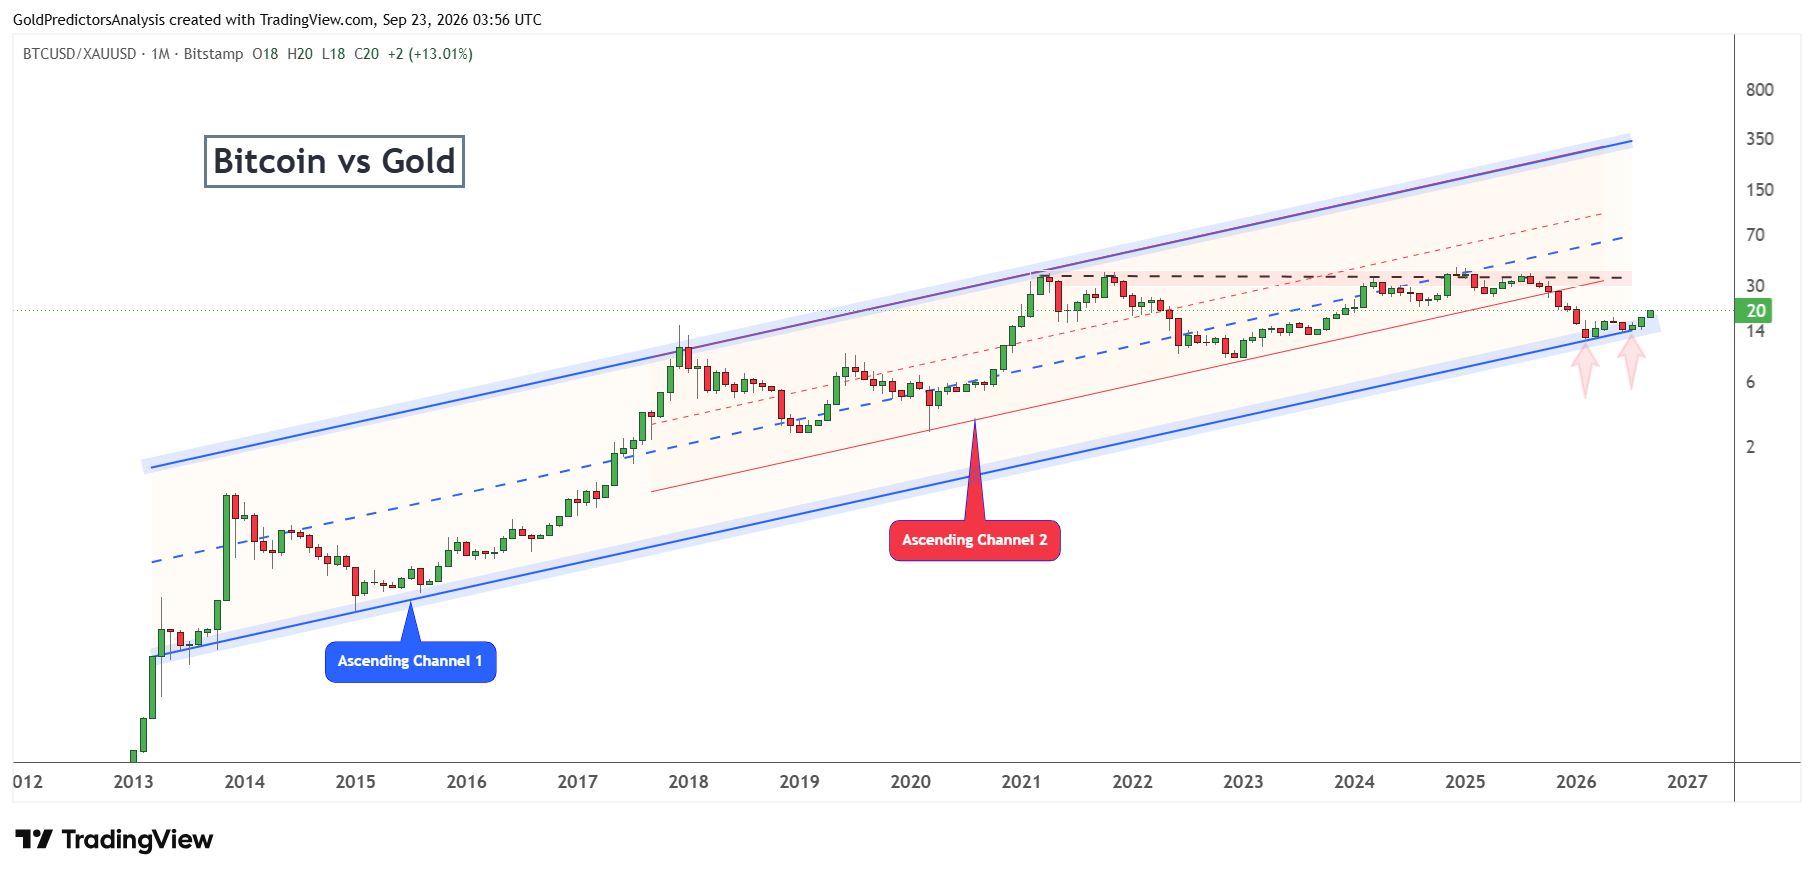
The rounded recoveries in 2015 and 2019 led to breakouts. The recovery after 2022 also gained ground but the later attempt to clear the old high near 40 failed. The current rebound is still too young to resemble those earlier bases.
The demand from ETFs could support the rally in Bitcoin but the ratio will only rise if Bitcoin rises faster than gold. A sustained move above 30-35 would make the case stronger for Bitcoin. A drop below the 12 level would put the broad rising channel at risk and suggest that gold remains strong.
Bitcoin Technical Analysis: $82,300 Breakout Puts $100,000 in Focus
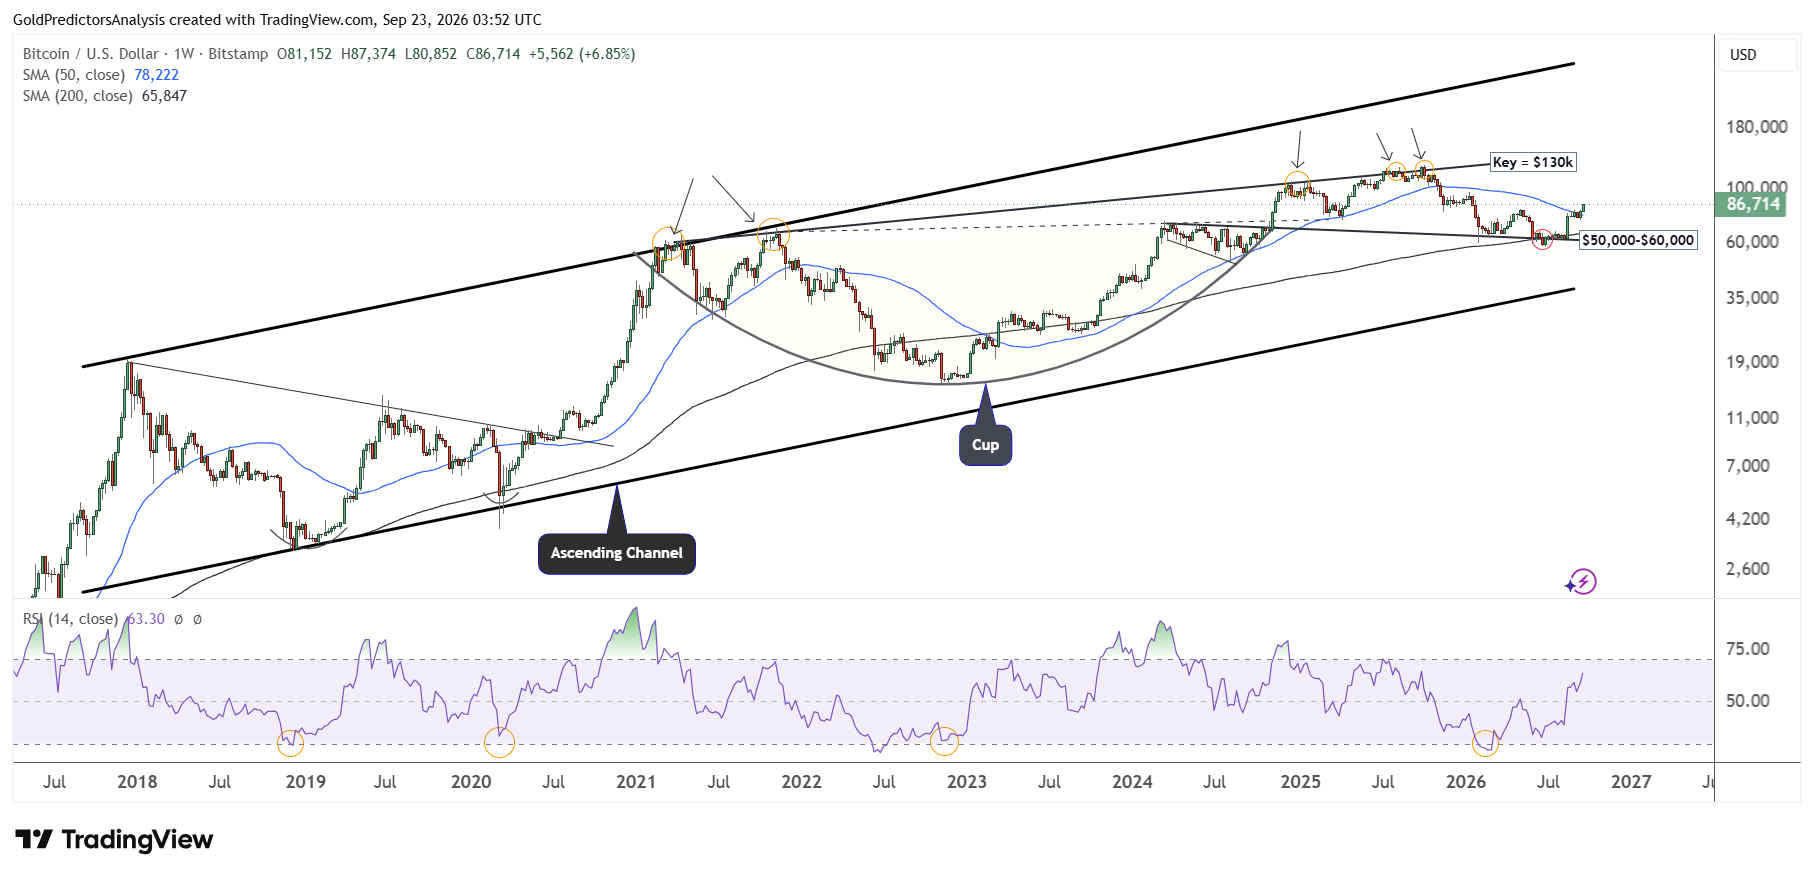
From a technical perspective, the price of Bitcoin has formed a bottom in the support region of $50,000 to $60,000 as discussed in the previous analysis. The price has now broken above the 50-week SMA and is pushing toward the $100,000 area in the short term. A break above $100,000 will likely push the price toward the $135,000 area.
The price has been trading within the broader ascending channel pattern since 2018 and looks poised for a strong move to the upside. The formation of a cup and handle pattern suggests a strong move in the BTC market in the short term. The RSI also remains above the midline and looks poised to gain further upside momentum.
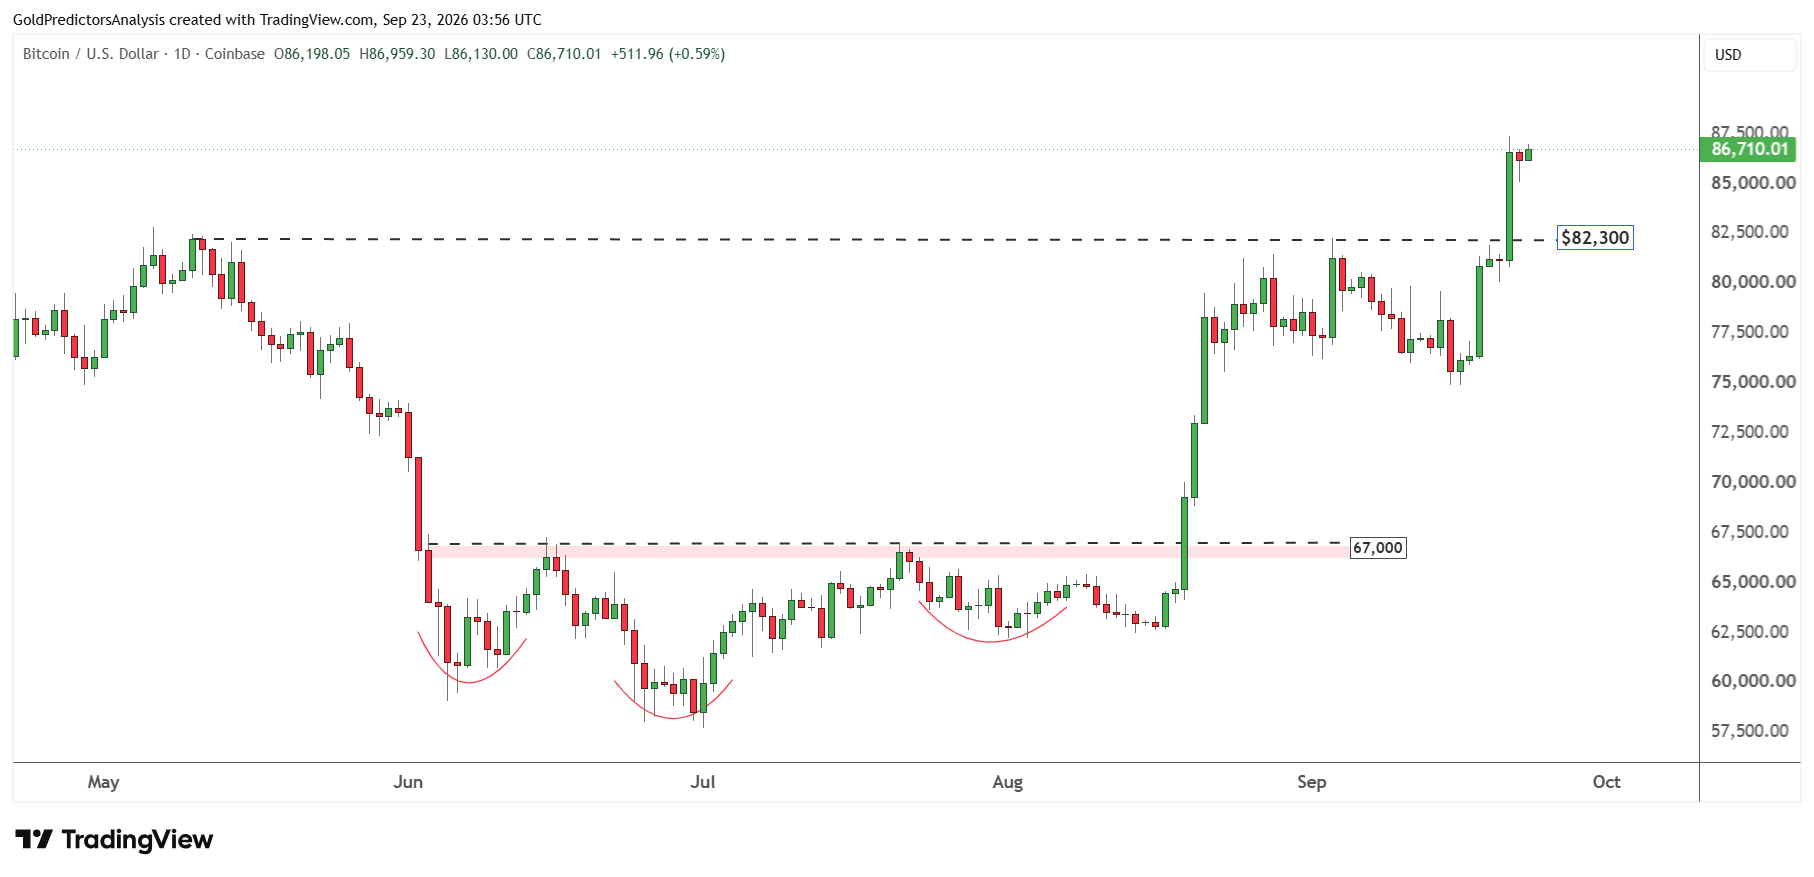
The positive price structure in the Bitcoin market is also visible on the daily chart. The price consolidated in June, July and August around the support line of the ascending broadening wedge and then pushed above the $80,000 area.
This breakout suggests a strong move toward the $100,000 area in the short term. A breakout above $100,000 will open the way for another breakout rally in Bitcoin.
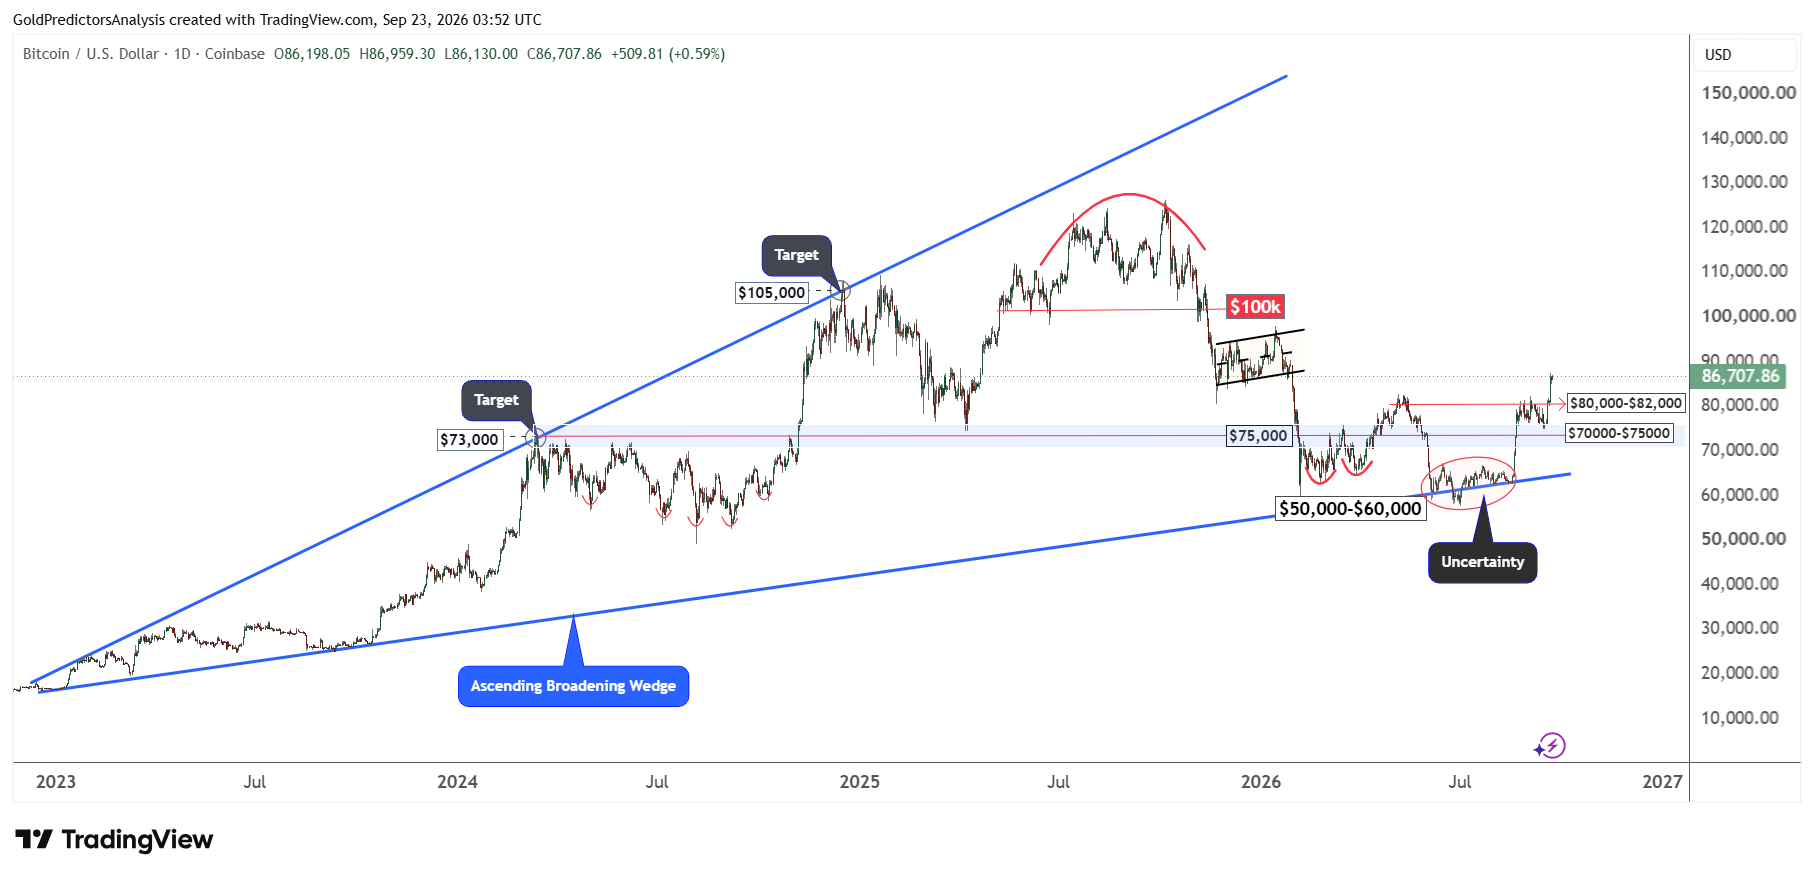
The breakout above $82,300 is clearly shown on the daily chart below. It followed the bottom formation process from June to August below the $67,000 level. The consolidation during the first two weeks of September was also positive. This suggests that the break above $82,300 will likely push the price toward $100,000 in the short term.
What to Watch Next for Bitcoin
The rebound in Bitcoin has support from ETF inflows, recent purchases by the Strategy and the break above the 50-week SMA. In my view, holding above $82,300 would keep $100,000 in sight. A break above $100,000 could then open the way to $135,000. Higher yields remain the risk to the rally. The Bitcoin to gold ratio has also turned higher, but it needs to rise above 30-35 to show lasting strength against gold.
Read more: Is Bitcoin Preparing for a Move to $100,000?