
Gold & Silver Outlook: Hawkish Fed Keeps Metals Capped as Inflation Concerns Broaden
Gold and silver have been hard pressed to move this week between ongoing risks from inflation, the tightening of global central bank policies and conflicting safe haven demands. There are, however, definite signs that the world’s central bankers are increasing their determination to ‘fight’ inflation.
Last week, the Federal Reserve raised its key policy rate by 0.25% and signaled that more hikes may be on the way. Richmond Fed President Tom Barkin said this week that recent data have shown the U.S. economy continues to strengthen and that risks to the outlook remain tilted to the upside, especially with regard to inflation.
As for precious metals, Barkin said he no longer believes that recent inflation pressures can be explained by energy and other “first-round”shocks and that the U.S. central bank will most likely need to maintain its restrictive policy for an extended period of time. Given the current pace of inflation, he is most probably right.
Markets expect a 90% chance of another rate hike by the Fed this year. The Fed itself expect rates to rise this year. Meanwhile, the core inflation the Fed is most interested in is not expected to reach their 2% goal until 2029. With inflation expected to be elevated for an extended period of time, the opportunity cost of not holding income producing assets like Gold and Silver is expected to rise.
There are counterbalancing trends. Middle East tensions are bullish for both gold and silver as higher energy prices are inflationary. Saudi Arabia’s recent increase in oil exports is deflationary.
Silver shares similar trends to Gold. Silver has the additional support of a strong industrial base. Strong trends in electronics and renewable energy are supporting Silver demand and differentiating Silver from Gold.
The outlook for both Gold and Silver is bearish with additional tightening by the Fed. From a strategic viewpoint, the additional geopolitical and industrial trends should provide some offset to the expected bearish trends.
Gold Technical Analysis: XAU/USD Holds $4,334 Support as $4,370 Resistance Keeps the Triangle Intact
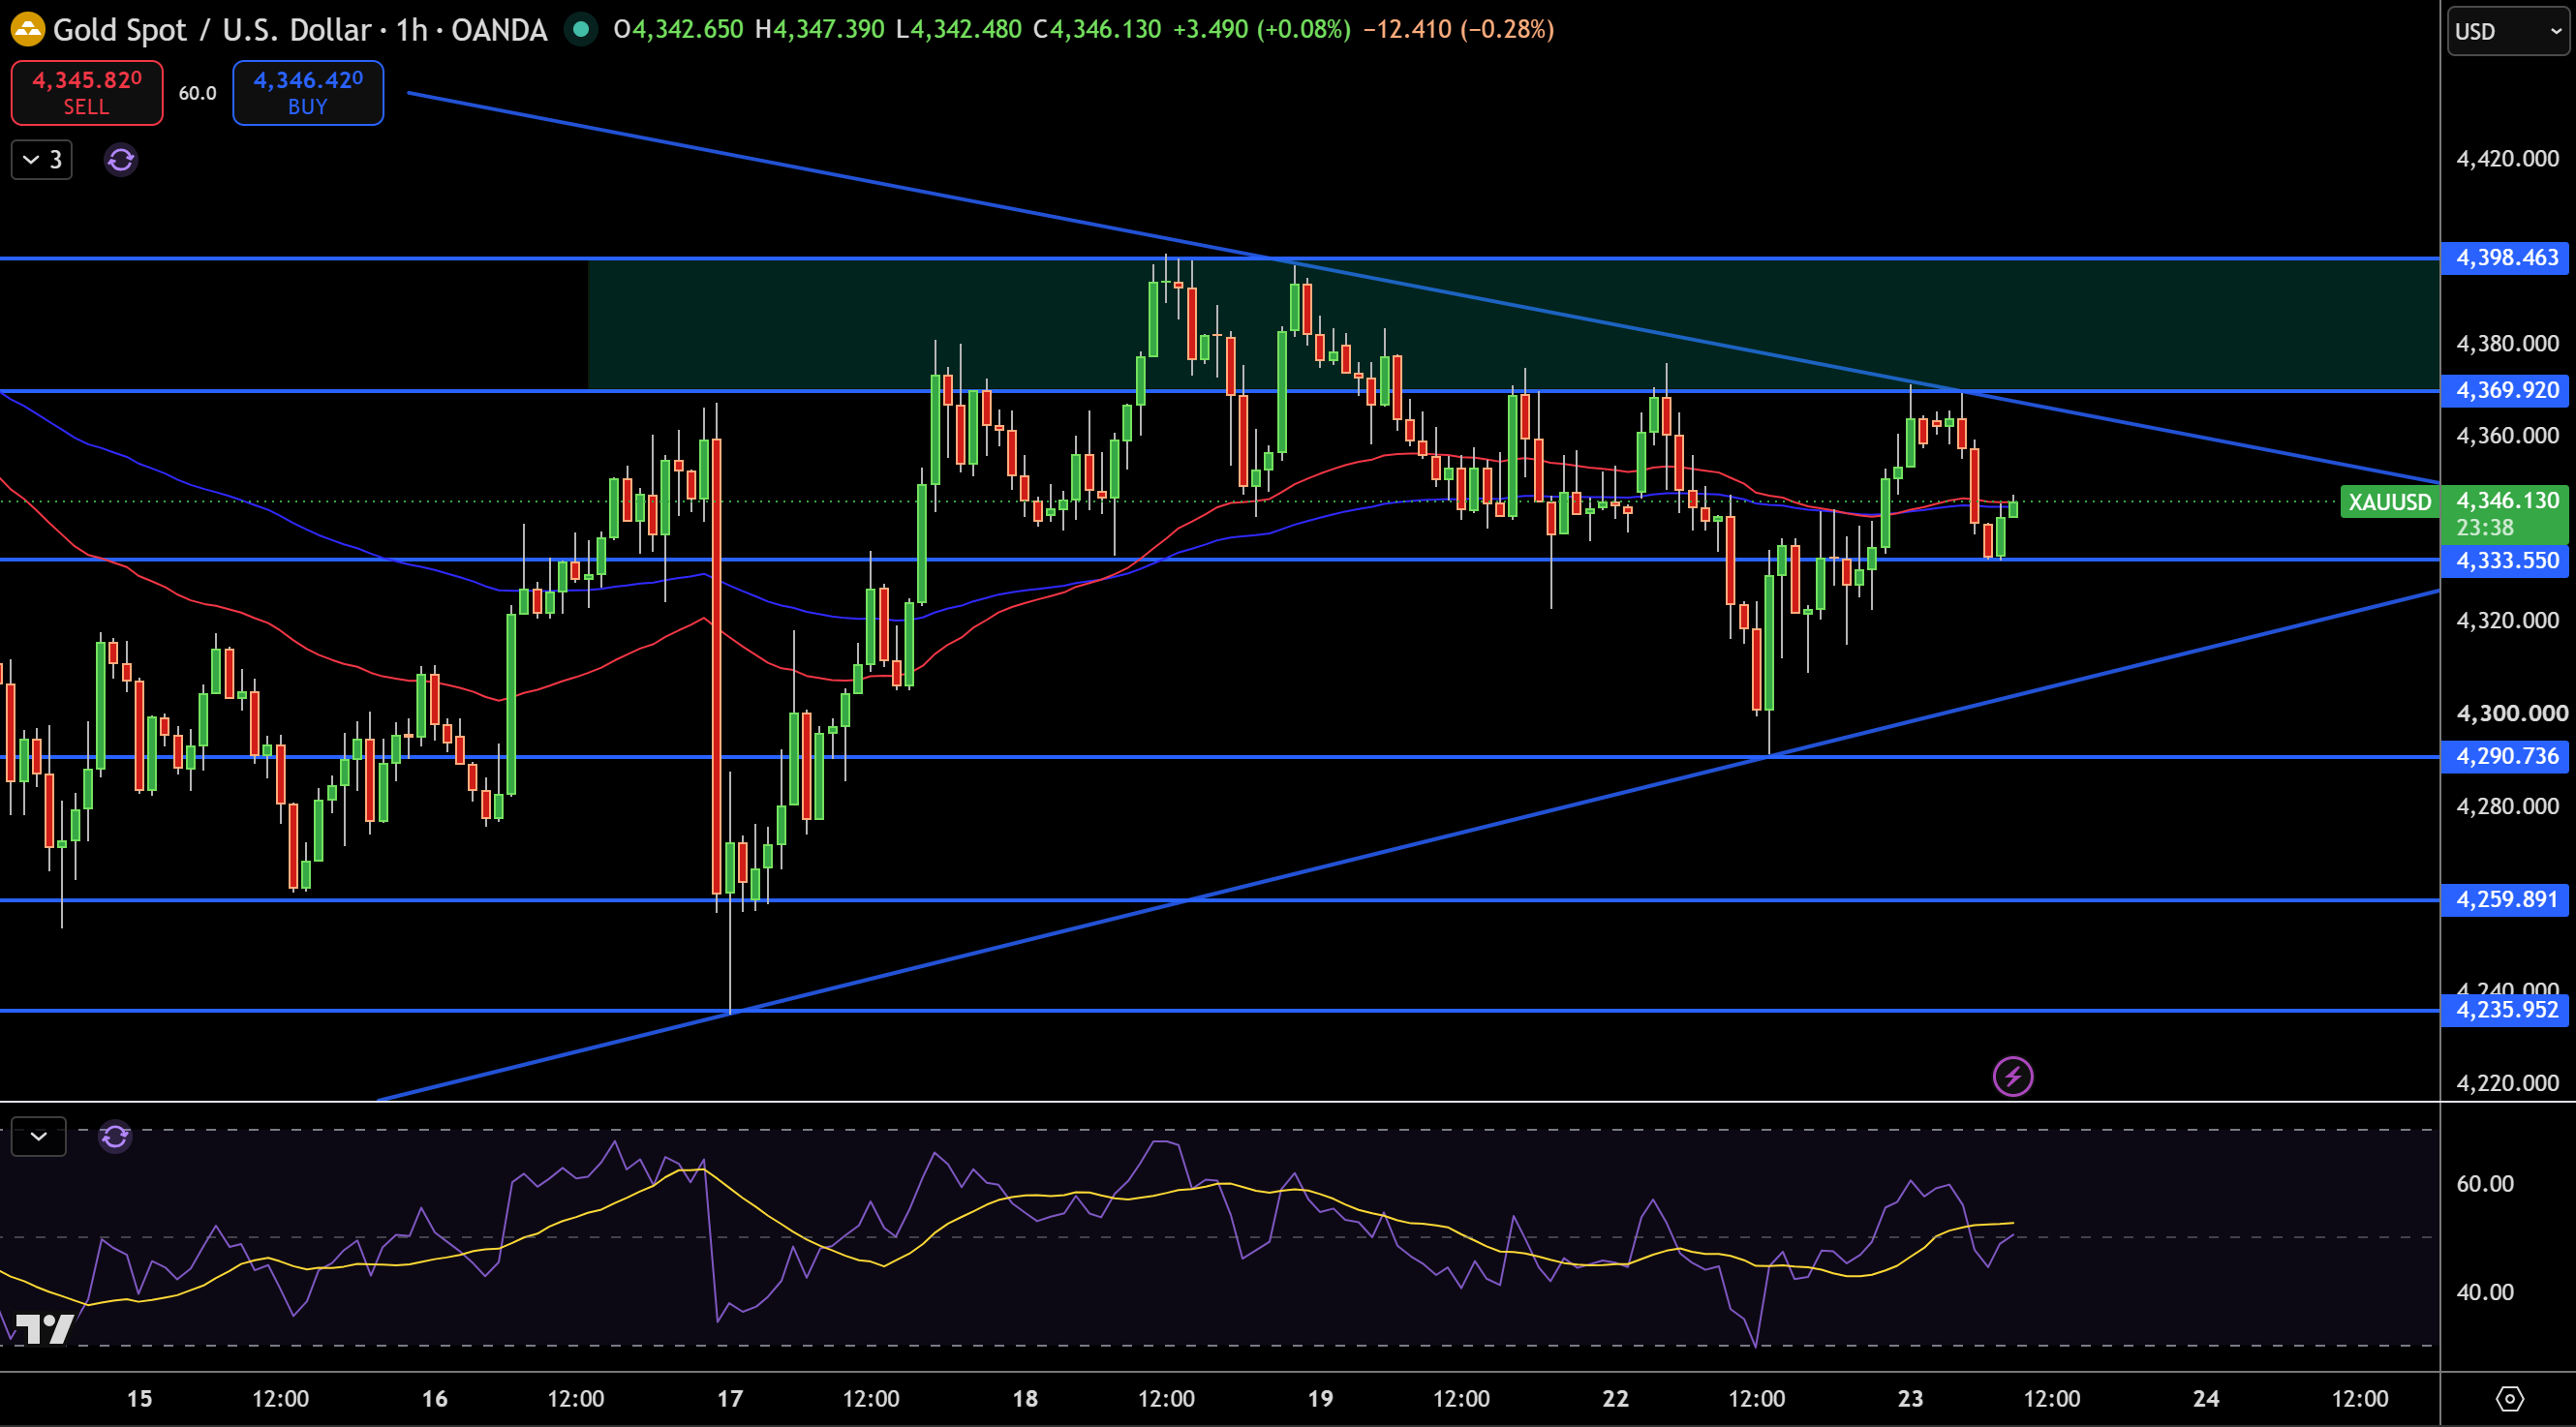
Gold (XAU/USD) is currently just under the $4,346 level on the 1 hr chart. Currently price has support at $4,334 and resistance at the downsloping trendline. Price has tested the support level at $4,334 numerous times. Although price has support at $4,334, the overall trend remains down, as price has not been able to break the series of lower highs.
The first resistance is at $4,370. If price does break above $4,370, then the next level of resistance is at $4,398. If price breaks the $4,334 level, the next support levels are at $4,291 and $4,260.
Momentum is currently neutral. RSI is currently at the 50 level. I am neutral on the spot price of gold between $4,334 and $4,370. If the price of gold breaks above $4,398, I will be bullish on the spot price of gold. If price of gold breaks the support level at $4,334, I will be bearish and expect it to head to the $4,291 level.
Gold Price Forecast
Every new Gold analysis as it publishes, today's technical signal and key levels, live price — on one page.
See all Gold forecastsSilver Technical Analysis: XAG/USD Holds Above $65.72 as $67.39 Becomes the Immediate Upside Test
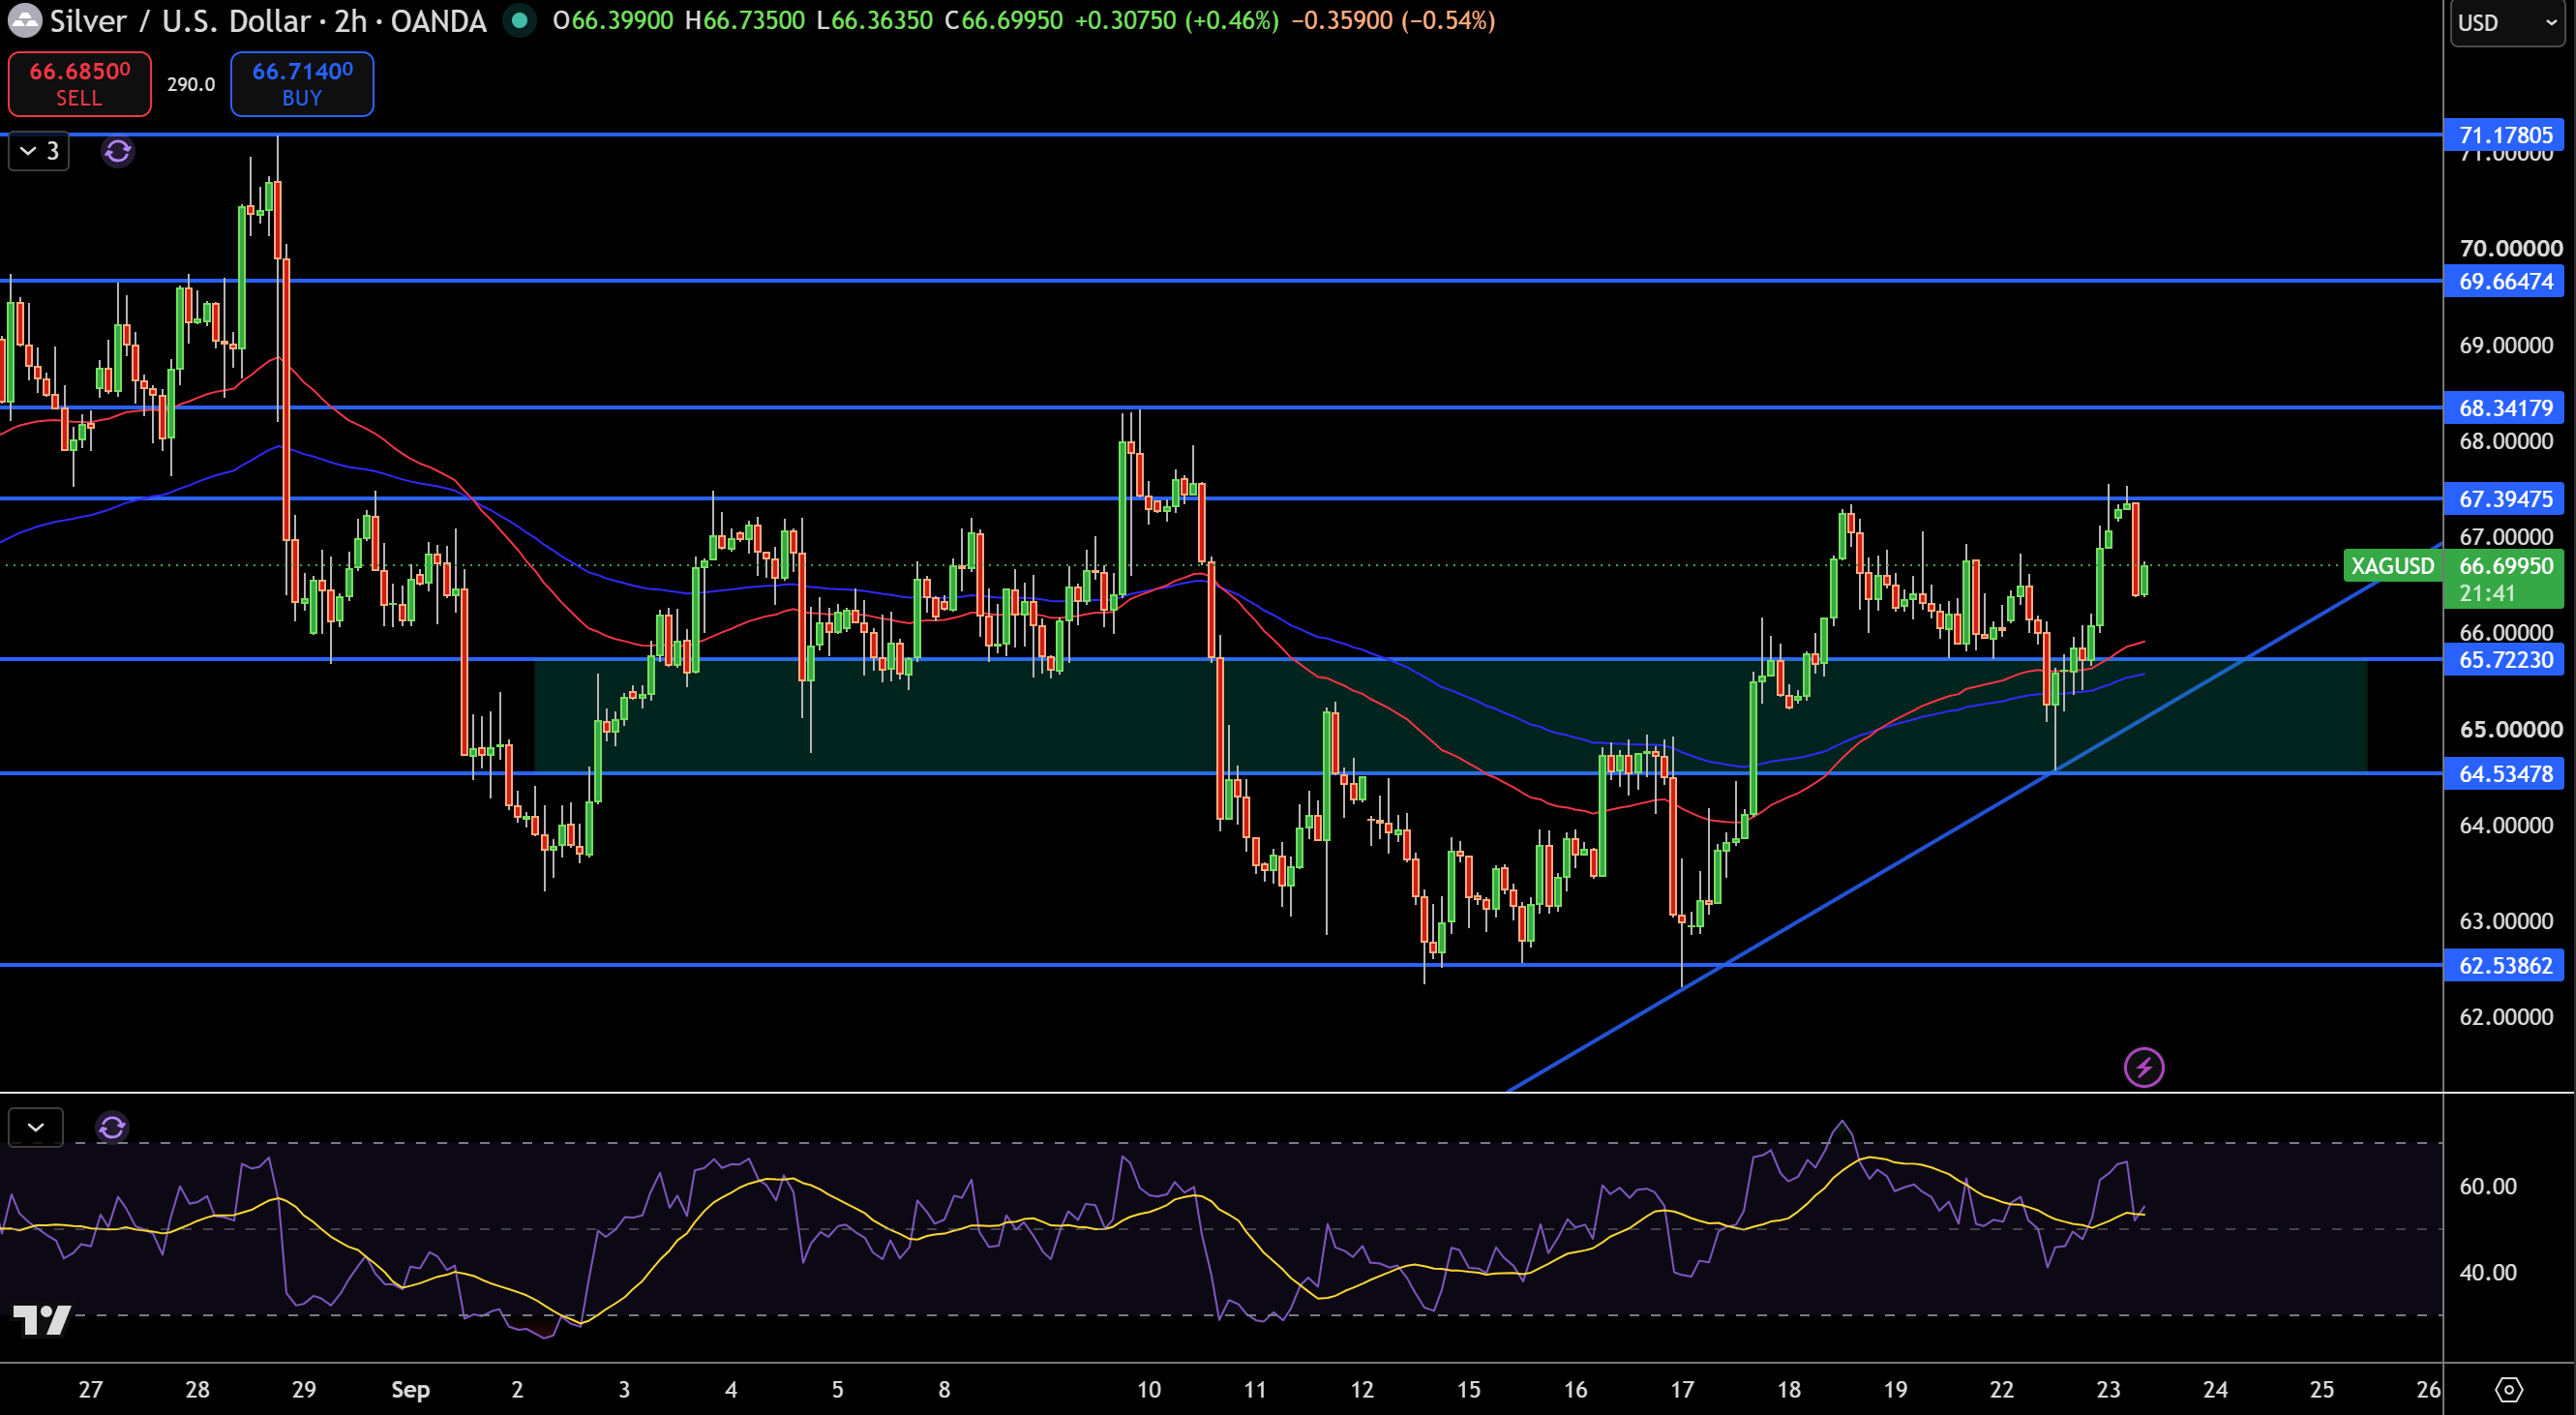
Silver has found support around 66.70 on the 2 hour chart after correcting from the 64.53 to 65.72 area. The 65.72 area is a support to watch as price has been respecting a rising trendline by trading above it and the two moving averages. This gives the recent up move a stronger underpinning as compared to the previous bounce attempts.
An immediate resistance to watch is the 67.39 area. A move above that would bring the 68.34 area into focus, and beyond that the 69.66 and 71.18 areas. If price continues to move lower, the trendline and the 65.72 area would provide support, with the 64.53 area and 62.54 area coming into play lower.
The RSI is also bullish and indicates that the trend is rising. The moving averages are also providing a bullish signal. I like the long side of silver as long as it trades above the 65.72 area and rising trendline. A move below 65.72 would turn the trend bearish, and a break of 64.53 would open the 62.54 area to the downside. A break of the 67.39 area would support the rising trendline and open the 68.34 area to the upside.