


Sharp Breakout Confirms Trend Support
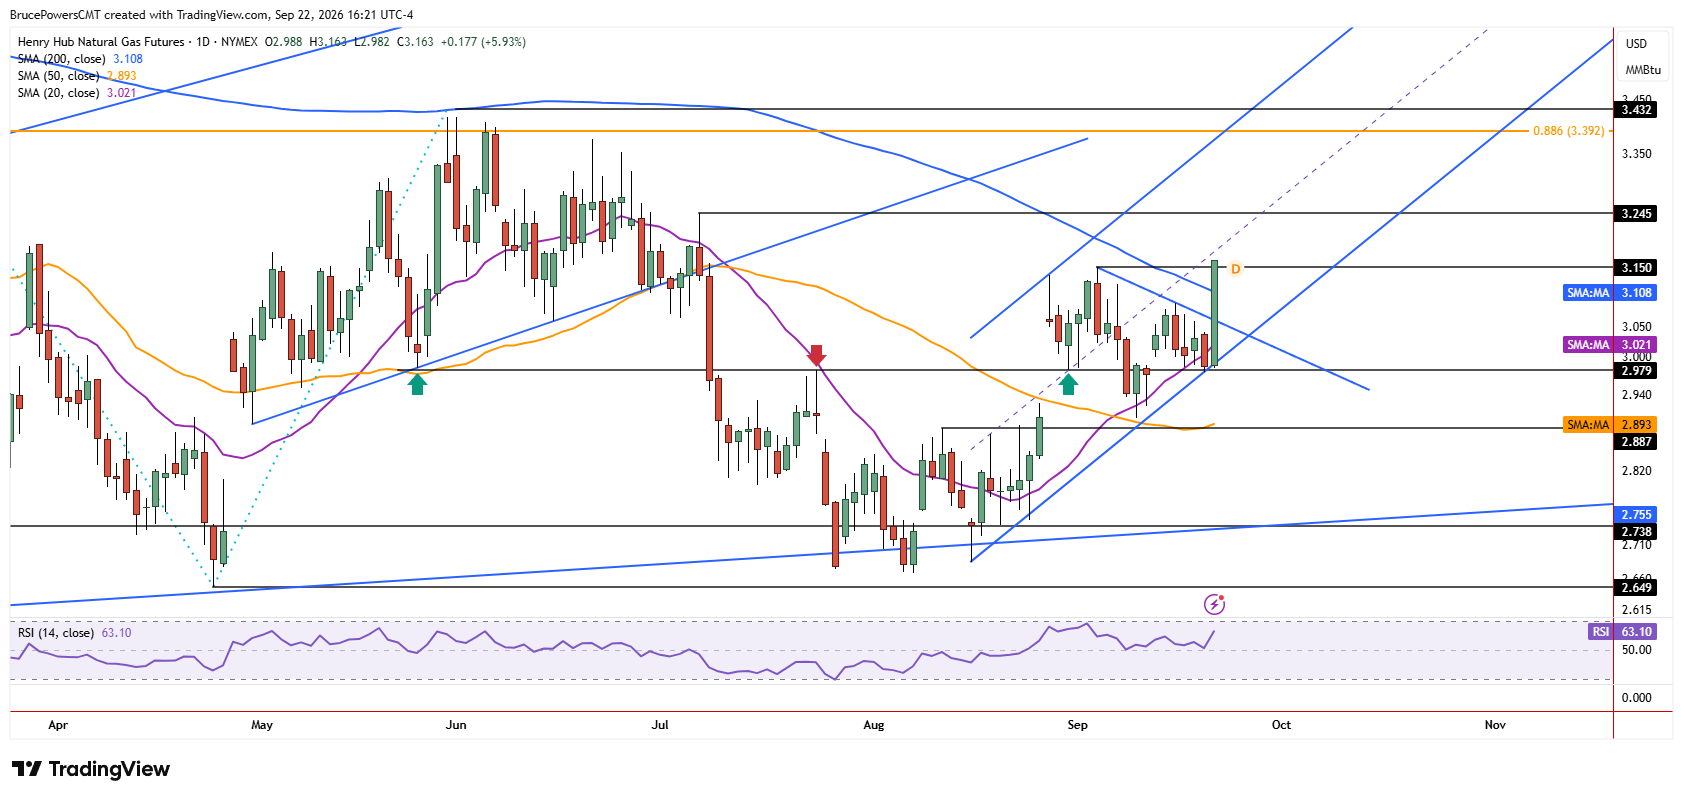
Natural gas triggered a sharp upside breakout from a consolidation zone on Tuesday, thereby confirming key trend support and the likely extension of the developing advance. The high for the session was $3.15 at the time of writing, which followed confirmation of strength on the reclaim of the 200-day moving average. That average has represented dynamic resistance since February and is now near $3.11.

Momentum Builds Above Major Resistance
Strong bullish momentum on a breakout after a successful test of a key dynamic support zone, as represented by the 20-day moving average, is bullish behavior that suggests an extension of the current advance that followed the August lows. A sustained reclaim of the 200-day moving average could be the beginning of further strengthening for natural gas but only if it can be sustained and it is followed by additional confirmation.
$3.25 Becomes Next Major Target
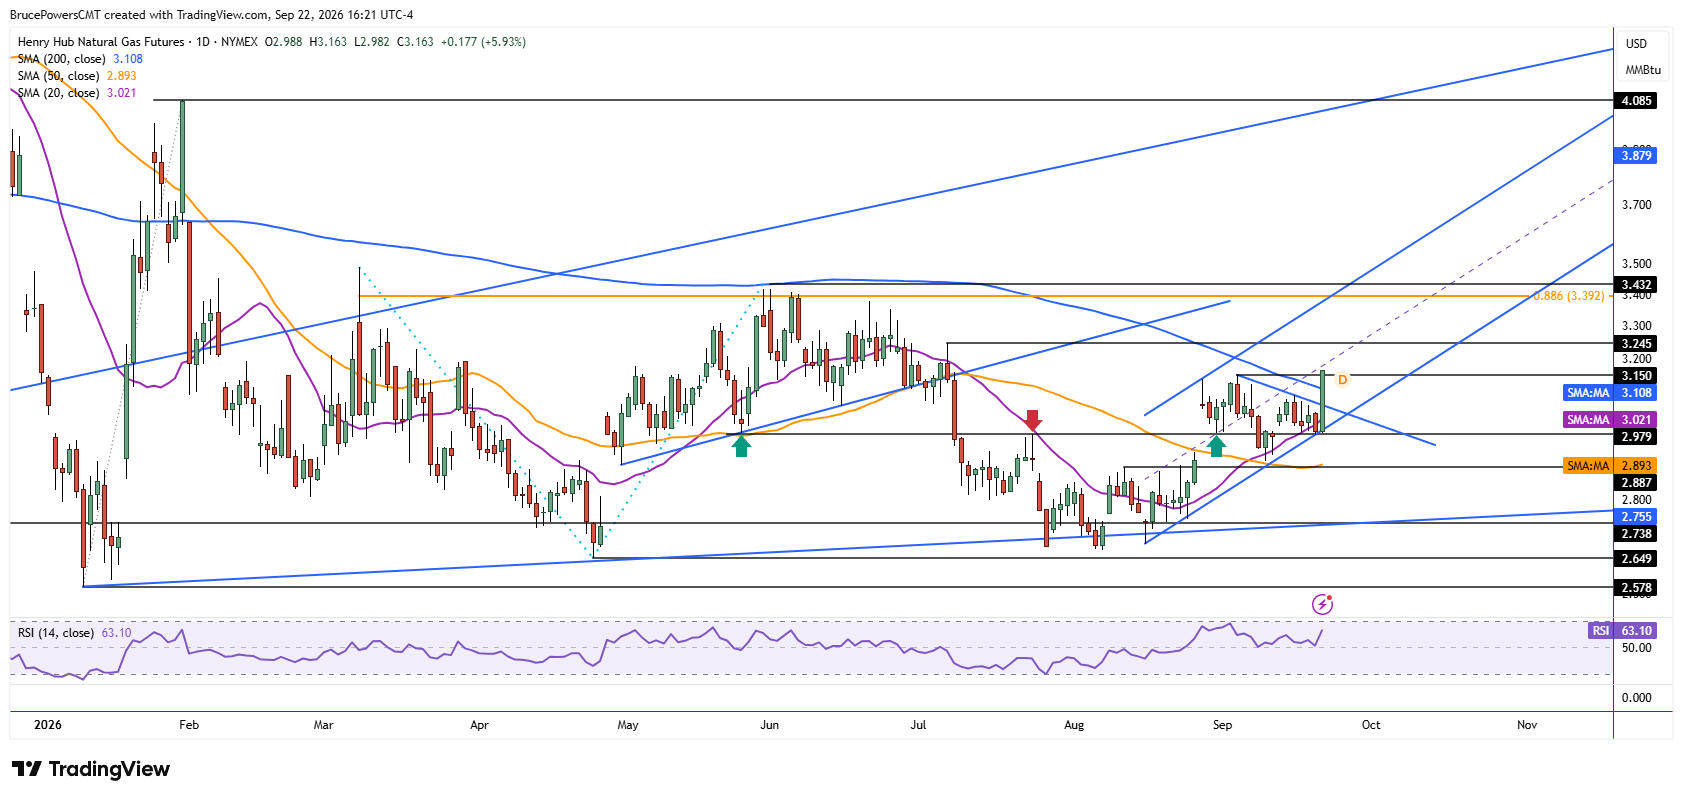
If a rally above $3.15 confirms with a daily close above it, a bullish trend continuation signal will be triggered. Of course, that would further confirm the reclaim of the 200-day moving average, adding to potential demand. If $3.15 is exceeded, then the lower swing high of $3.25 becomes the next upside target. Notably, that price zone was where sellers regained control in early July, leading to a breakdown from consolidation and drop below trend support at the 50-day moving average. This would suggest that since price is now heading toward that zone with potentially little resistance in between, it has a good chance of being reached, at a minimum.
Multiple Signals Point Higher
Tuesday’s advance also generated a new higher swing low, established near key dynamic support, not just of the 20-day moving average but also the lower trendline of a rising channel. There is also the breakout of an inside-week pattern from last week that triggered above $3.09. Together, natural gas is showing improving bullish sentiment that may just be getting started.
If you’d like to know more about how to trade natural gas, please visit our educational area.



