Key Support Zone Comes Under Pressure
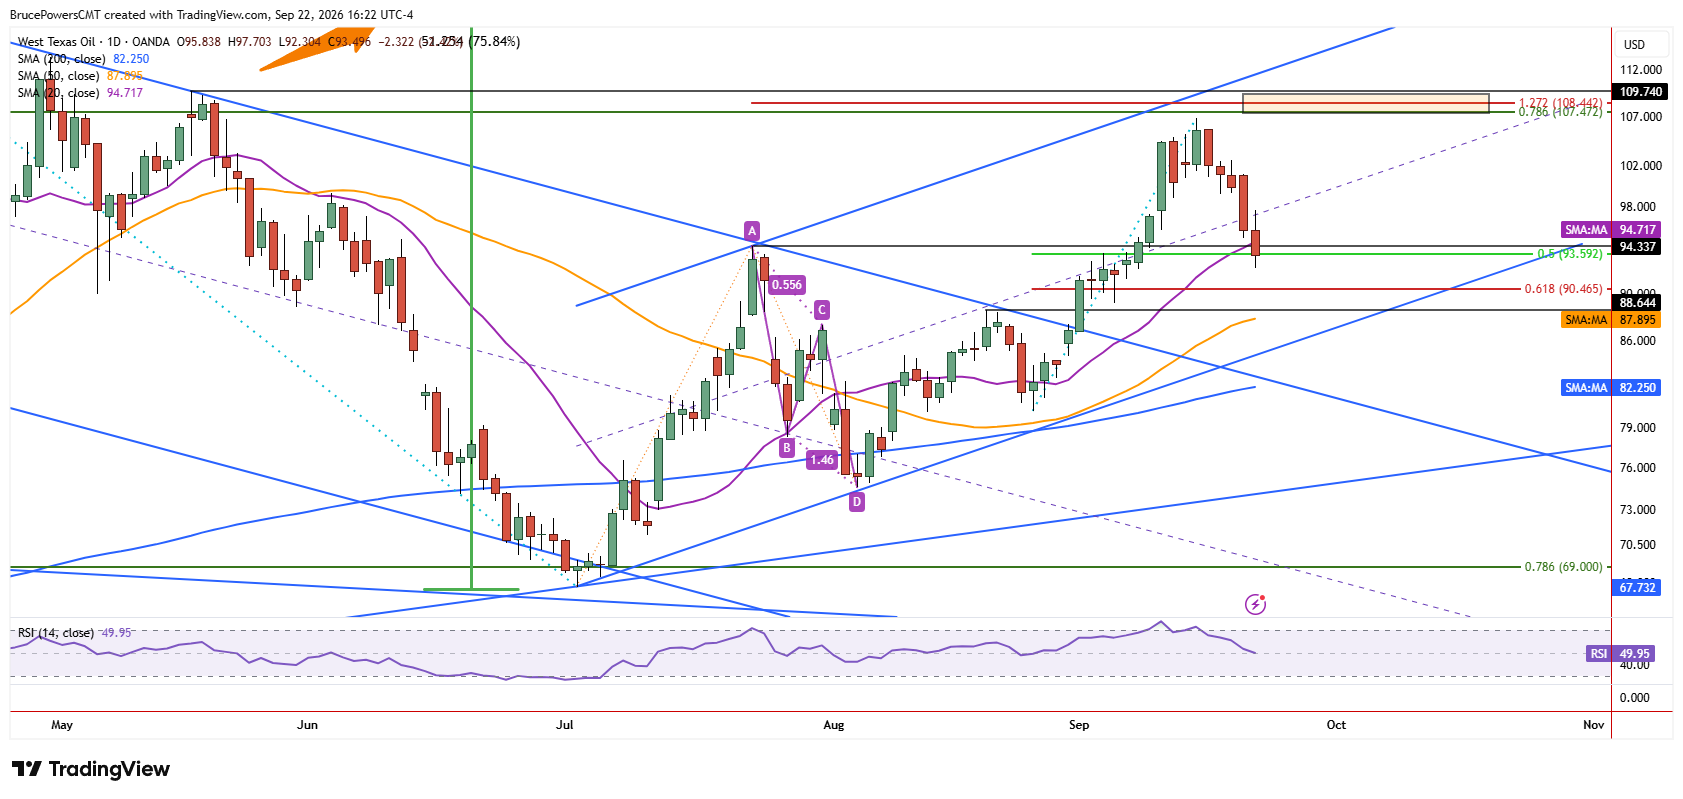
WTI crude oil extended its retracement of the prior advance on Tuesday, reaching a new low of $92.87 and further testing a key potential support zone. The lower swing high of $94.33 from July begins a potential support zone that includes the 20-day moving average at $94.74 and a 50% retracement level at $93.59. However, at the time of writing, the price zone remains at risk of breaking. If it does, the 61.8% Fibonacci retracement of the prior advance becomes the next lower target zone at $90.47.

First 20-Day Moving Average Test
Despite the persistent downward pressure represented by Tuesday’s price action, if support near Tuesday’s low holds, a bounce could follow. Since the 20-day moving average was reclaimed in September, there has not been a test of support at the indicator. So, the first approach that is occurring now could lead to the completion of the first pullback following the $106.84 high established last week.
Channel Structure Leaves Room for Deeper Losses
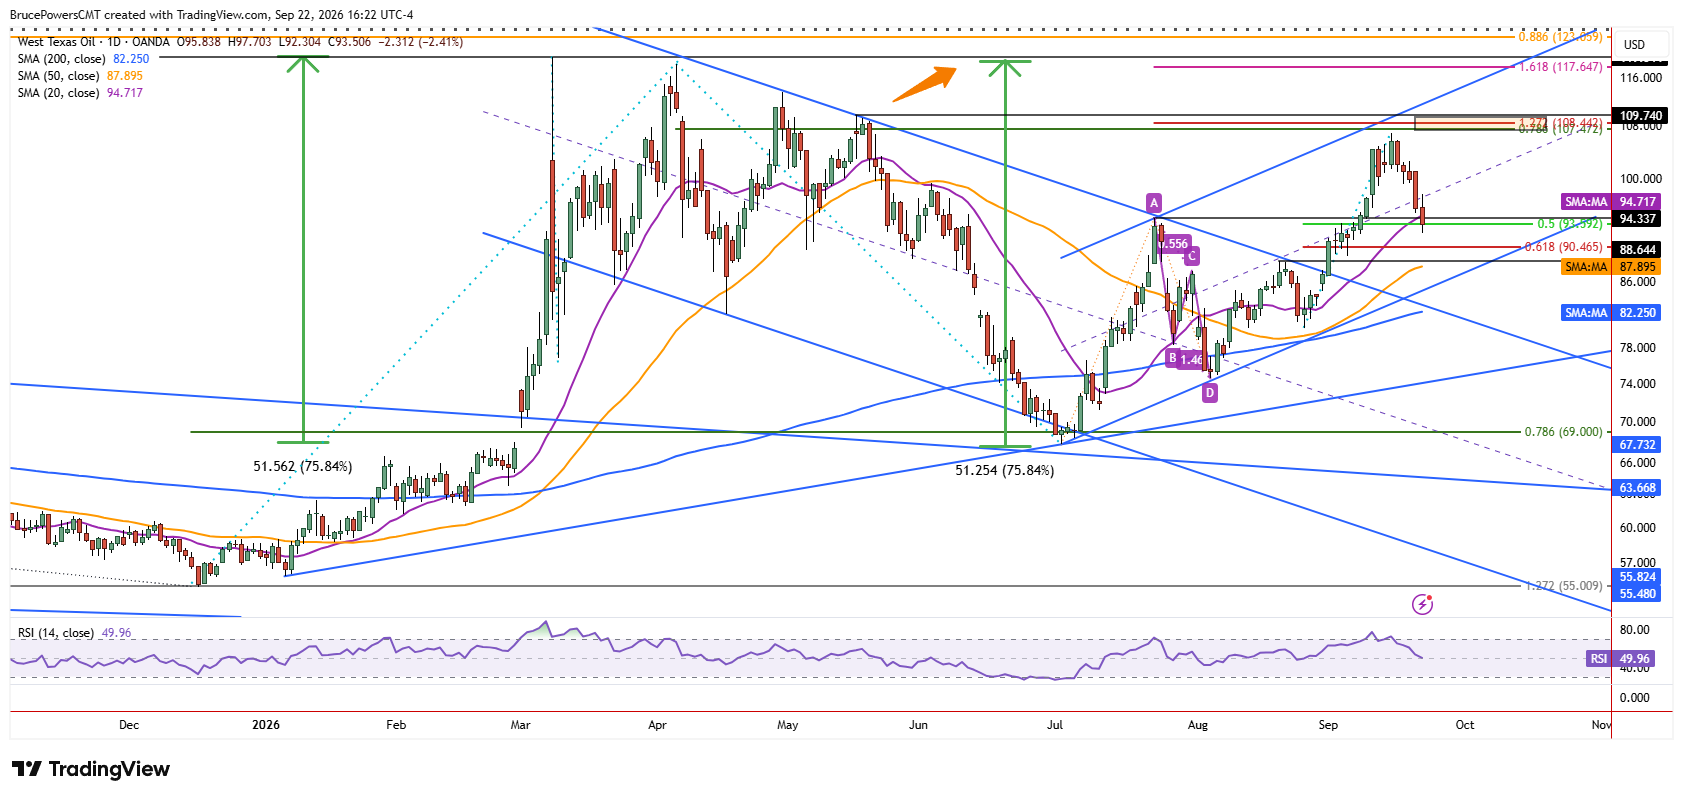
There are a couple technical reasons to consider the possibility of a deeper retracement, either after a bounce or on new lows. Last week’s high established a lower swing high near resistance represented by the upper boundary of a rising trend channel. Given the distinct bearish reaction that followed, the lower boundary of the channel becomes a potential target, suggesting further selling pressure.
In addition, a weekly bearish reversal signal triggered this week on a decline below last week’s low of $99.22. Last week’s price action took the form of a bearish shooting star candlestick pattern, adding to the significance of the signal and therefore the potential for bearish follow-through. Since there has been only one leg down so far in the retracement, a second leg down could follow a bounce. A falling ABCD pattern formed during the prior retracement in July, and it may occur again.
$101.15 Becomes Key Bullish Trigger
Having said that, if Tuesday’s low holds and a subsequent rally gets above Monday’s high of $101.15, the retracement may complete with bullish momentum confirmed by the successful test of support at the 20-day moving average.
WTI Crude Oil Price Forecast
Every new WTI Crude Oil analysis as it publishes, today's technical signal and key levels, live price — on one page.
See all WTI Crude Oil forecastsIf you’d like to know more about how to trade crude oil, please visit our educational area.