



SP500 Is Flat As Trump Says U.S. Talked To Iranian Officials In New York
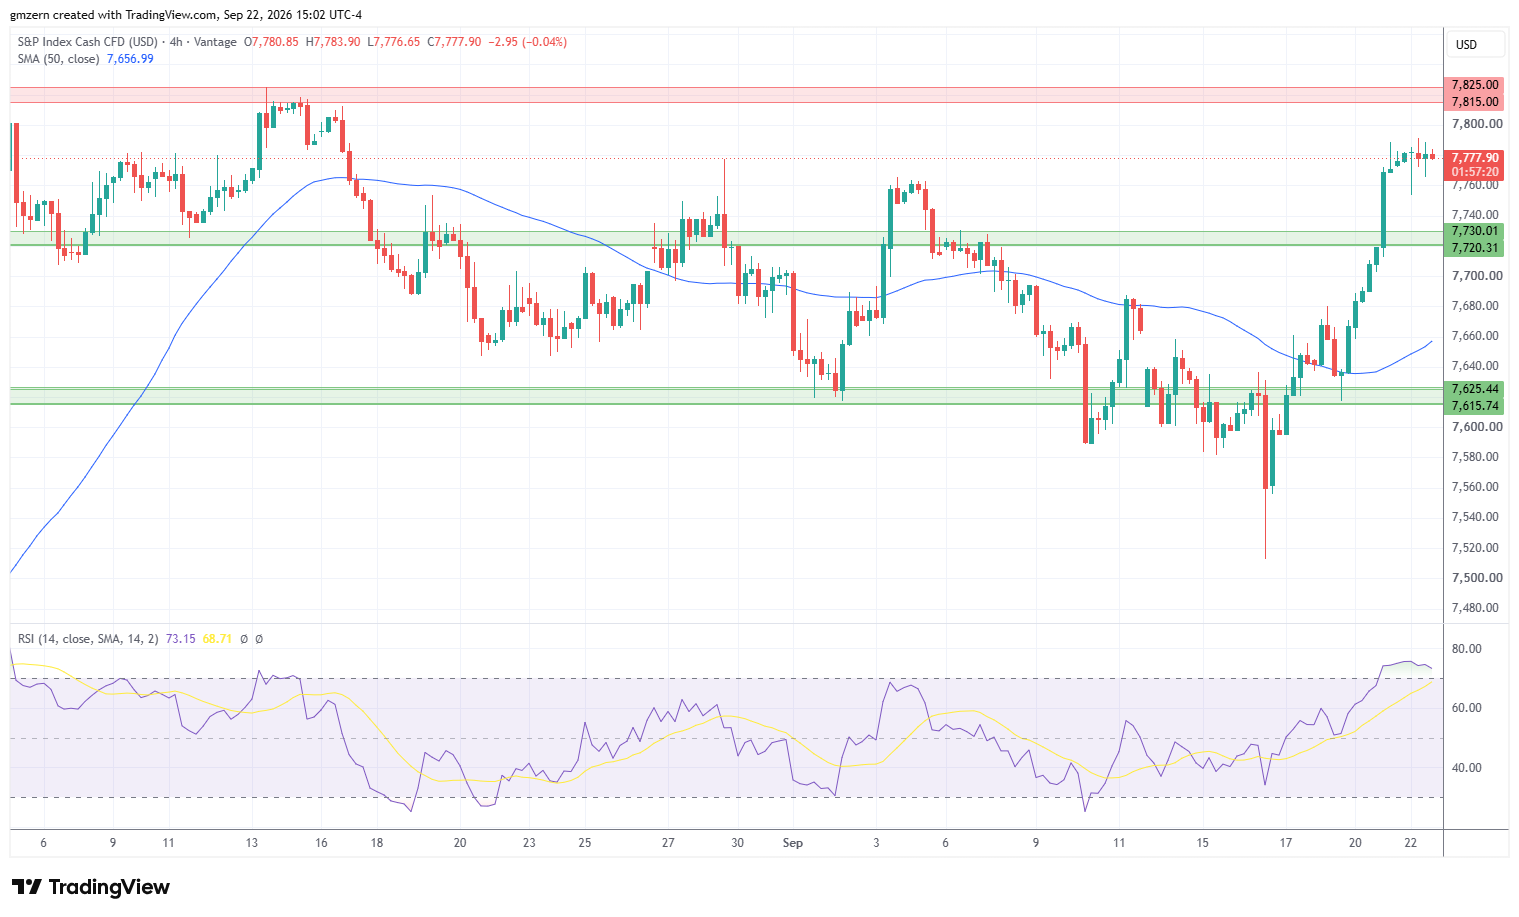
SP500 is mostly flat as traders focus on Trump’s comments on Iran and wait for Trump – Xi summit.
President Trump has recently said that U.S. officials met with Iranian officials for three hours. He added that another meeting was planned in the near term. Earlier, he threatened to destroy Iran in case the country did not agree to a deal. Oil prices pulled back as oil traders bet that U.S. and Iran would restart negotiations. Falling oil prices provided some support to SP500.
Interestingly, Treasury yields moved higher despite the pullback in the oil markets. The yield of 2-year Treasuries climbed above the 4.75% level, while the yield of 10-year Treasuries settled above 4.96%.
Basic materials stocks were among the biggest gainers today as traders focused on rising copper prices. Consumer defensive stocks have also gained upside momentum as some traders were ready to increase exposure to defensive sectors near all-time high levels. Financial and energy stocks found themselves under pressure.
In case SP500 manages to settle above the 7780 level, it will head towards the nearest resistance level, which is located in the 7815 – 7825 range. A move above the 7825 level will push SP500 towards the 7850 level.
On the support side, a move below the 7750 level will push SP500 towards the support at 7720 – 7730. If SP500 declines below the 7730 level, it will head towards the 50 MA at 7657.

NASDAQ Gains Ground As Traders Buy AI Stocks
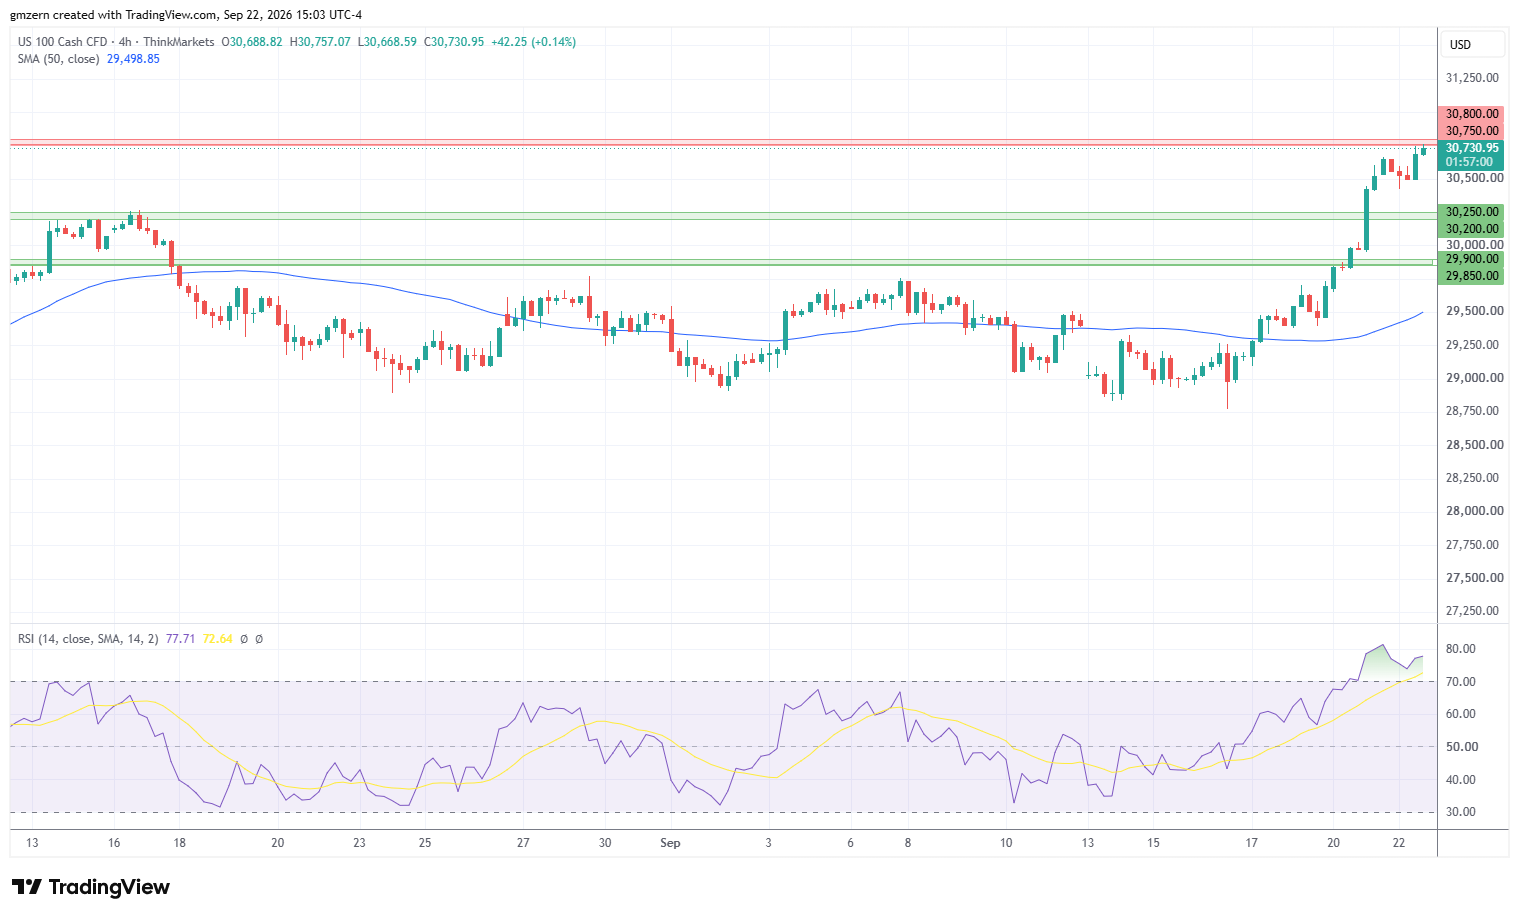
NASDAQ tested new highs as traders remained bullish on AI-related stocks. Sandisk, which was up by +7%, was among the biggest gainers in the NASDAQ index today. Traders stay bullish on AI and bet that demand for memory will continue to increase at a robust pace.
Currently, NASDAQ is trying to settle above the resistance at 30,750 – 30,800. In case NASDAQ manages to settle above the 30,800 level, it will head towards the 31,000 level. A move above 31,000 will open the way to the test of the 31,500 level. RSI remains in the overbought territory, so the risks of a pullback are rising.
On the support side, a move below the 30,500 level will push NASDAQ towards the nearest support, which is located in the 30,200 – 30,250 range.
Dow Jones Price Forecast
Every new Dow Jones analysis as it publishes, today's technical signal and key levels, live price — on one page.
See all Dow Jones forecastsDow Jones Moves Lower As Cisco Dives 5%
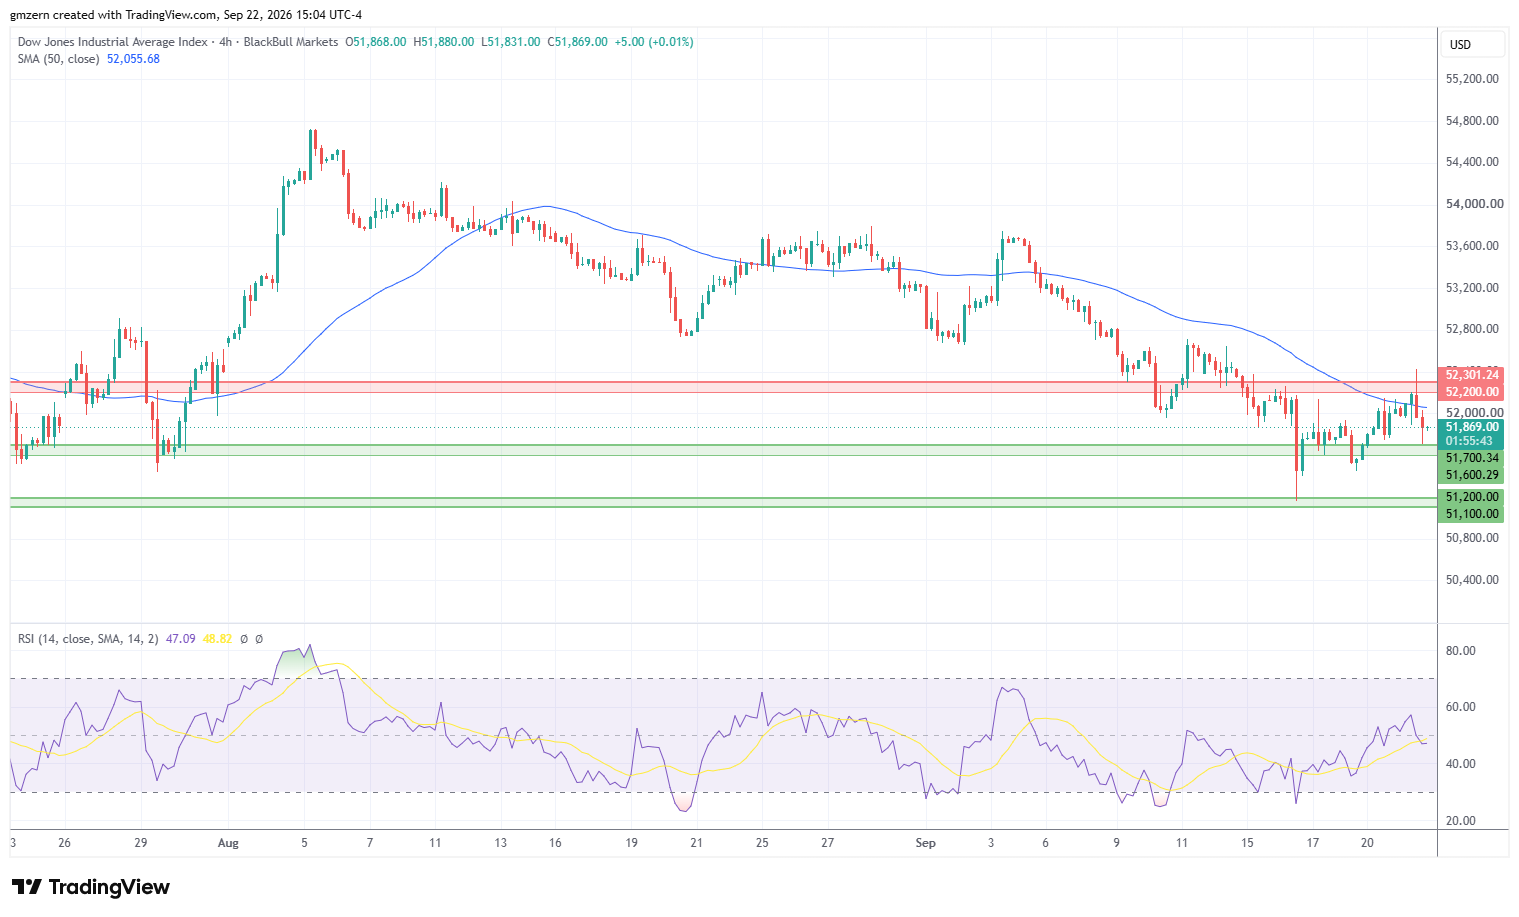
Dow Jones pulled back as Cisco shares pulled back by -5%. JPMorgan and American Express were also among the biggest losers in the Dow Jones index today.
Interestingly, the pullback in the oil markets did not provide any support to Dow Jones. It looks that the index was more sensitive to rising Treasury yields, compared to SP500 and NASDAQ.
From the technical point of view, Dow Jones settled below the 50 MA at 52,056 and made an attempt to settle below the support level at 51,600 – 51,700. In case Dow Jones manages to settle below the 51,600 level, it will head towards the next support, which is located near recent lows at 51,100 – 51,200. RSI is in the moderate territory, so there is plenty of room to gain downside momentum in case the right catalysts emerge.
For a look at all of today’s economic events, check out our economic calendar.


