Silver Breaks Under $65.32 After Friday’s Rally Runs Out of Buyers
Friday’s two-day rally stopped cold at $67.34. Tuesday took it apart. Silver opened near $66.82, sold through Friday’s low and crossed below the $65.32 pivot before European desks had a chance to respond. The dollar is firmer and building on last week’s recovery after taking out a swing top. The 10-year yield pulled back from 5.041% last week, found a floor at 4.922% and is climbing again Tuesday.
At 08:18 GMT, Spot Silver is trading $64.85, down $1.17 or -1.78%. The session high is $66.82 and the low is $64.84.

Daily Spot Silver Technical Analysis
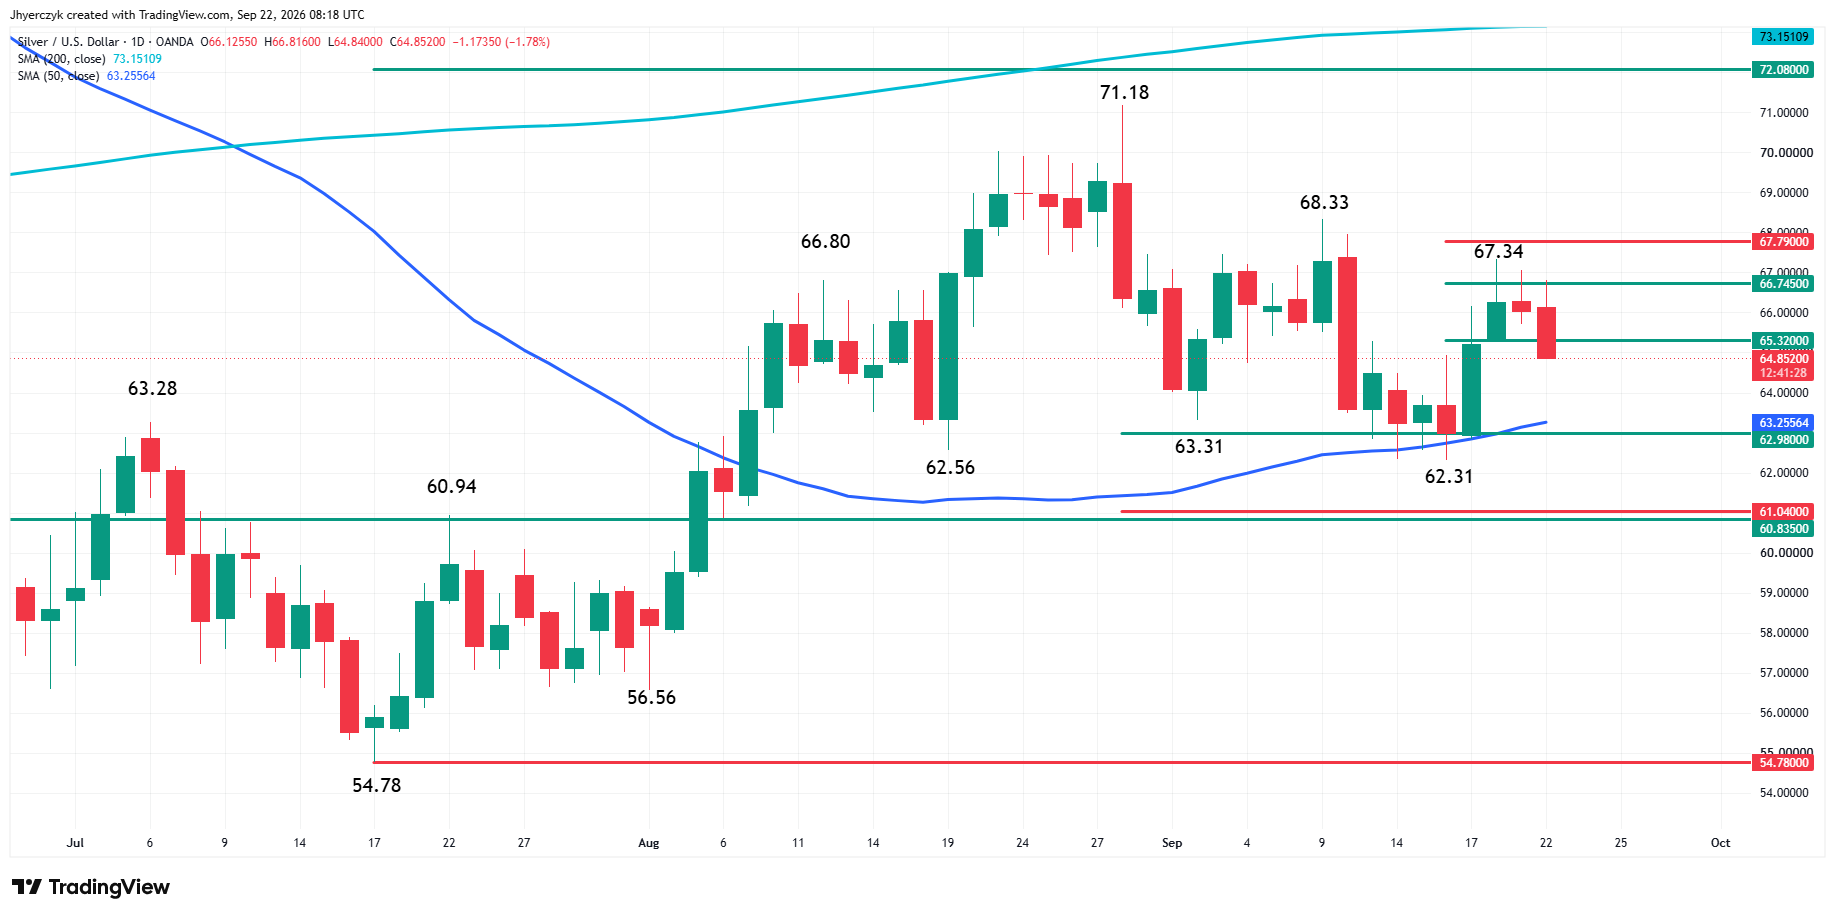
The main trend is down on the daily swing chart. A trade through $68.33 will change the main trend to up. A move through $62.31 will reaffirm the downtrend.
Silver is trading below the $65.32 minor pivot. Resistance above sits at $65.32, the $66.75 to $67.79 zone, $67.34, and $68.33.
On the downside, the 50-day moving average at $63.26. Below that, the $62.98 to $61.04 zone with the $62.31 main bottom inside it. Below the zone, $60.84.
Friday’s Rally Hit the Zone and Could Not Get Through
Silver bounced off the September low area last week and ran for two sessions. The move carried into the $66.75 to $67.79 retracement zone and stopped at $67.34. Inside the zone, not through it. Tuesday’s break through Friday’s low confirmed the rally was finished before sellers had to press for it.
Silver Price Forecast
Every new Silver analysis as it publishes, today's technical signal and key levels, live price — on one page.
See all Silver forecastsThe $67.34 high joins the chart as the latest lower top. The previous one was $68.33. The one before that was $71.18 in August. Buyers are getting less room on every rally attempt. Each one starts lower, runs into resistance sooner and fails faster than the last. Two days was all the bulls got and Tuesday gave the whole thing back before New York opened.
That progression is what makes the break under $65.32 feel different from a routine pullback. Silver is not consolidating after a strong move. It is failing at successively lower levels and the time between failures is getting shorter. The two-day rally last week lasted half as long as the move that peaked at $68.33 earlier in the month.
The Dollar Cleared a Swing Top and Keeps Building
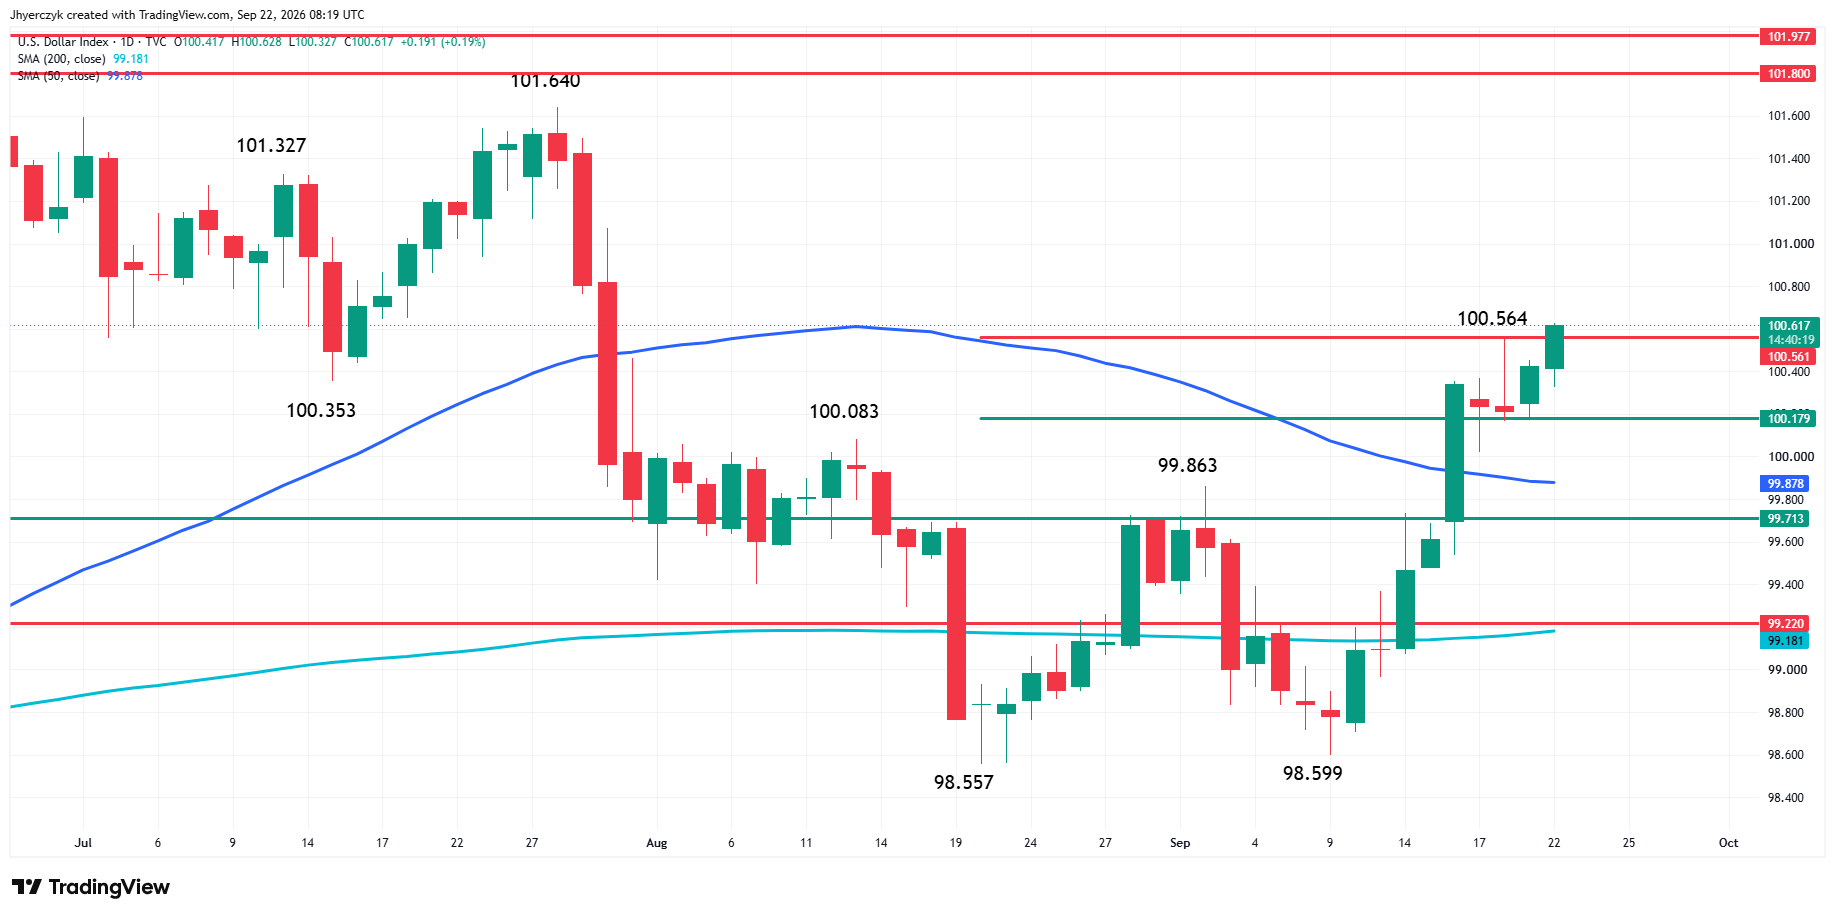
The U.S. Dollar Index is trading near 100.617. It held the 100.179 support level last week, recovered through the 50-day moving average at 99.878, crossed to the strong side of 100.561, and took out the prior swing top at 100.564 on Tuesday. Four levels cleared in the past week. The next target is 101.640.
The dollar had trouble getting above the 50-day earlier this month. That fight is over. The index is trading above the average and above the swing top that stopped it before. The recovery has its own momentum now.
Silver’s two-day rally happened while the dollar was pulling back. The dollar stopped pulling back and silver stopped rallying. The break under $65.32 happened fast enough Tuesday to tell you the bid underneath that pivot was already thin. Once the dollar started pressing higher again, there was nothing holding silver up at that level.
The 10-Year Paused Near the Highs and Started Climbing Again
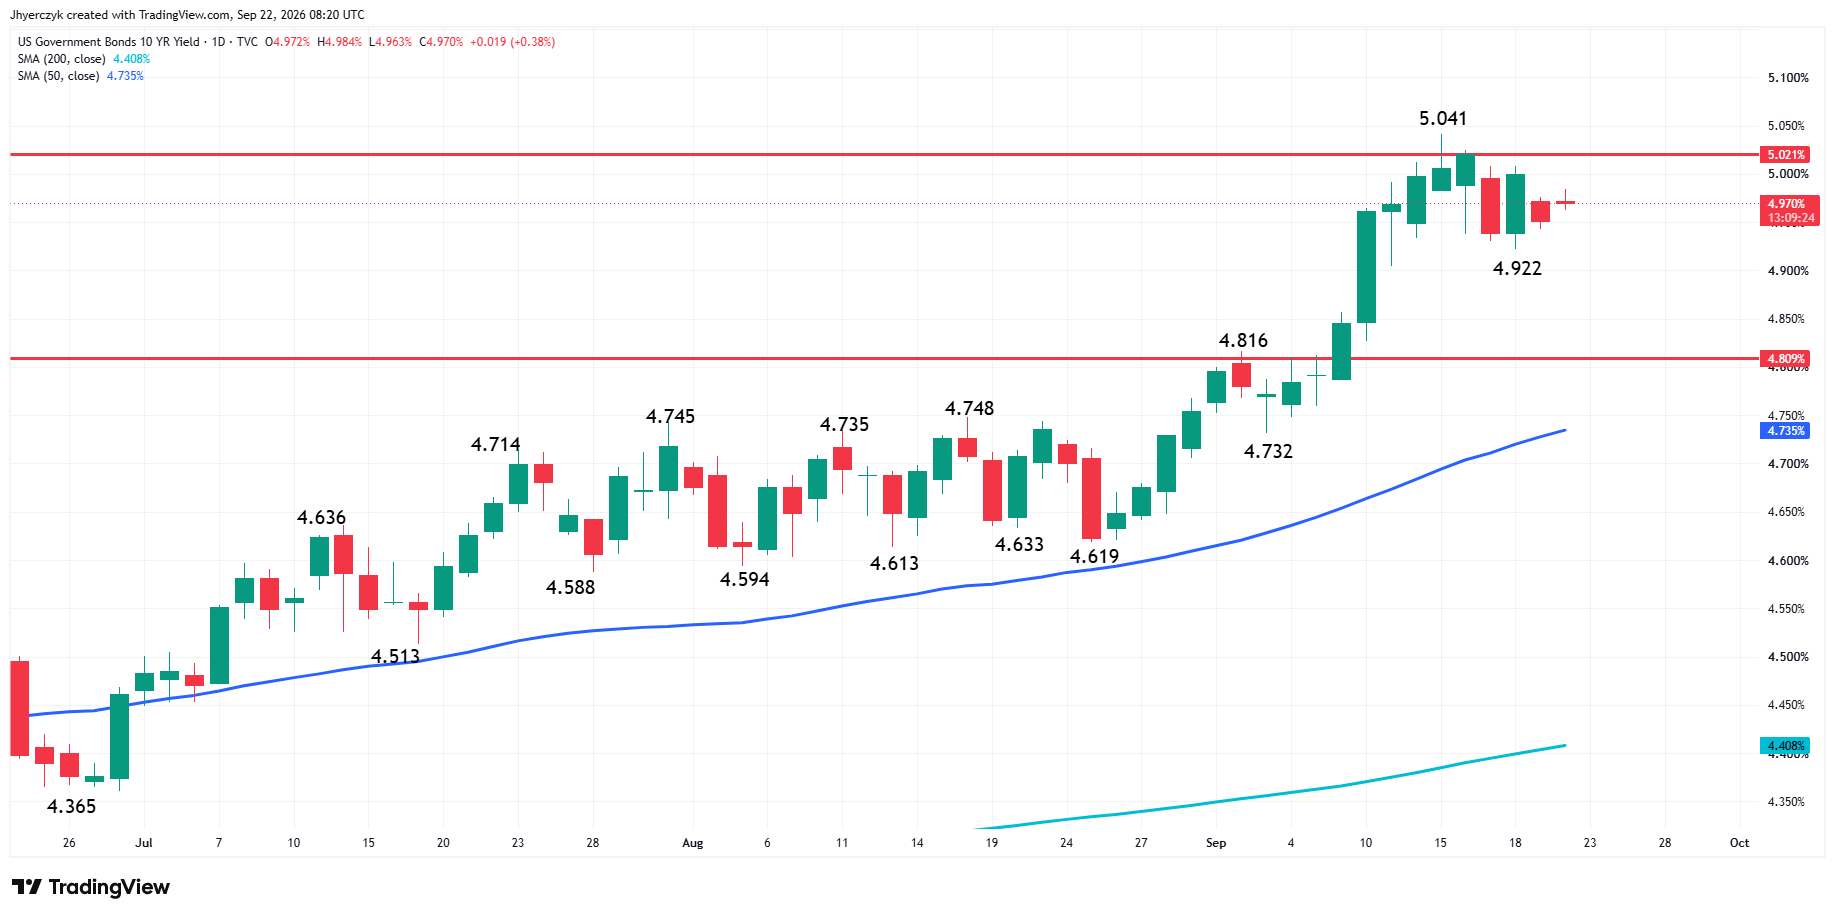
The 10-year Treasury yield is trading near 4.970%, up about 1.9 basis points Tuesday. Last week’s pullback from the 5.041% high found a floor at 4.922%. That is a yield that tested above 5%, backed off less than 12 basis points and started heading higher again. The 4.809% breakout level held easily. The 50-day moving average at 4.735% is well below.
The Fed raised 25 basis points last week to 3.75%-4.00% and signaled at least one more increase this year. Rate markets pushed October hike odds higher after the decision. The 10-year sitting near 4.97% after a hike with more on the table says the rate trade is not letting go. Silver rallied for two sessions while the yield was pulling back from 5.041%. The pullback lasted about as long as silver’s rally did. Both are over.
The resistance above is 5.021%. A sustained move through that level puts the 5.041% high back in play. The rate pressure on silver is not easing. It is settling in near the highs and waiting for the next push.
What to Watch
The rate picture does not change until the data changes it. The dollar is pressing toward 101.640. The 10-year is working back toward 5.041% after holding above 4.922%. Until something shows up in the inflation data that gives the doves a case, both keep running against silver.
Sellers have the momentum below $65.32. The 50-day at $63.26 held during the September decline. Whether it holds again depends on the dollar. If the DXY extends toward 101.640, the average gets tested. Below it, the $62.31 main bottom is the swing-chart trigger. A break there reaffirms the downtrend and puts $60.84 in play.
Buyers need the pivot back before anything else matters. The $66.75 to $67.79 zone stopped the rally Friday and sellers will be waiting there again. $68.33 turns the trend. The dollar has to fade for buyers to have a shot at reclaiming any of it. Tuesday morning says the dollar is not interested in fading.
More Information in our Economic Calendar.