
USOIL, UKOil & Natural Gas Outlook: Saudi Exports Recover as Iran Talks Ease Supply Fears
On Tuesday, balance returned to the oil market as Saudi Arabia increased exports and U.S. efforts to engage with Iran reduced concerns about disruptions to Middle East oil supplies.
Since attacks in September disrupted Saudi Arabia’s shipments via the country’s East-West pipeline, Saudi Aramco has relied on maritime shipments through the Strait of Hormuz to transport crude. Saudi shipments through the Strait have increased this month. Ship-to-ship transfers in the Omani exclusive economic zone (EEZ) have allowed Saudi, as well as other Persian Gulf producers, to export crude that otherwise would not be visible to satellite.
As the case is for WTI, geopolitics will also impact Brent. Global oil markets are stressed and any signs of progress on Iran will likely reduce the geopolitical premium. Markets, however, remain tight and further improvements in security and maritime infrastructure to improve passage through the Strait of Hormuz could help alleviate shipments via the alternative routes.
There are costs associated with supply disruption. About 15% of the world’s largest crude oil tanker fleet has been positioned near Oman, and oil tanker rates have increased because the tankers have to make several short trips in the Gulf and longer trips because of excess distance due to rerouting.
The natural gas situation remains with a supply disruption. QatarEnergy stated that about 17% of the country’s natural gas production and liquefaction capacity has been displaced as a result of the attacks on the Ras Laffan terminal. Qatar has also faced challenges in importing equipment necessary for the next phase of its natural gas production and liquefaction project because of the situation with the Strait of Hormuz.
The situation with natural gas increases risk for Europe because Europe has very little stored natural gas and relies on imports. The loss of natural gas imports from Qatar increases Europe’s reliance on other natural gas producers.
Fundamental bias: My outlook on the commodities is neutral to slightly bullish for the time being.

Natural Gas Technical Analysis: NG Holds $2.85 Support as $2.89 Resistance Keeps the Setup Compressed
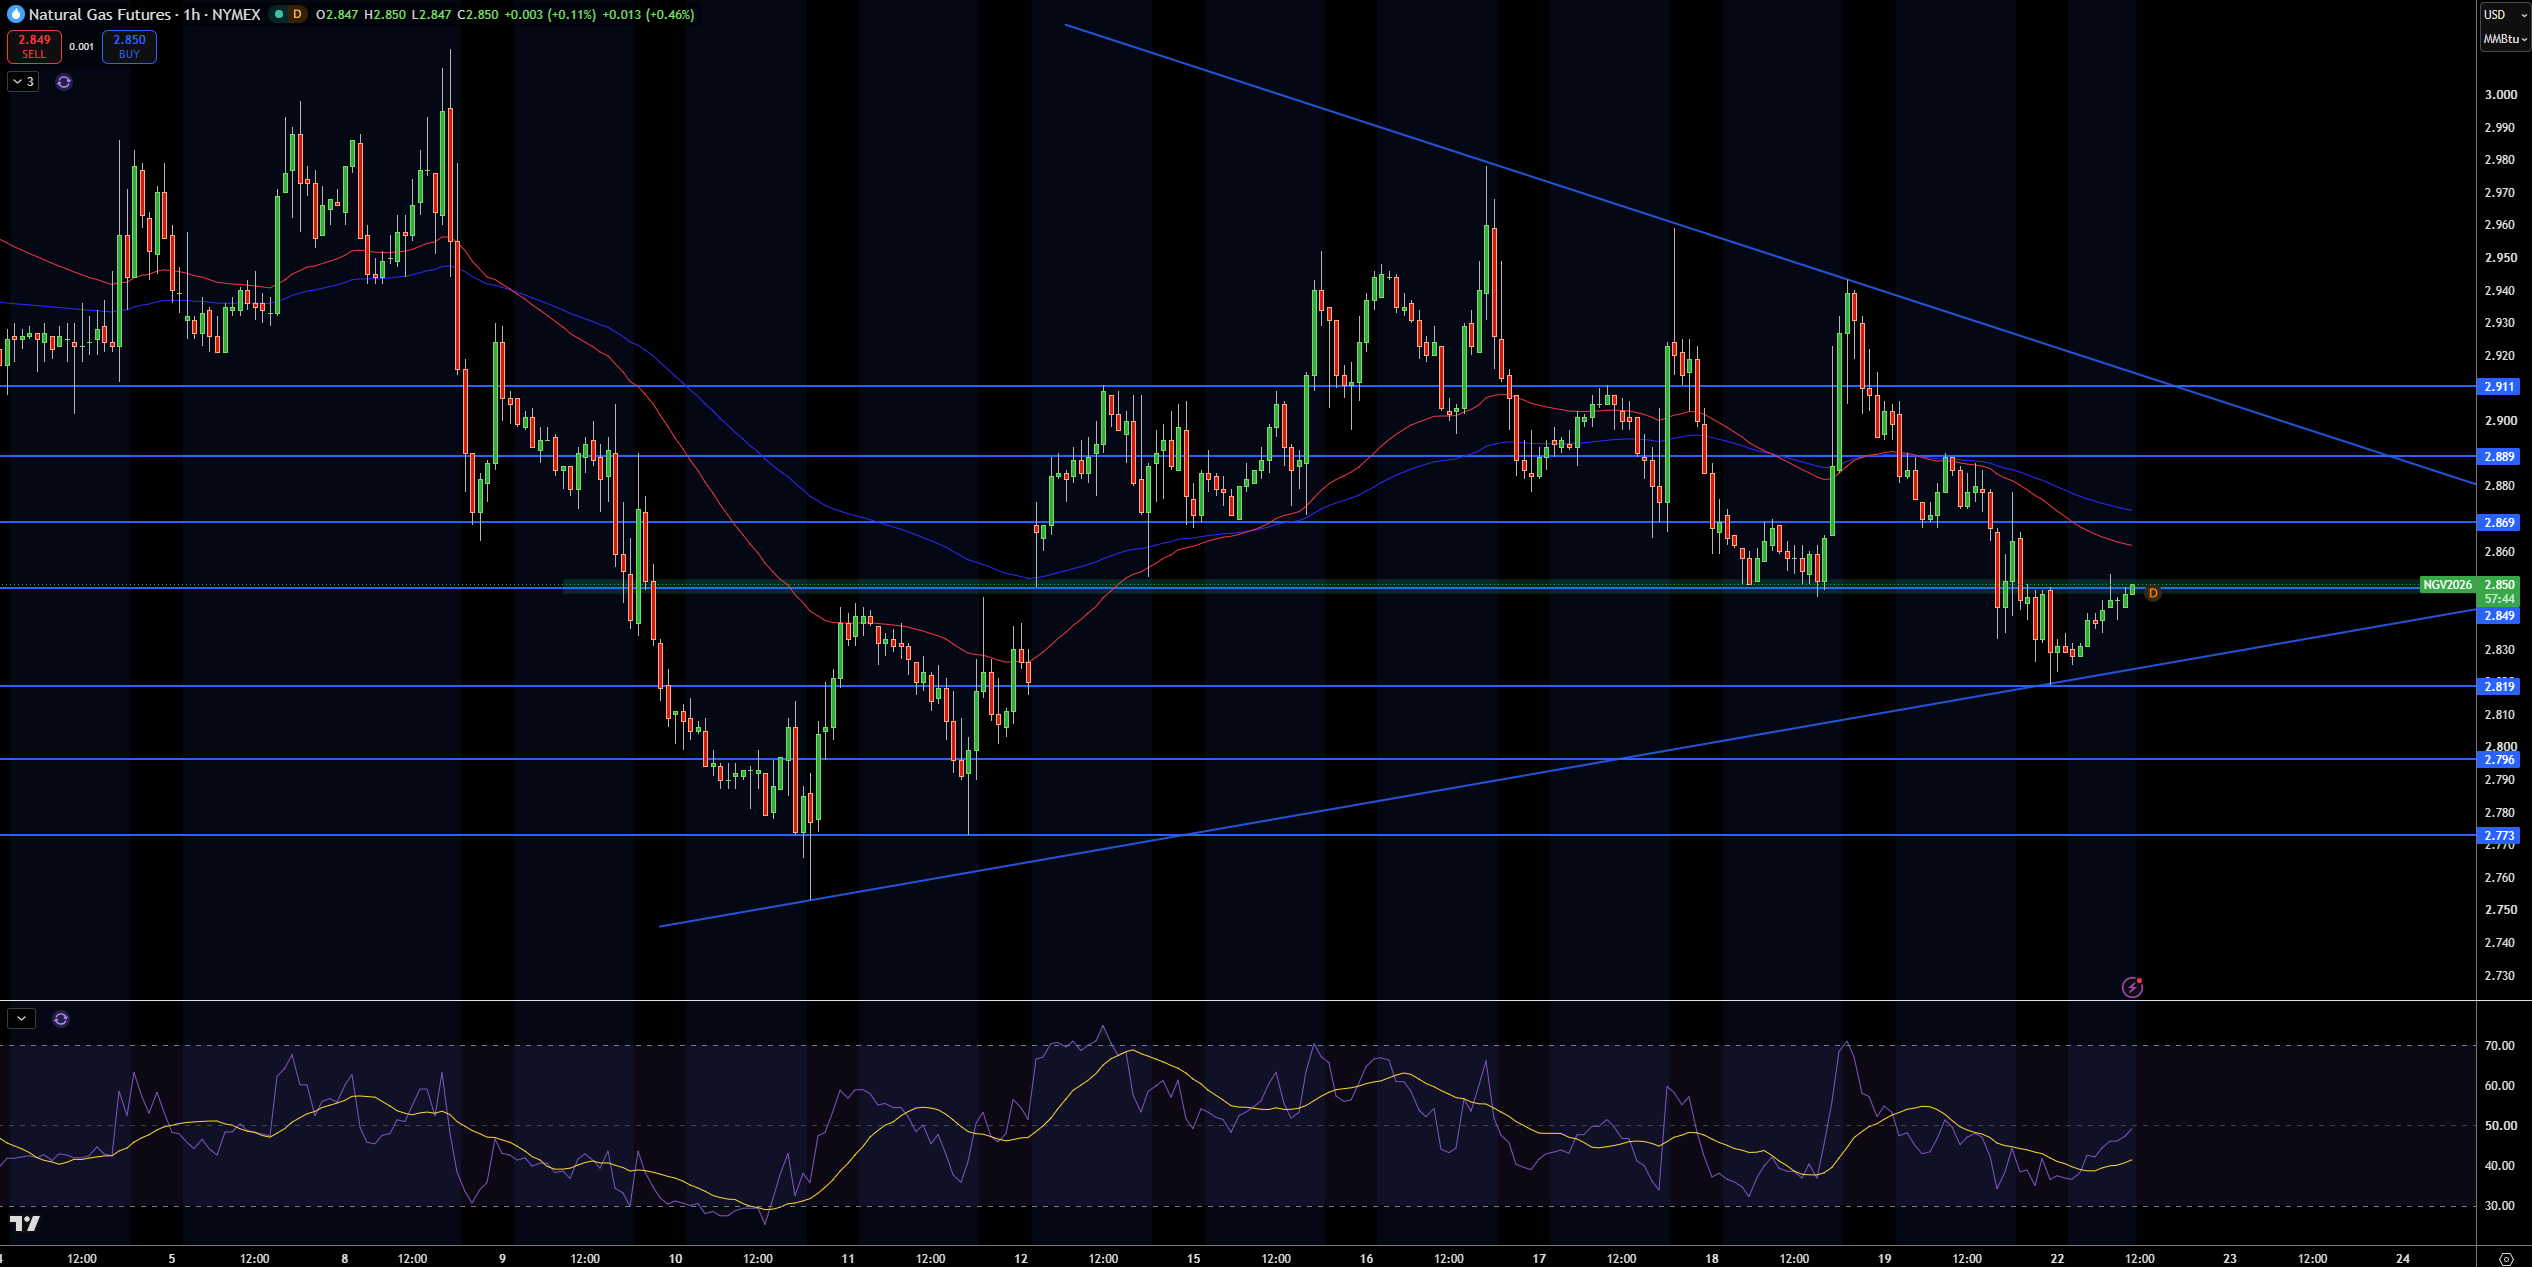
NG has been consolidating between the $2.82 and $2.85 area. Currently, it is at the $2.85 area. I would agree with the statement the market is in an “important decision zone” between the $2.85 area and a descending trendline. Furthermore, below that trendline is rising trendline support. I will not look for NG directional trades until I see a clear and convincing break of that trendline.
In the near term, I agree $2.89 will likely be resistance, and above that resistance, I agree $2.91 and $295 will likely cap NG. Looking at the other side of the trade, below the $2.85 area, $2.82 and $2.80 will likely provide temporary support and be followed by $2.77.
The RSI in the 4 hour chart is also between 50 and 60 so it is in a neutral zone. I agree NG is neutral between the $2.85 and $2.89 area. A clear and convincing move below $2.82 will put the $2.80 area and lower in focus and a clear move above $2.91 will bring the $3.00 area into focus.
Natural Gas Price Forecast
Every new Natural Gas analysis as it publishes, today's technical signal and key levels, live price — on one page.
See all Natural Gas forecastsWTI Crude Oil Technical Analysis: USOIL Rebounds From $91.37 as $94.75 Resistance Caps the Recovery
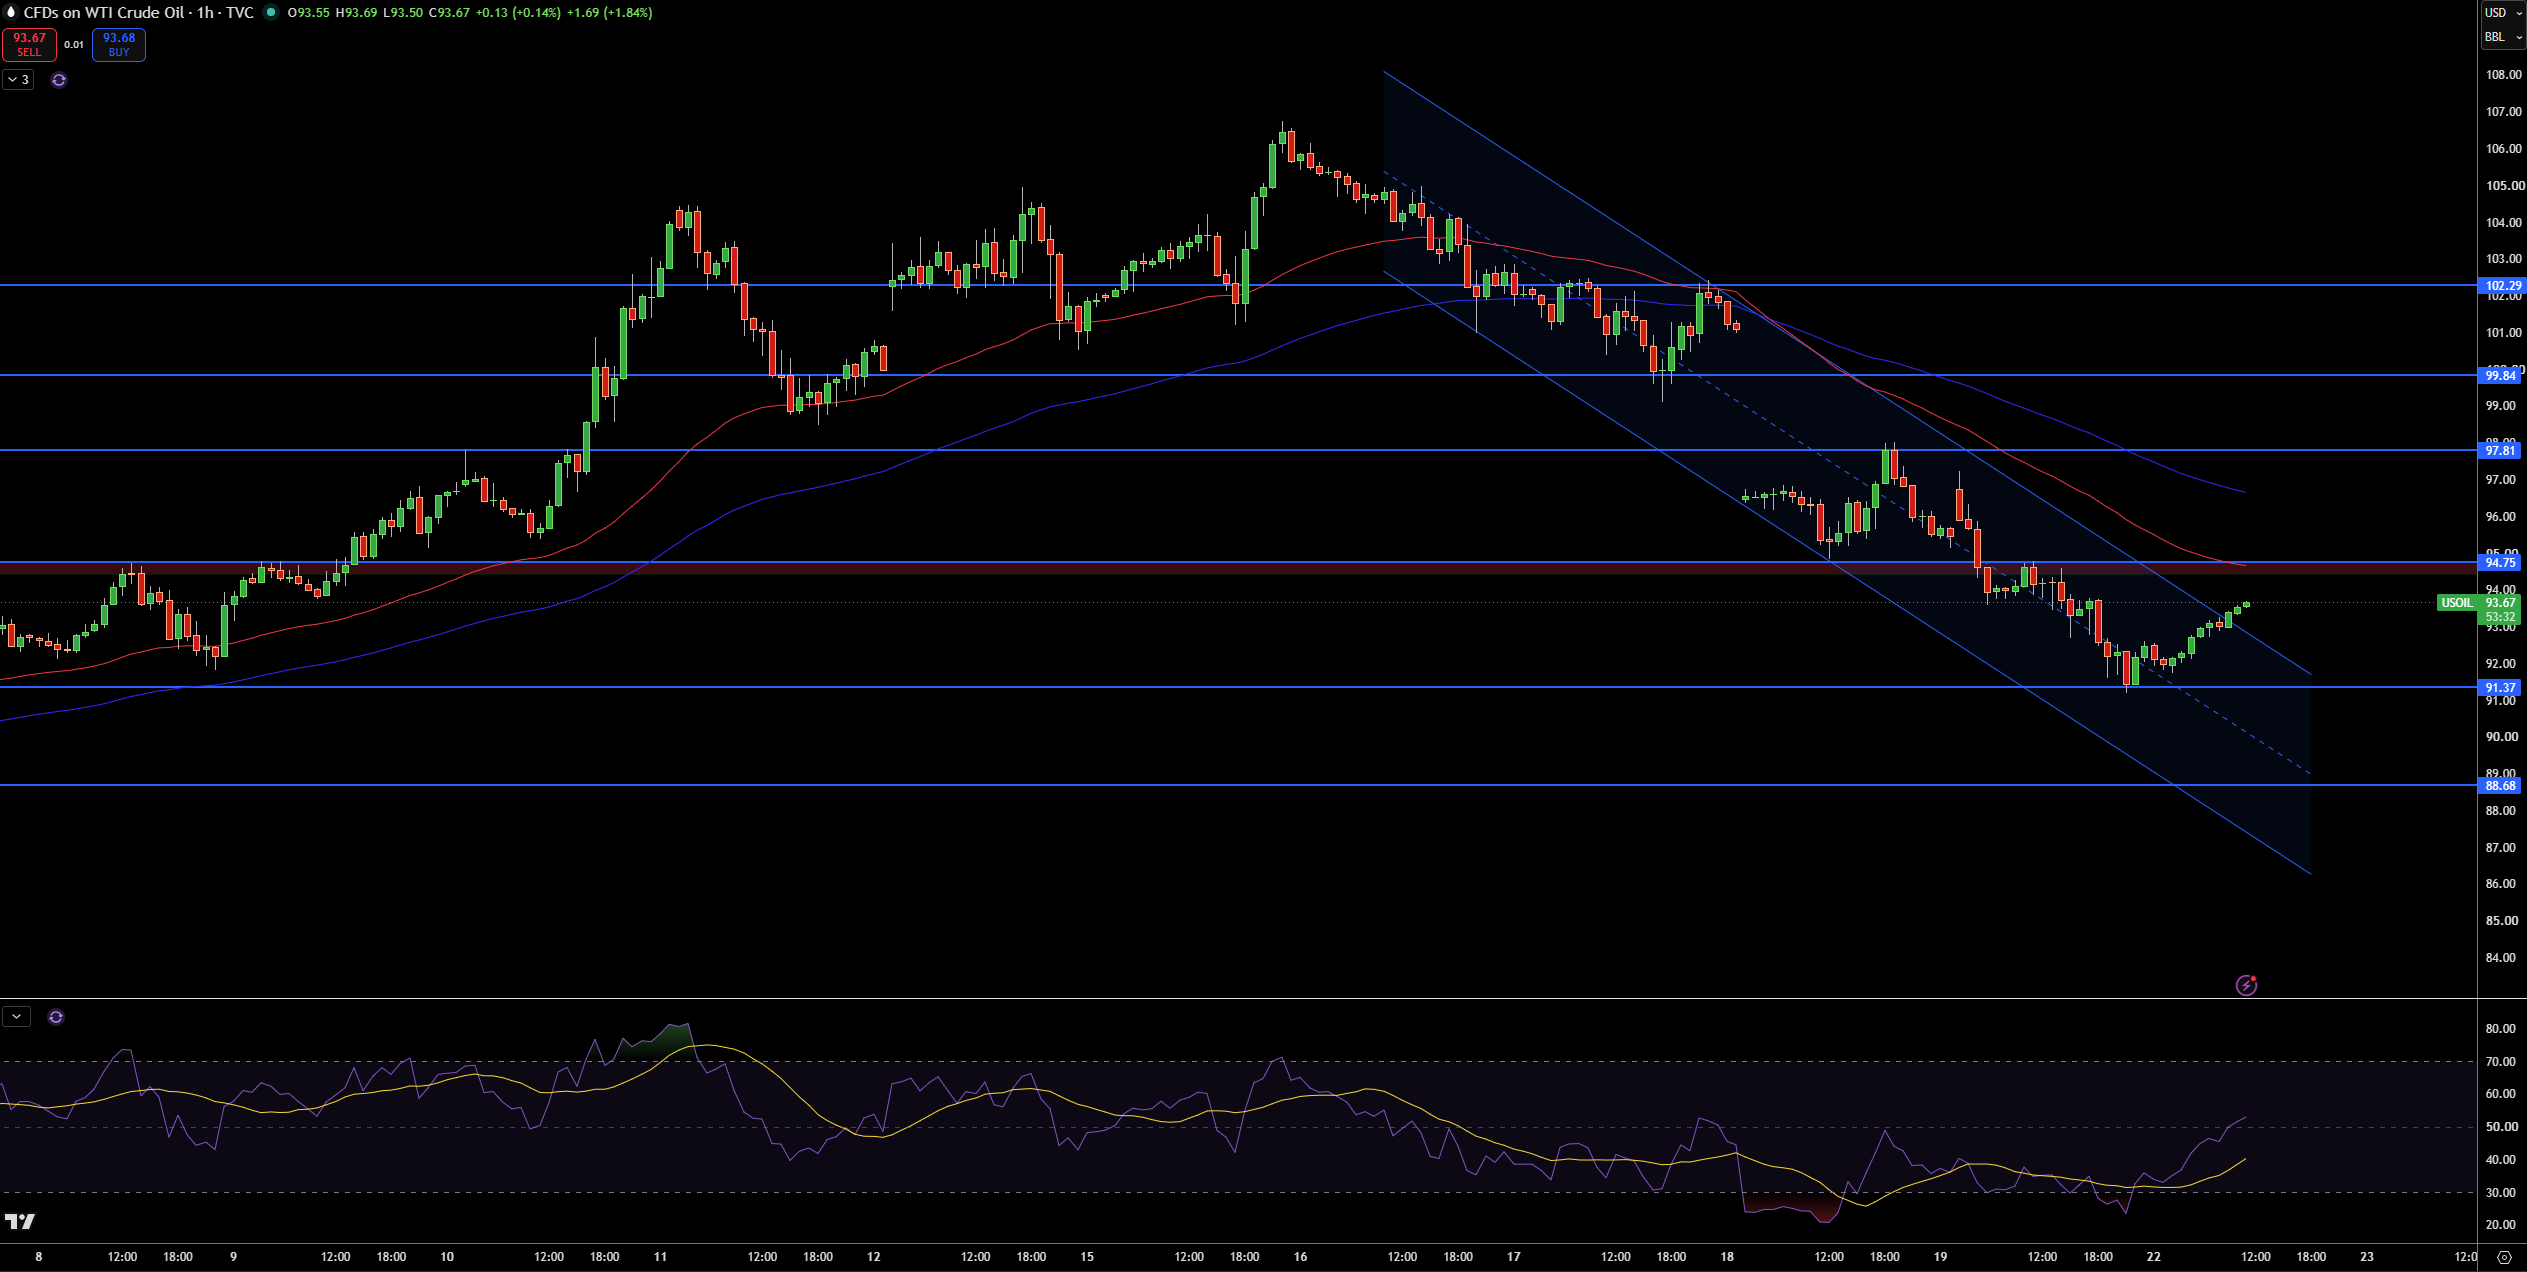
WTI Crude Oil is currently trading at $93.67 (as of the time of this analysis). Price bounced from $91.37. My bearish bias is somewhat validated as price is still trading below the 100 and 200 hour moving averages and is trapped in a bearish channel.
An upside price target of $94.75 is the first area of interest, above that price may test $97.81 and $99.84. The upside price target of $102.29 may extend beyond the channel.
$91.37 represents the initial support area. A further move lower may test the next support level of $88.68.
RSI has moved higher from the oversold condition, but is still below the 50 level, suggesting that the bearish condition remains. I will remain bearish as long as WTI trades below $94.75 and the bear channel. A move above $97.81 may bring a change in condition. A break below the channel, at $91.37 may bring further bearish condition and test $88.68.
Brent Crude Oil Technical Analysis: UKOIL Tests $102.79 Resistance as Descending Channel Remains Intact
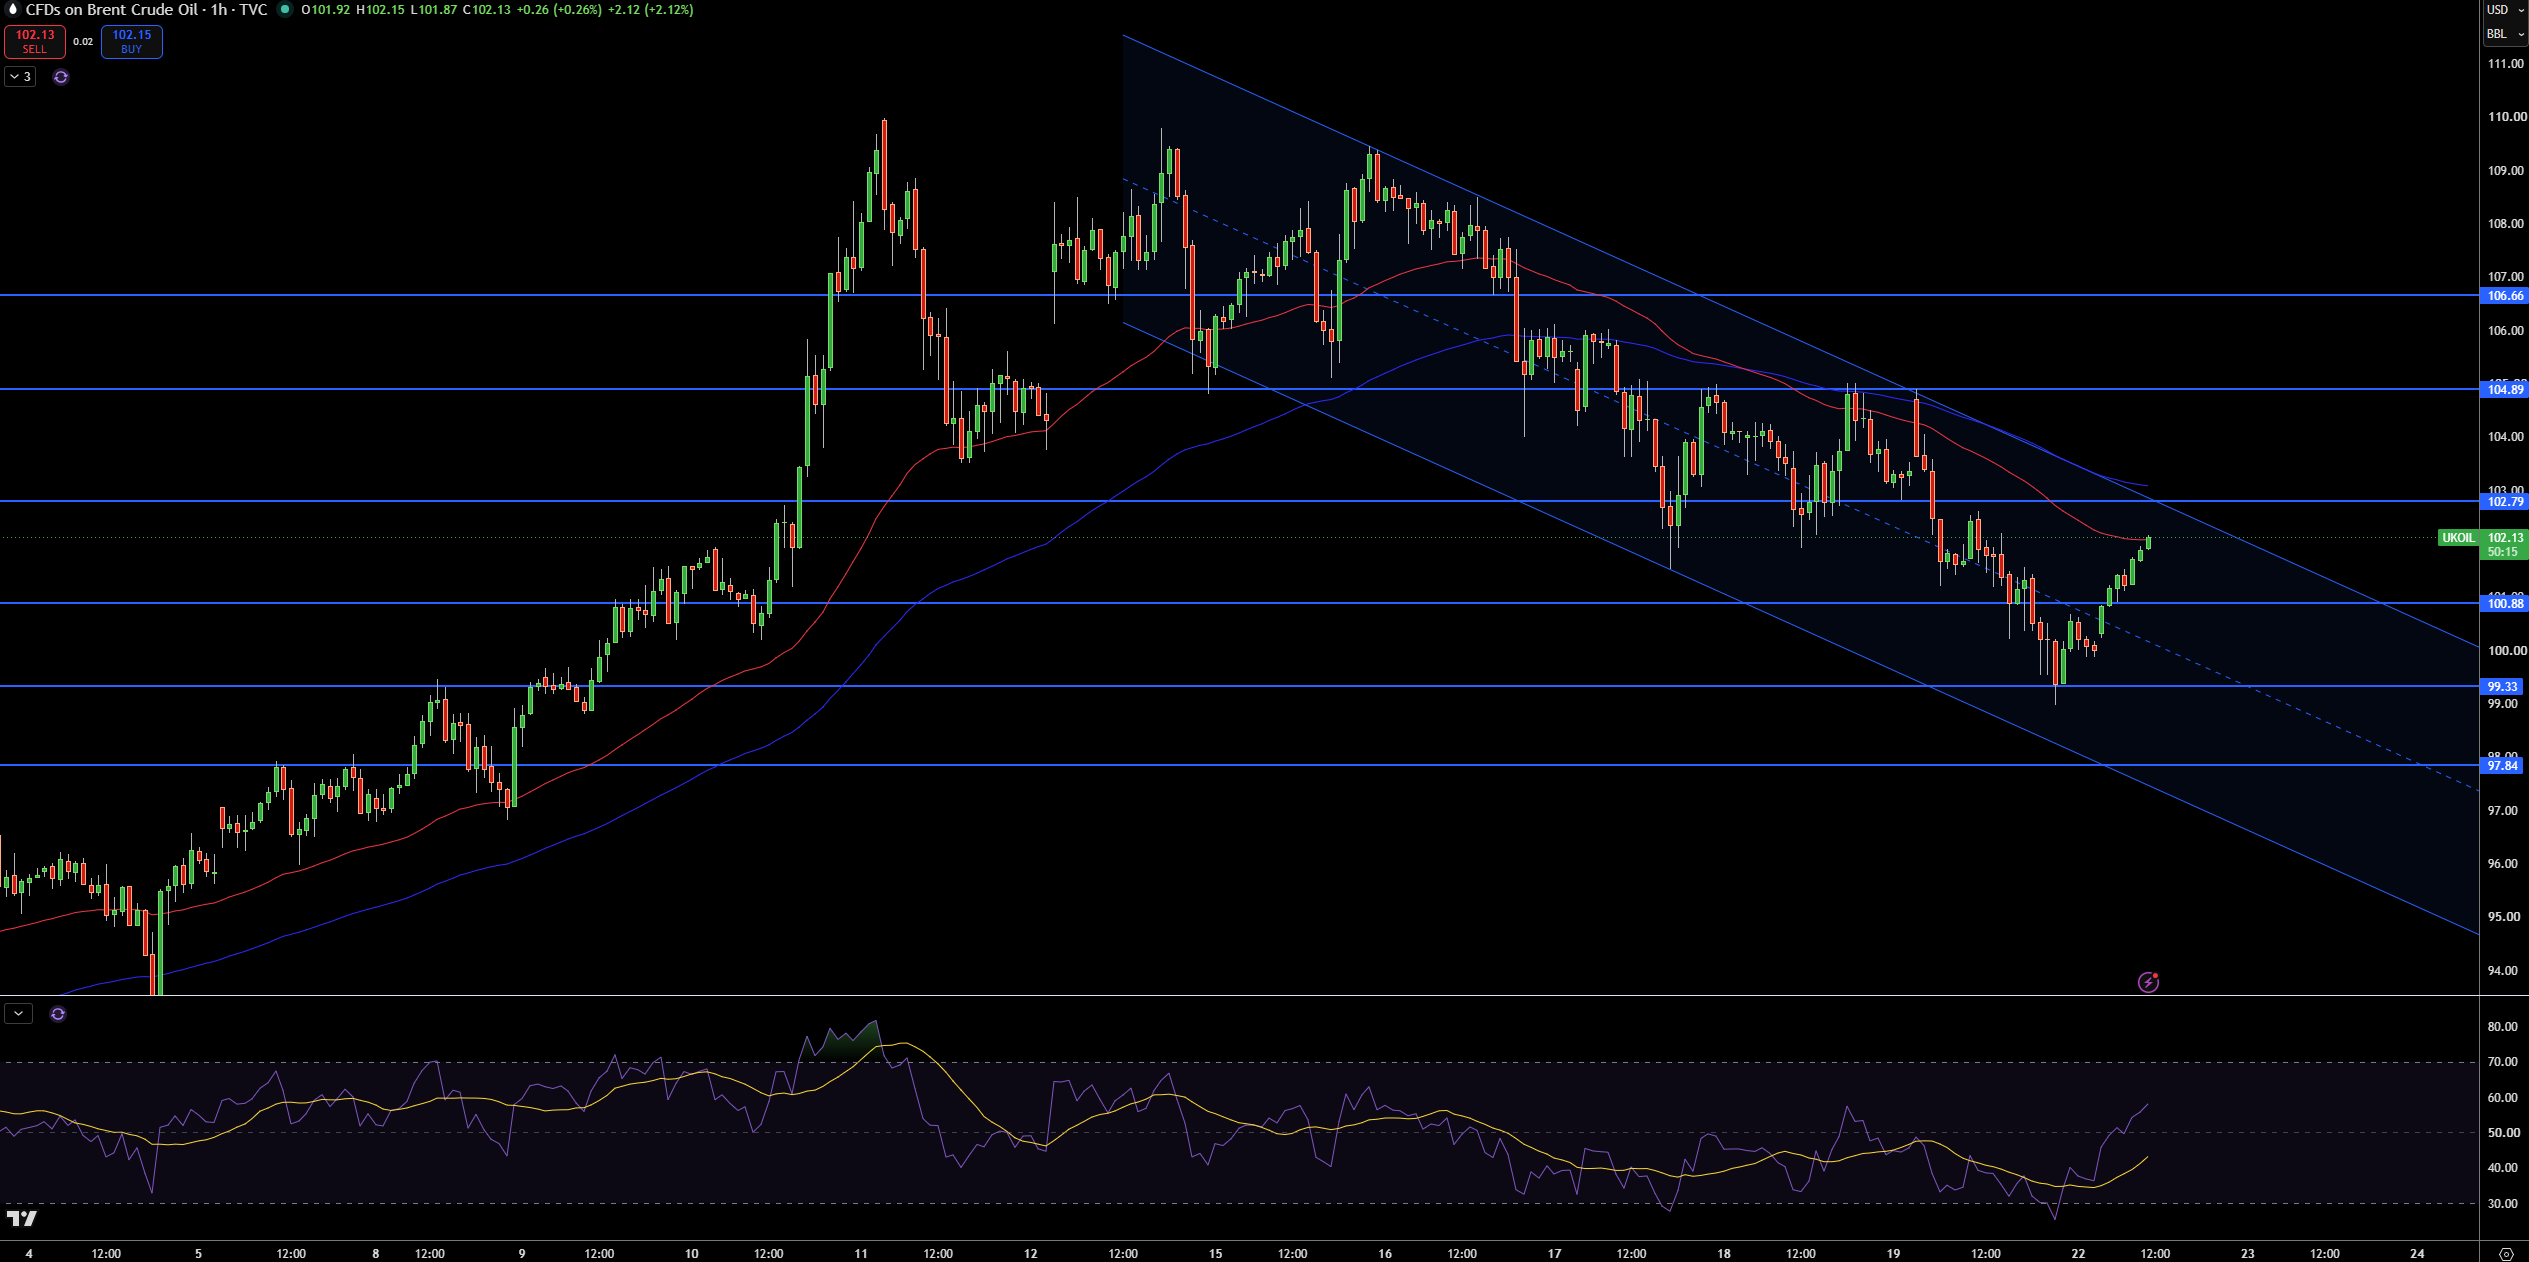
Brent Crude is currently trading at approximately $102.13. The price recently rebounded from the support level of $99.33. Currently, Brent is still trading beneath both the descending channel and both the moving averages. The recent move above $100.88 is bullish; however, the overall trend still remains bearish.
I am looking for Brent to encounter resistance at the $102.79 level. A move above that level would likely lead to a test of the $104.89 level. If $102.79 holds, look for support and possible lower levels to befound at $100.88 and $99.33. If the rebound fails, lower levels to look for are at $97.84.
The moving average convergence/divergence (MACD) is currently in a bearish condition. The overall trend is bearish and will likely remain so until Brent trades above the $102.79 level and the descending channel. I would look for a move above the $104.89 level to change the near-term trend to bullish. A move below $100.88 would bring the $99.33 level into play.