Bullish Breakout Takes Shape
Silver remains poised to continue its advance begun following the July corrective low of $54.78. Last week a higher swing low of $62.31 was established, while completing a 61.8% Fibonacci retracement of the prior advance and a successful test of support at the 50-day moving average. That average had previously marked dynamic resistance for the recent decline until it was reclaimed in early August. Subsequently, buyers took back control, driving a rally above the short-term downtrend line and 20-day moving average on Friday, and suggesting that the short-term pullback may be complete.
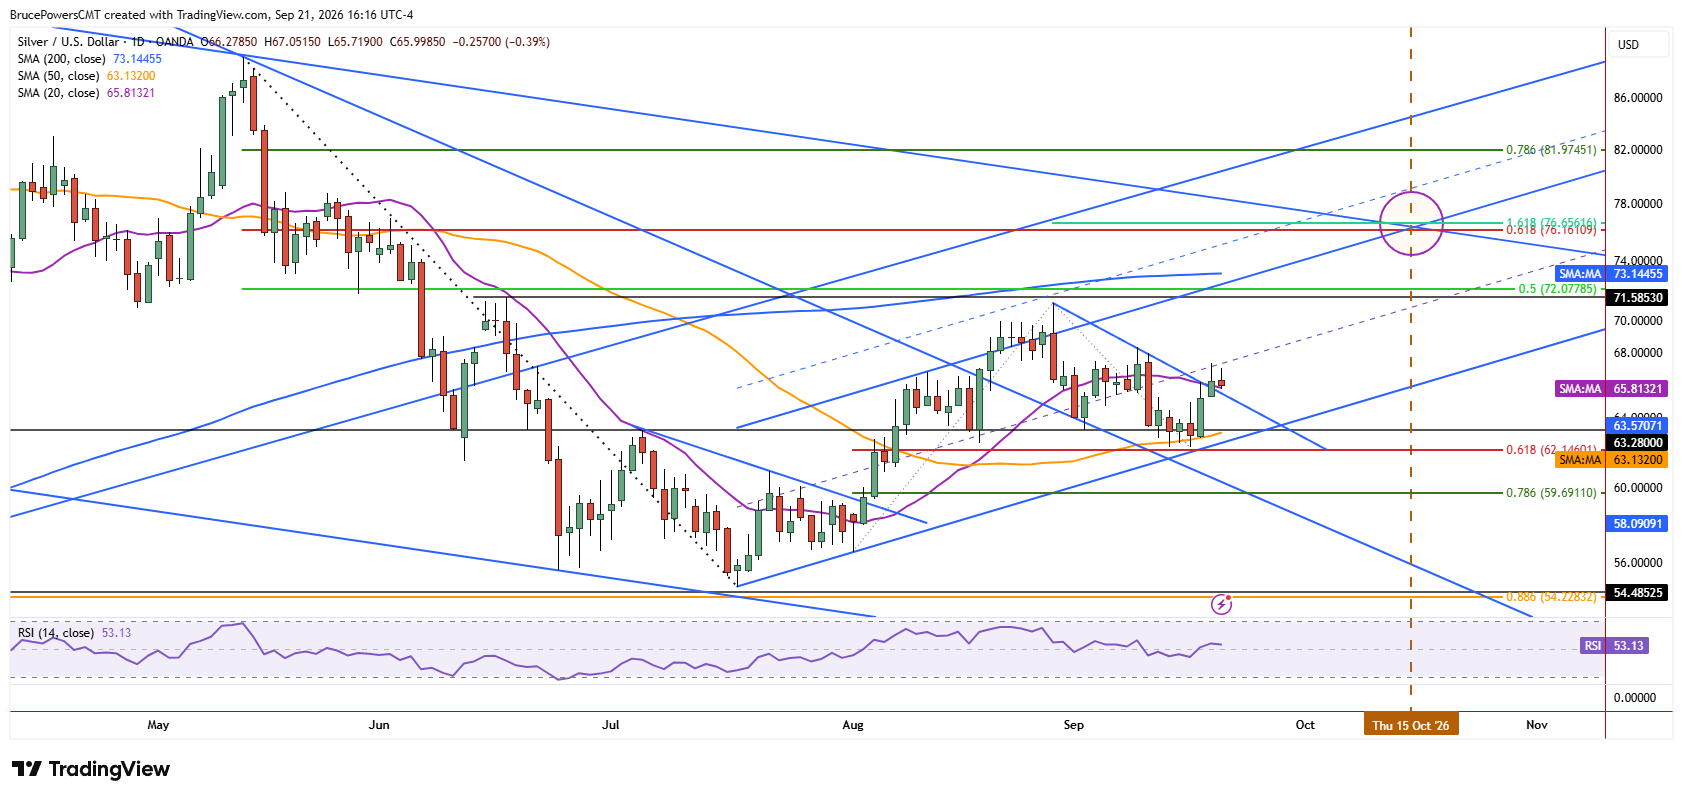
The bullish breakout occurred on Friday and was confirmed by a daily close above both trend indicators. Since they each identified a similar price resistance level once tested, the 20-day moving average near $65.81 can be used as a rough proxy for the trendline. Monday’s price action retained strength with silver consolidating in a relatively narrow range above the two trend indicators.

Friday Levels Hold the Key
A higher daily low of $65.72 and lower daily high of $67.05 were generated on Monday at the time of writing. Although the two levels show short-term support and resistance, respectively, Friday’s levels have greater significance. Resistance on Friday was at $67.34 and support at $65.26.
Friday’s bullish signal needs further confirmation of strength or is at risk of a failed breakout or consolidation. That is not what is currently anticipated, but if silver falls below and stays below Friday’s low it could take longer for bullish follow-through to occur with a move above $67.34.
Major Resistance Comes Into View
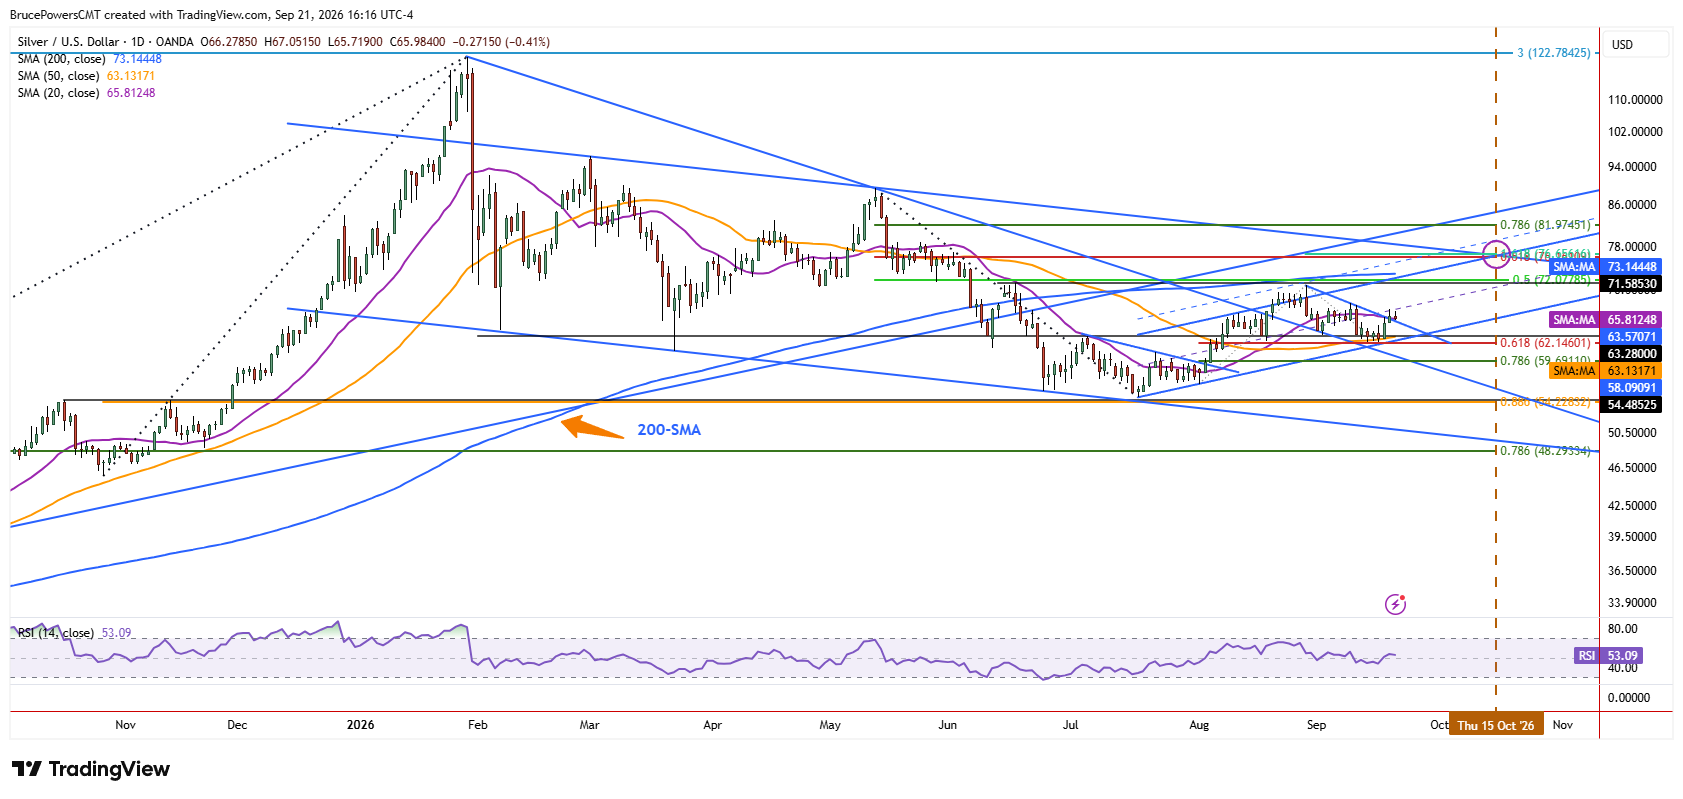
The key resistance challenge for silver is going to be the 200-day moving average, now near $73.14. Silver has traded below that average since June, after it had marked dynamic support for the uptrend since April 2025. And it was successfully tested as resistance during the recent advance that peaked at $71.18 in August. A rally above that August high will signal a continuation of the second bullish advance since the July low. This suggests that there is a good chance that the August high is exceeded on the way to the 200-day moving average, if key support at the 50-day moving average continues to hold.
If you’d like to know more about how to trade gold and silver, please visit our educational area.