Higher Low Sets Up New Advance
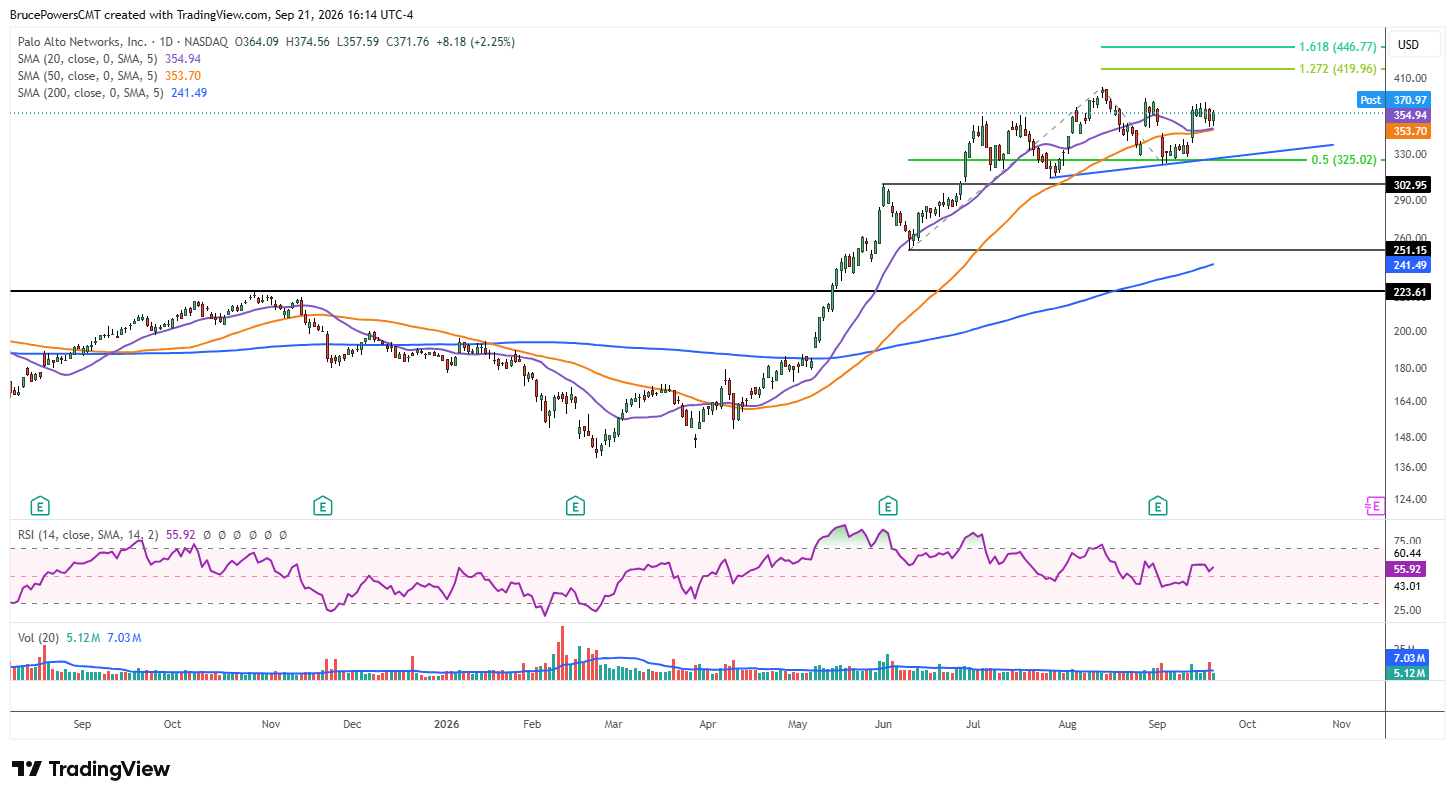
Palo Alto Networks, Inc. (PANW), a cyber security company, completed its most recent pullback in early September with a higher swing low of $321.39, following a 50% retracement of the prior advance. A six-day narrow consolidation range followed near the low and an upside breakout of that range was triggered last Monday with a sharp advance above the top of the range at $344.79. Strength was confirmed during the advance as both the 20-day and 50-day moving averages were reclaimed on the same move. The two averages had begun to converge on the breakout day and identified a similar potential price resistance zone.

Short-Term Support Holds the Setup
A five-day tight consolidation range followed the advance, including Monday’s price action, with a pullback to a low of $356 on Friday and a successful test of support at the confluence of the 20-day and 50-day moving averages. Together, $356 and the lower 50-day moving average near $353.70 define current short-term support.
If that range continues to hold, an upside breakout of consolidation, which is like a bullish flag, may trigger a second leg up from the September lows and provide a launchpad for a challenge of, and possibly a move above, the current peak of $398.88. A rally above the recent high of $383.12 would signal an upside breakout of short-term consolidation and a continuation of the rally that began last week.
Larger Pattern Leaves Room for a Pullback
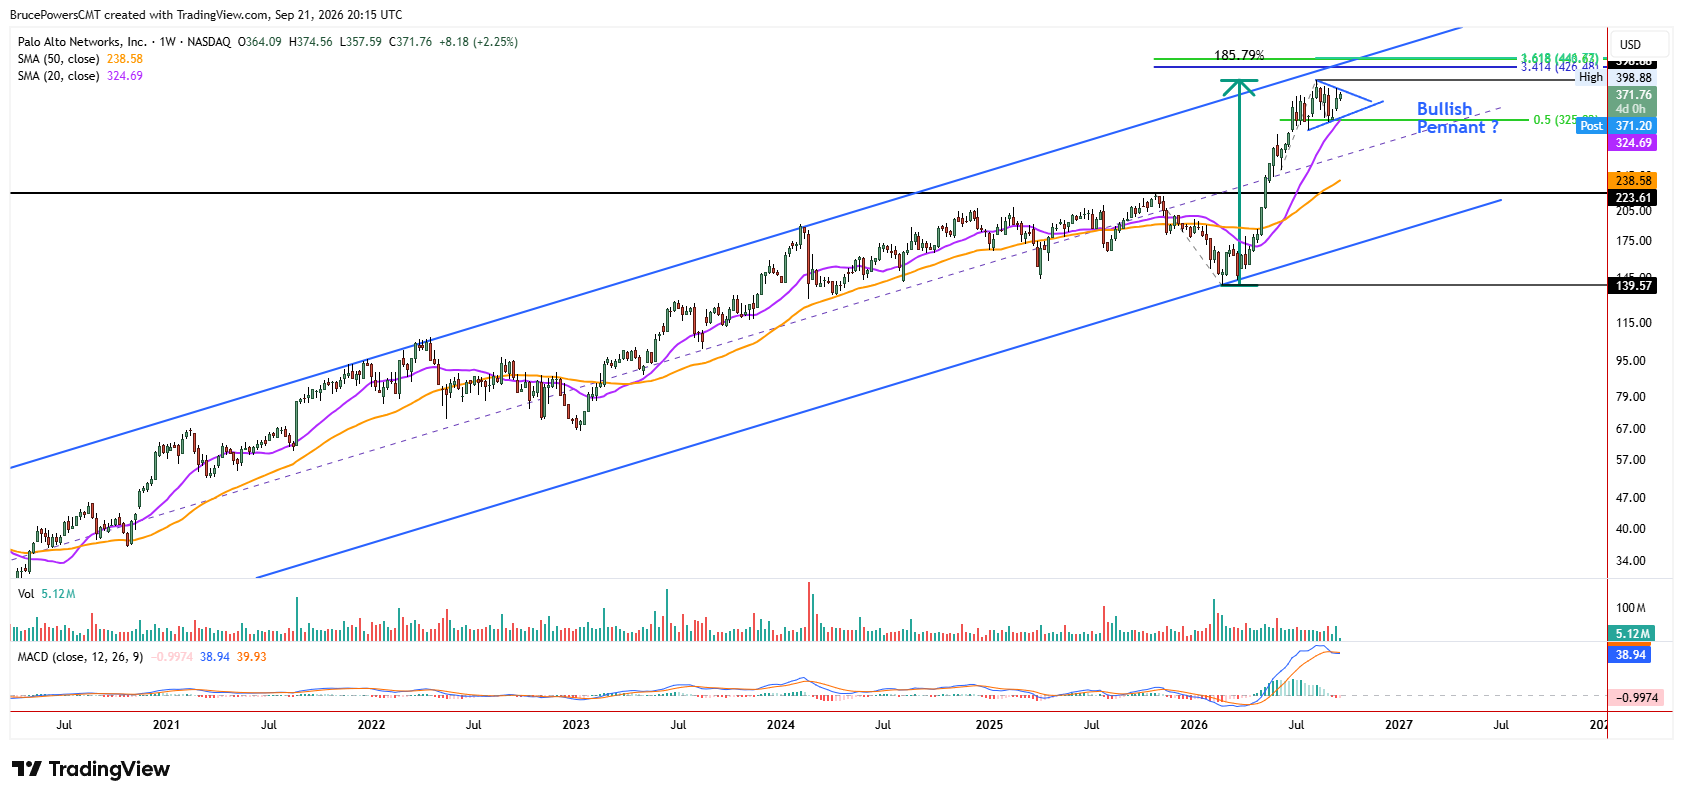
The risk is that PANW has been consolidating near highs with an upward bias since July and it may be difficult to decisively break out of that pattern. On the weekly chart, the consolidation phase has taken the form of a potential bullish pennant, near dynamic support from the rising 20-week moving average. From this view, another pullback could occur to test support near the lower boundary of the pattern. The rising 20-week moving average, near $324.69 currently provides a proxy for the lower boundary of the pennant.
$383.12 Defines Next Breakout
Nonetheless, a decisive advance above $383.12 would signal an upside breakout of daily consolidation, as well as a break above last week’s high. Concurrently, a breakout of the larger bullish pennant pattern would also be triggered, indicating a likely continuation of the larger bullish trend for PANW. Therefore, the near-term consolidation remains the key setup to watch, with $383.12 defining the upside trigger and the $353.70-$356 support zone helping determine whether bullish momentum remains intact.
If you’d like to know more about technical analysis and how traders use it, please visit our educational area.