Nasdaq Leads Risk Rally as Goolsbee Warns
The Nasdaq is running 1.95% Monday while the Dow is managing 0.60%. Technology, crypto, and Greenland-linked names are taking the money from the opening bell. Defensives are not. Chicago Fed President Austan Goolsbee said there was “no ambiguity” about the need for higher rates as inflation pressure spreads beyond tariffs and energy. The market heard the warning and is buying the most rate-sensitive part of the tape anyway.
At 17:00 GMT, the Dow Jones Industrial Average is up 310.49 points, or 0.60%, at 51,993.13. The S&P 500 is up 101.59 points, or 1.33%, to 7,752.09. The Nasdaq Composite is up 518.357 points, or 1.95%, to 27,040.903.

Daily Nasdaq Composite Technical Analysis
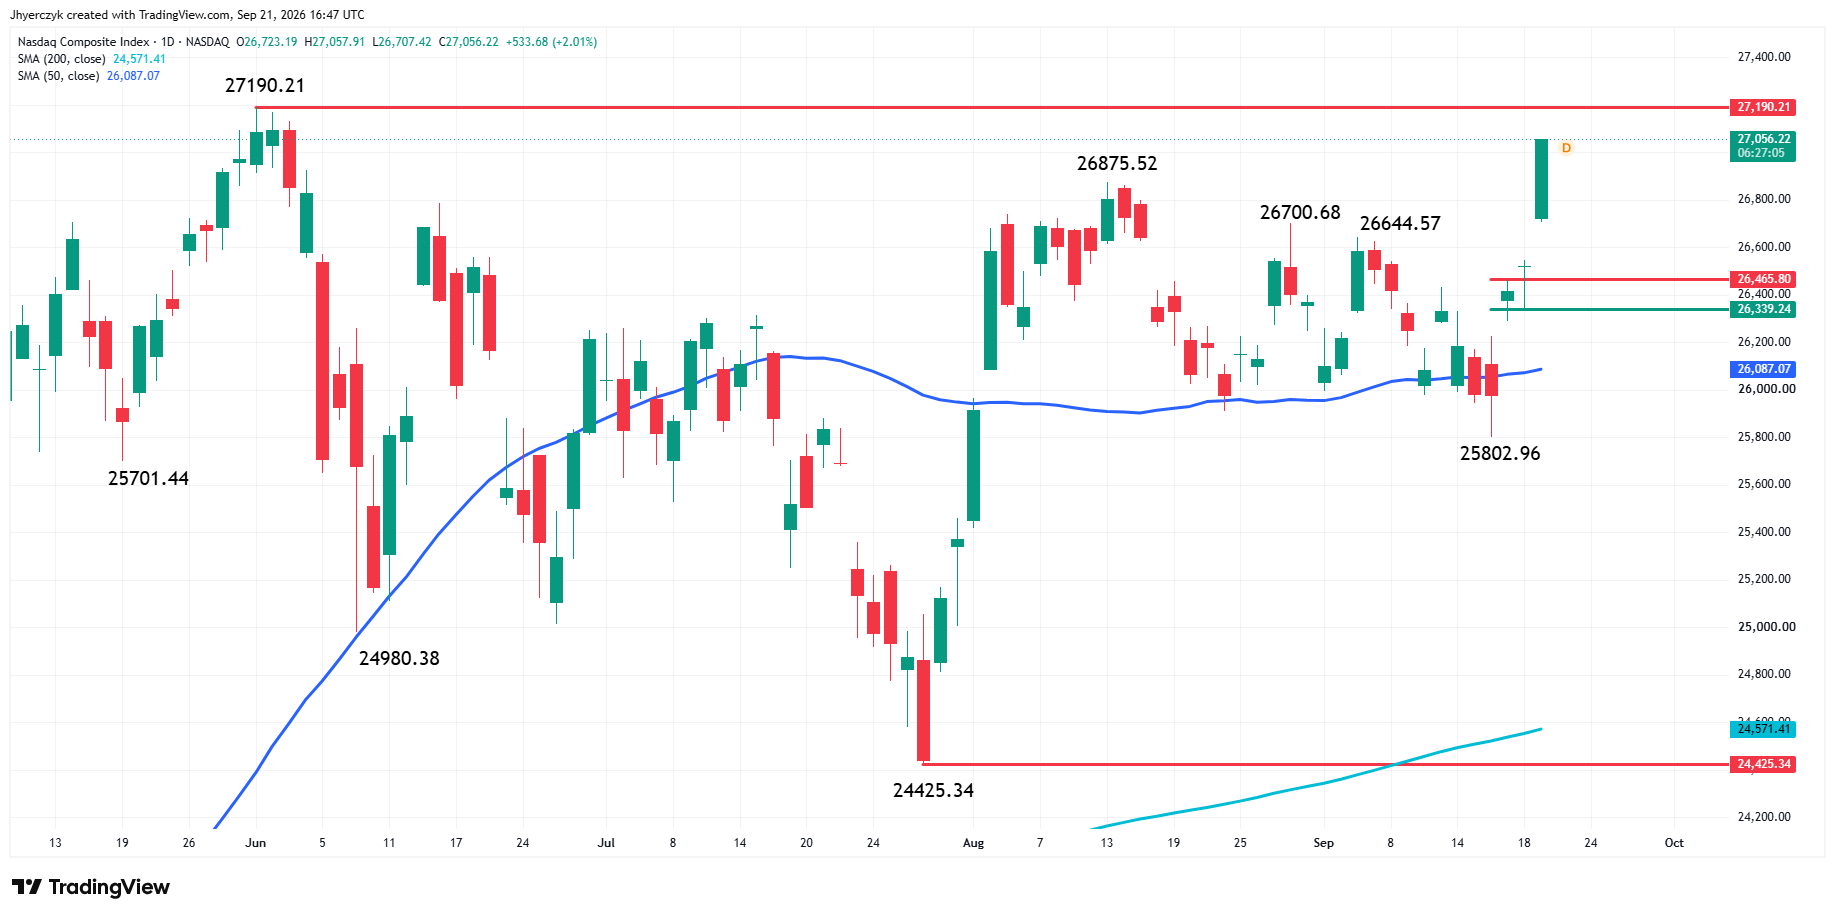
The Nasdaq Composite has cleared 26,465.80 and is pressing toward 27,190.21. The 50-day moving average at 26,087.07 sits below the market. A trade through 27,190.21 will change the main trend to up.
On the downside, 26,465.80 is the first level. The 50-day at 26,087.07 is below that.
Daily S&P 500 Technical Analysis
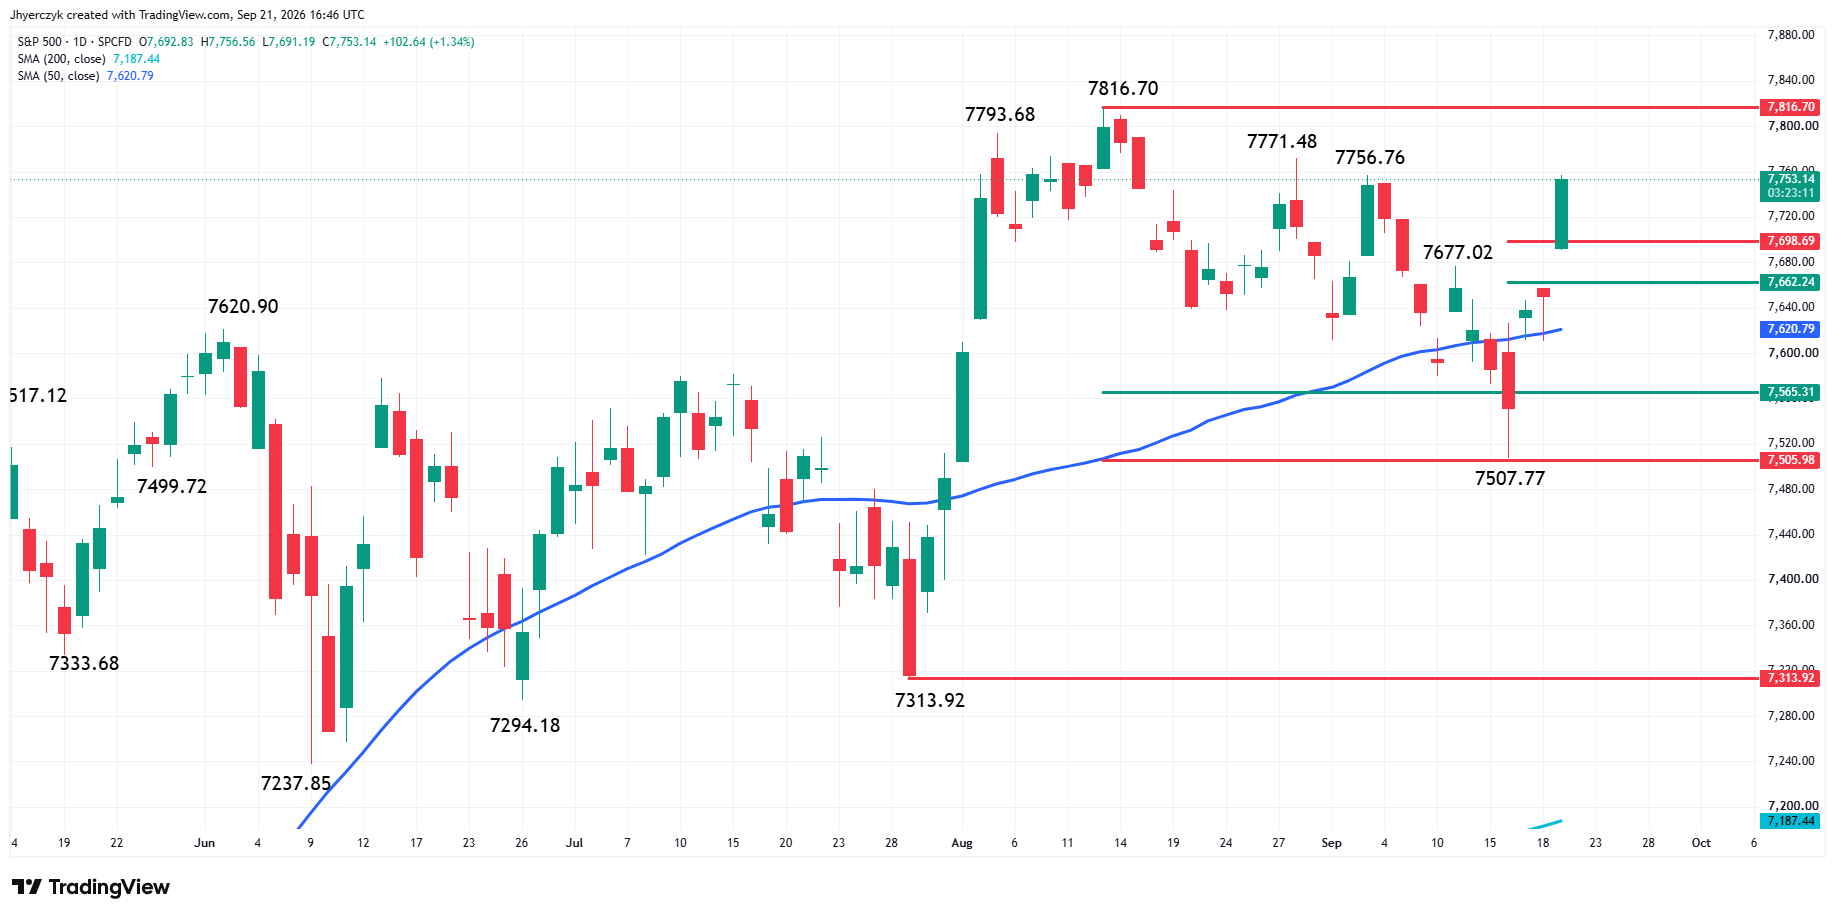
The S&P 500 is trading near 7,753 above the 50-day moving average at 7,620.79. Resistance is 7,756.76 and $7,816.70. Support is 7,698.69, 7,662.24, and the 50-day.
Daily Dow Jones Industrial Average Technical Analysis
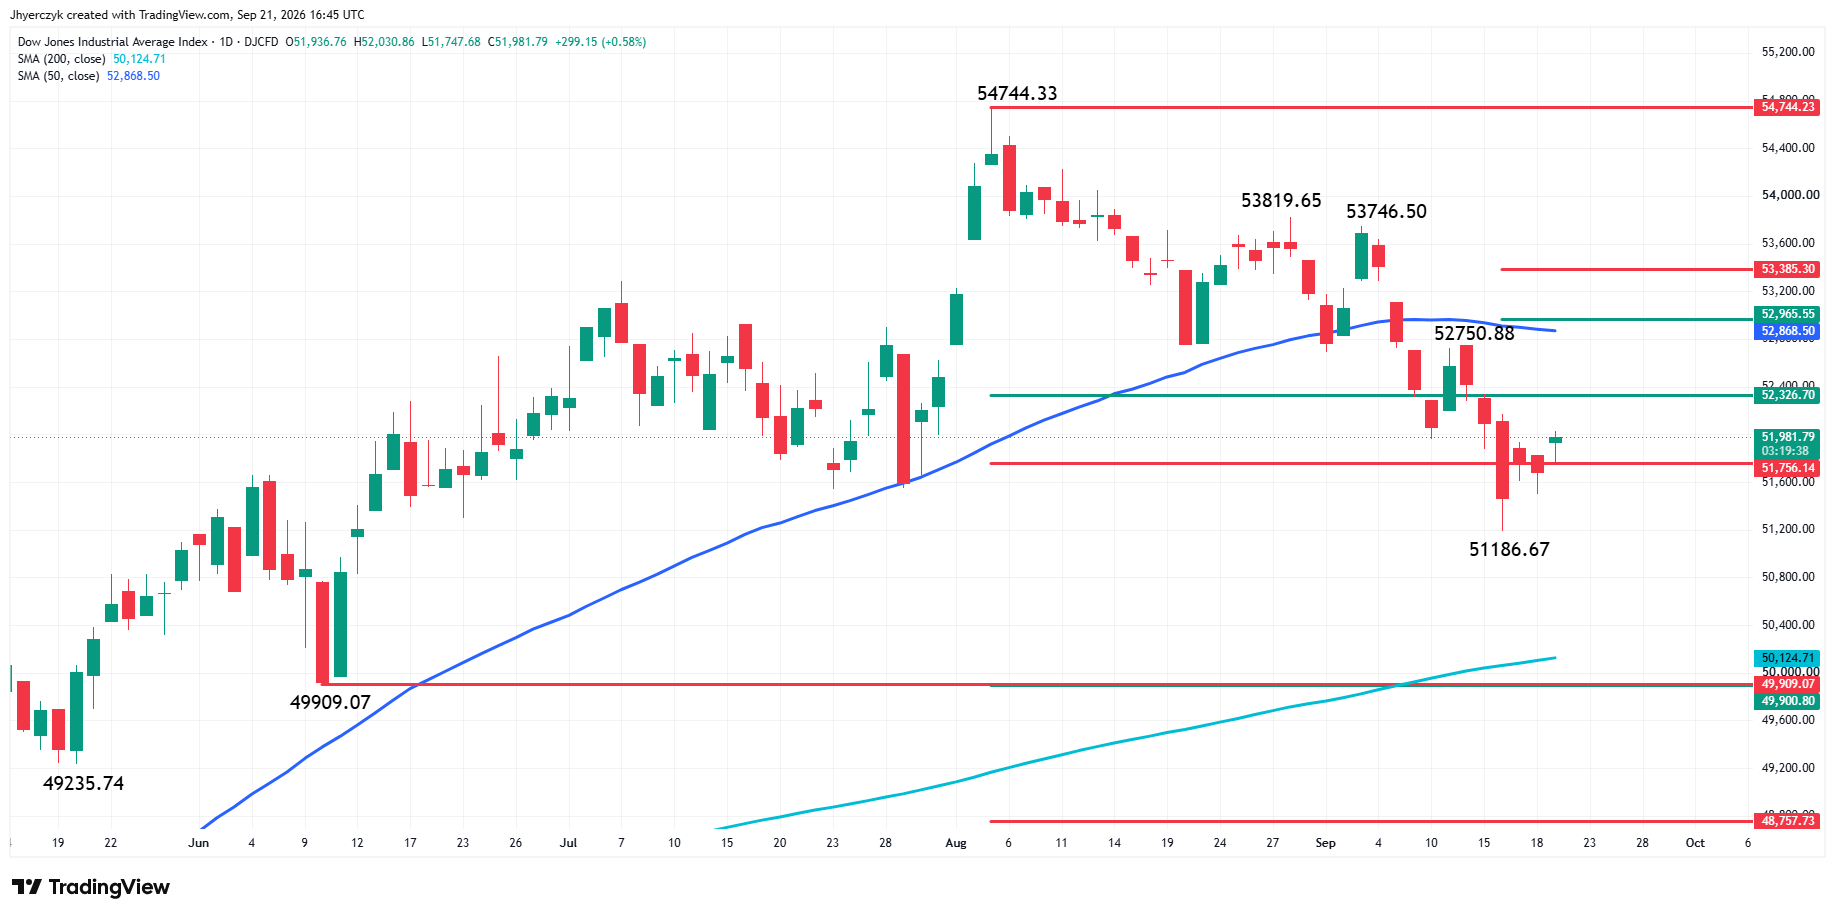
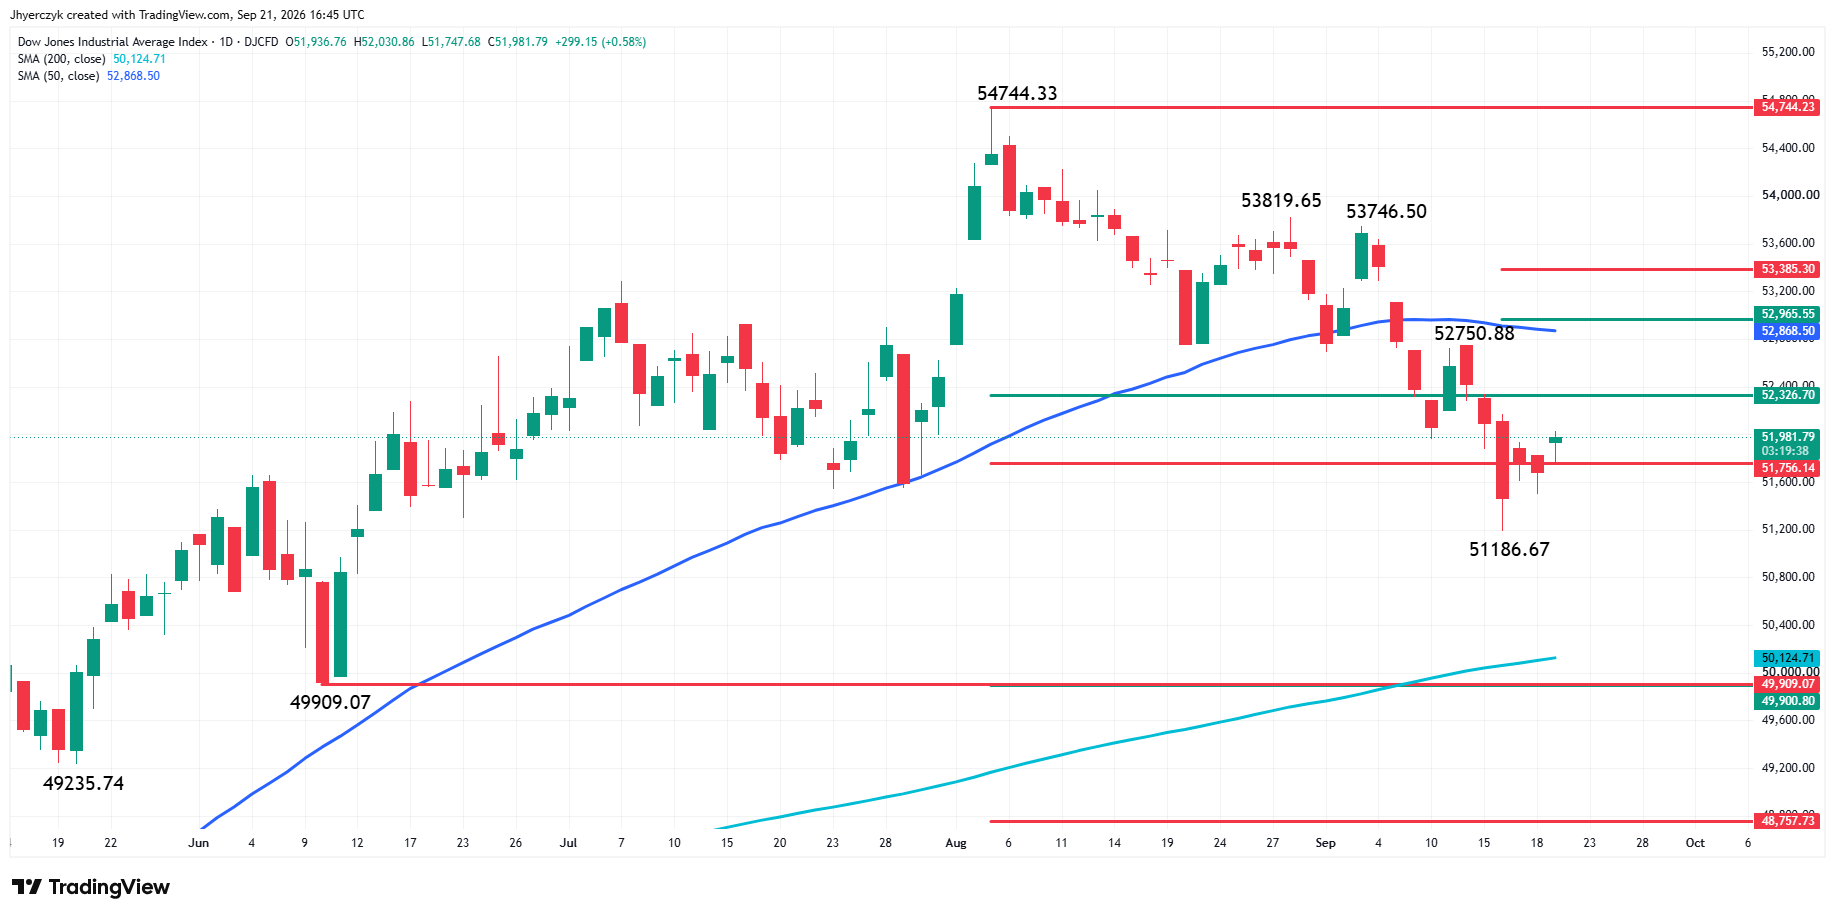
The Dow is bouncing from the 51,186.67 low. The 50-day moving average at 52,688.50 and resistance at 52,326.70 remain above the market. Above 52,688.50, the next level is 52,965.55. The breakdown started from 53,746.50.
Bitcoin Price Forecast
Every new Bitcoin analysis as it publishes, today's technical signal and key levels, live price — on one page.
See all Bitcoin forecastsGreenland and China Are Running the Tape
Weekend progress between the United States and Denmark over Greenland took one trade risk off the table. That is enough to get buyers in the door Monday morning. Critical Metals is up 35%. Greenland Mines and Greenland Energy have more than doubled. When names like those are leading the tape, the trade is not about fundamentals. It is about positioning.
Thursday’s China-U.S. summit is the larger event. The United States proposed six more months on the trade truce. China wants a longer agreement. The meeting could also touch on the Iran war and regulation around artificial intelligence. Friday priced fear about all of it. Monday is pricing the chance that the next headline is less hostile. Too many moving parts to call the trade risk resolved. One hostile remark from either side ahead of the summit and Monday’s bid gets tested fast.
Goolsbee Warned on Rates and the Market Keeps Buying
Goolsbee was direct. Inflation is not just oil and tariffs anymore. Strong demand is adding to it. The case for the Fed to look through higher energy costs and stop tightening is not holding together the way the doves need it to. Policymakers still project at least one more increase this year.
Stocks are rallying through the speech. That tells you what Monday is about. Traders are not buying an easier Fed. They are buying the possibility that trade and geopolitical pressure ease enough to keep risk assets working for a few more sessions. Goolsbee’s message sits in the background until yields start moving on it. Monday they are not. If they do later this week, the Nasdaq names leading Monday are the first ones that give it back.
Stocks in the News
Bitcoin is up 6.3% to a seven-month high, sending Coinbase up 5.8% and Strategy up 8%. Paramount Skydance is up 8.5% after reaching a settlement with California and 11 other states on the Warner Bros. Discovery merger challenge. Communication services is leading S&P 500 sectors with a 2.9% gain. Energy is the weakest sector on the day.
More Stocks Are Hitting New Lows Than Highs on a Green Day
Seven of 11 S&P 500 sectors are higher. Advancing issues lead declining issues 1.82-to-1 on the NYSE and 1.88-to-1 on the Nasdaq. On the surface that is a constructive session. The new-high and new-low data tells a different story. The S&P 500 has posted 4 new 52-week highs against 27 new lows. The Nasdaq has recorded 41 new highs and 89 new lows. The indices are rallying hard. The average stock is not keeping pace. The Nasdaq is carrying the session and the breadth data confirms it.
What to Watch
Thursday’s China-U.S. summit decides whether Monday’s bid survives the week. An extension of the truce keeps the diplomacy trade alive. A breakdown in talks puts the Nasdaq at risk before anything else. Goolsbee did not soften the rate message. Yields are quiet Monday. If they turn higher alongside a firmer dollar before Thursday, the rate story takes the tape back from the trade story.
The Nasdaq has cleared 26,465.80 and is pressing toward the 27,190.21 main top. That is where the trend changes. Sellers have to push the index back below 26,465.80 to call Monday a failure. The 50-day at 26,087.07 is the floor.
The S&P 500 is running into resistance at 7,756.76. Sellers are sitting there and at 7,816.70 above it. 7,698.69 and the 50-day at 7,620.79 are the supports buyers need to hold.
The Dow is the weakest chart. Still below the 50-day at 52,688.50 and resistance at 52,326.70. The bounce from 51,186.67 is holding. The chart does not improve until the Dow clears the 50-day. The Nasdaq is carrying the market and the Dow has not confirmed the move.
More Information in our Economic Calendar.