NASDAQ 100 Technical Analysis
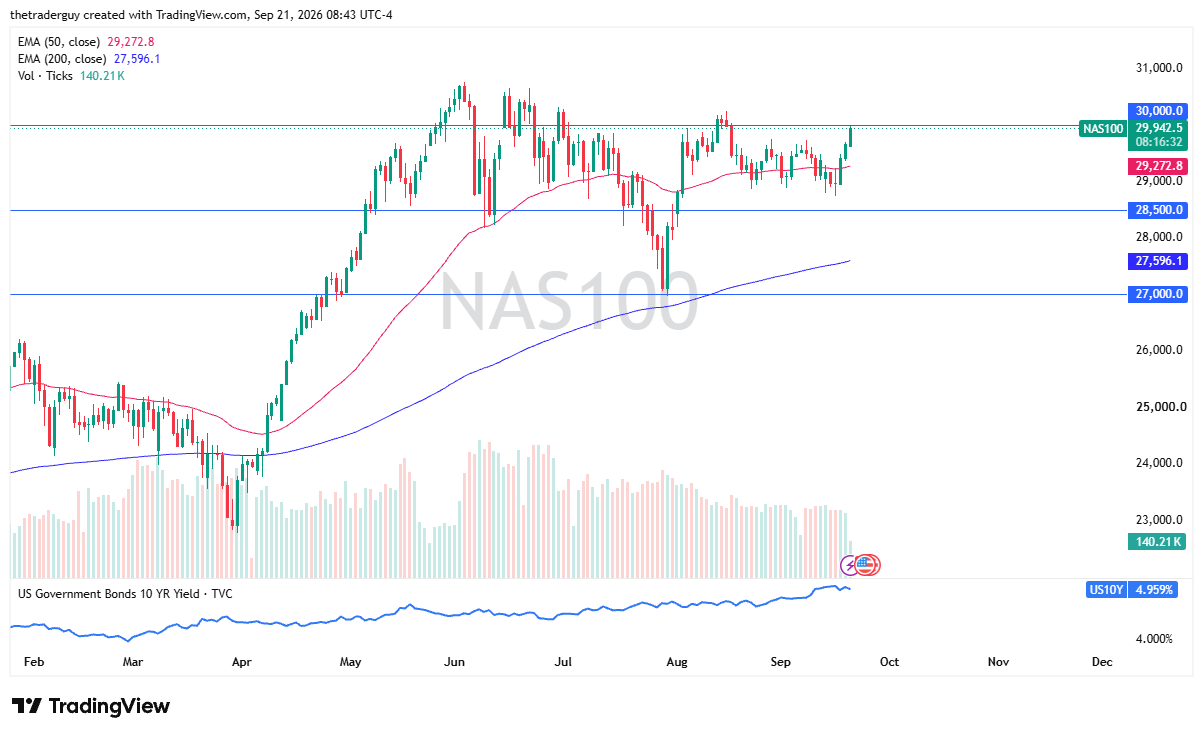
The Nasdaq 100 looks pretty positive here early on Monday morning, as we are threatening the 30,000 level almost immediately. With this being the case, it looks like the buyers are back. The fear is starting to subside a bit, and it is probably worth noting that here in the last few minutes, we have seen the 10-year yield roll over pretty significantly.
So, I think one of the headlines out there is that Trump is always open to talking, and Iran has to come to the table. It at least opens up the possibility of peace. That obviously would be a huge bonus for everybody involved.

Dow Jones 30 Technical Analysis
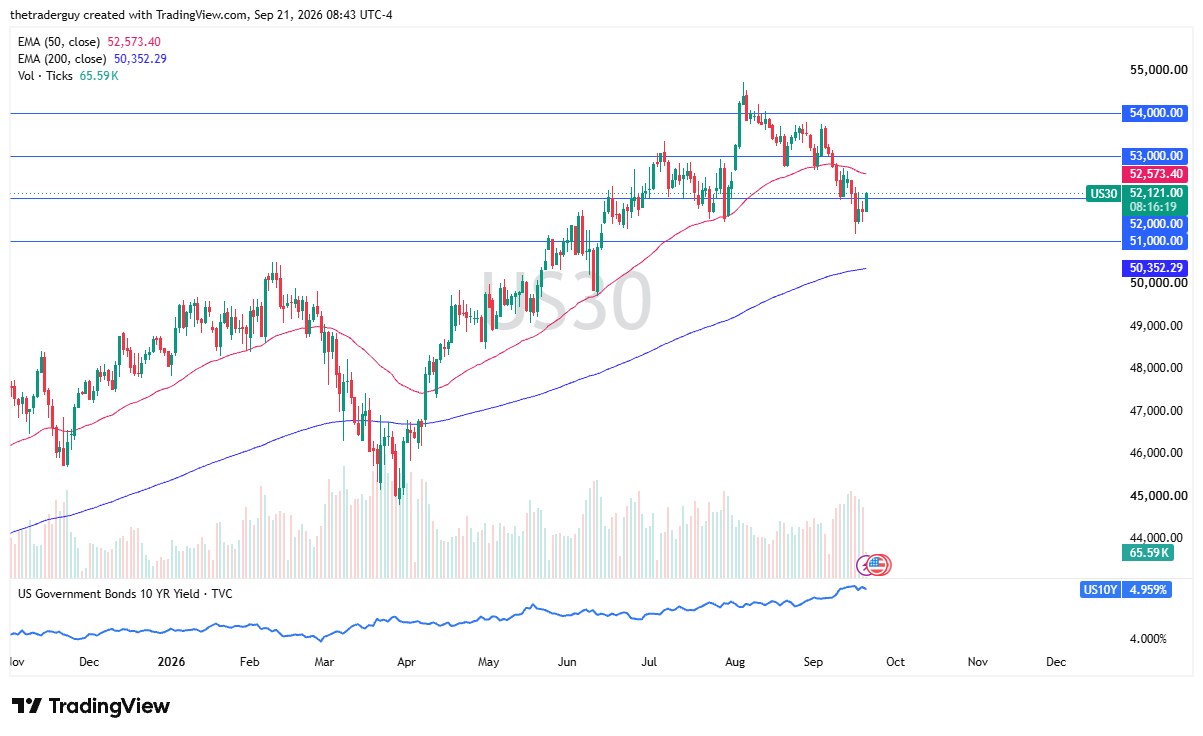
The Dow Jones 30 has risen quite nicely as well. It looks a lot like a market that is trying to break free again. The 50-day EMA could cause a little bit of a headache for buyers as potential resistance, but ultimately, this is a market that is in a longer-term uptrend. We have had a nice little pullback here. Maybe we are trying to turn to a new leg higher.
It is a little early to say that, but if we can get some relief in those interest rates, it certainly would not be a bad thought.
S&P 500 Technical Analysis
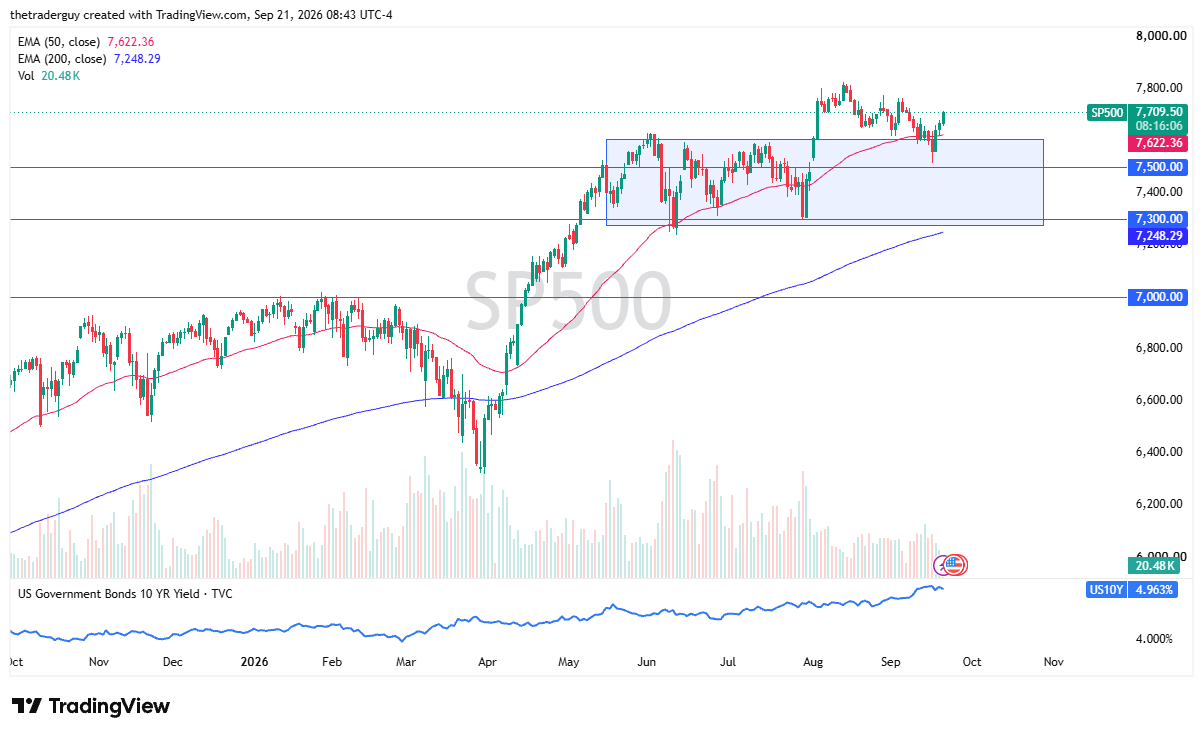
The S&P 500 finds itself rallying as well. This is a market that is now breaking 7,700. That is a big victory, and overall, this does look like a market that is trying to get to the 7,800 level before it is all said and done.
The 7,600 level was support. It did get violated, and we drove all the way down to 7,520 or so. We have had a nice bounce since then. We are back above the 50-day EMA. One would think that is a good sign.
S&P 500 Price Forecast
Every new S&P 500 analysis as it publishes, today's technical signal and key levels, live price — on one page.
See all S&P 500 forecastsWe are in an uptrend. That has not changed, so it looks pretty positive so far here on Monday.
If you’d like to know more about technical analysis and how traders use it, please visit our educational area.