Short-Term Selling Pressure Builds
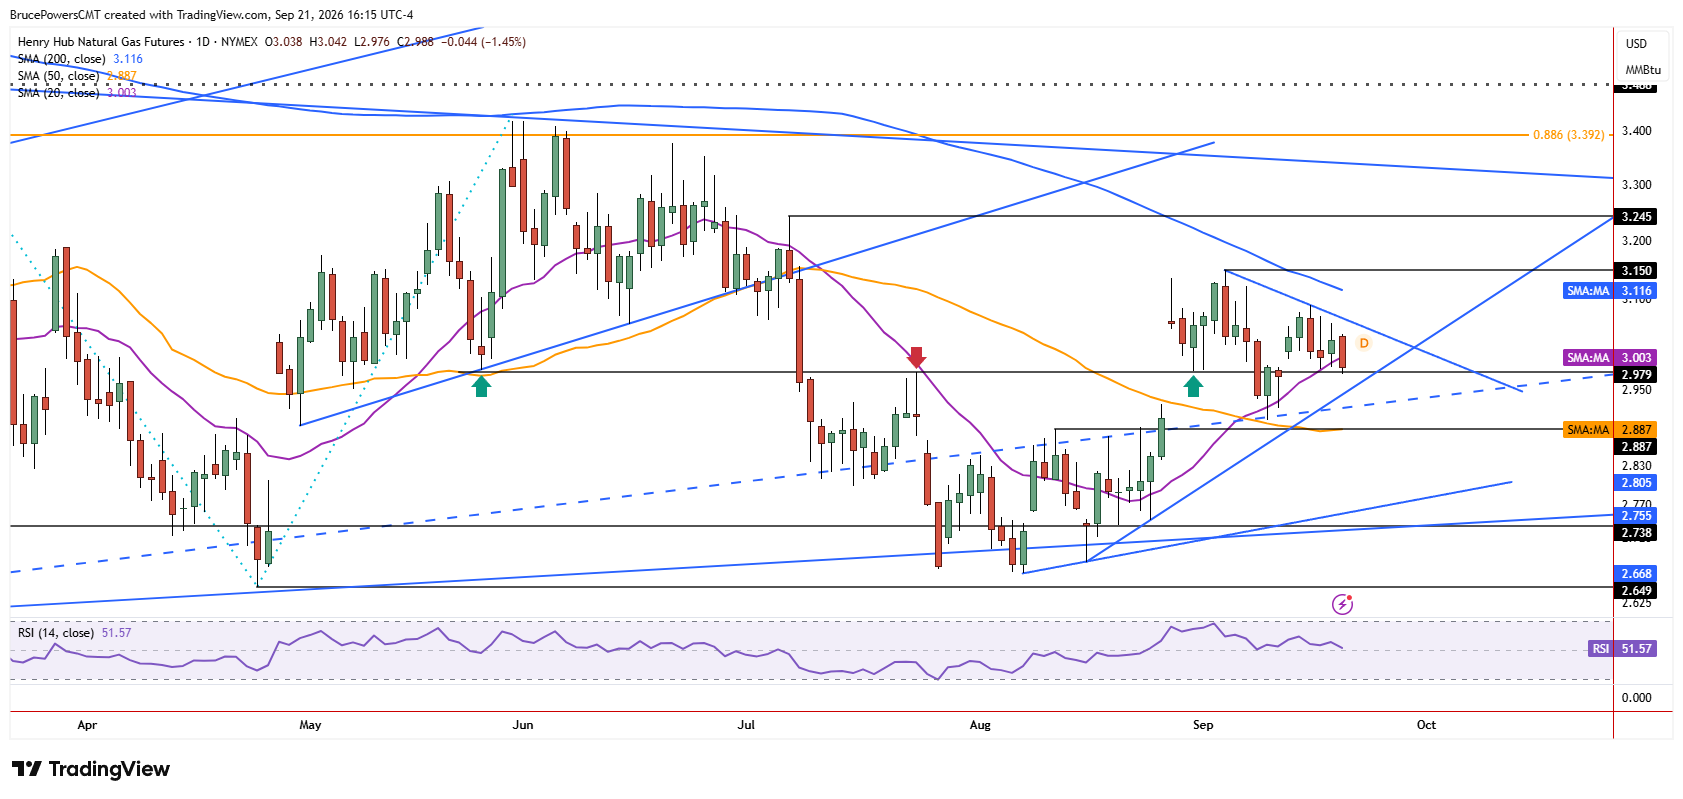
Natural gas fell below the 20-day moving average on Monday and is poised to close below it for the first time since August 17, reflecting short-term selling pressure. A lower daily high of $3.04 was established, along with a six-day low around $2.97. Sellers remain in charge at the time of writing and therefore a new low could be reached before the session ends. The bearish signal is also triggering a breakdown on the weekly timeframes, as last week completed an inside week after a fourth week of finding resistance near the 200-week moving average, currently near $3.08.

Key Support Zone Near $2.89
Nonetheless, key dynamic support is represented by the 50-day moving average near $2.89, which is currently aligned with previous key resistance at the swing high of $2.89. The August advance signaled a bullish reversal of the prior decline on a decisive rally above that high. Strength was subsequently confirmed by a reclaim of the 50-day moving average later that month, followed by a pullback and successful test of support at that average in early September. A higher swing low of $2.90 was established, which is now key structural support.
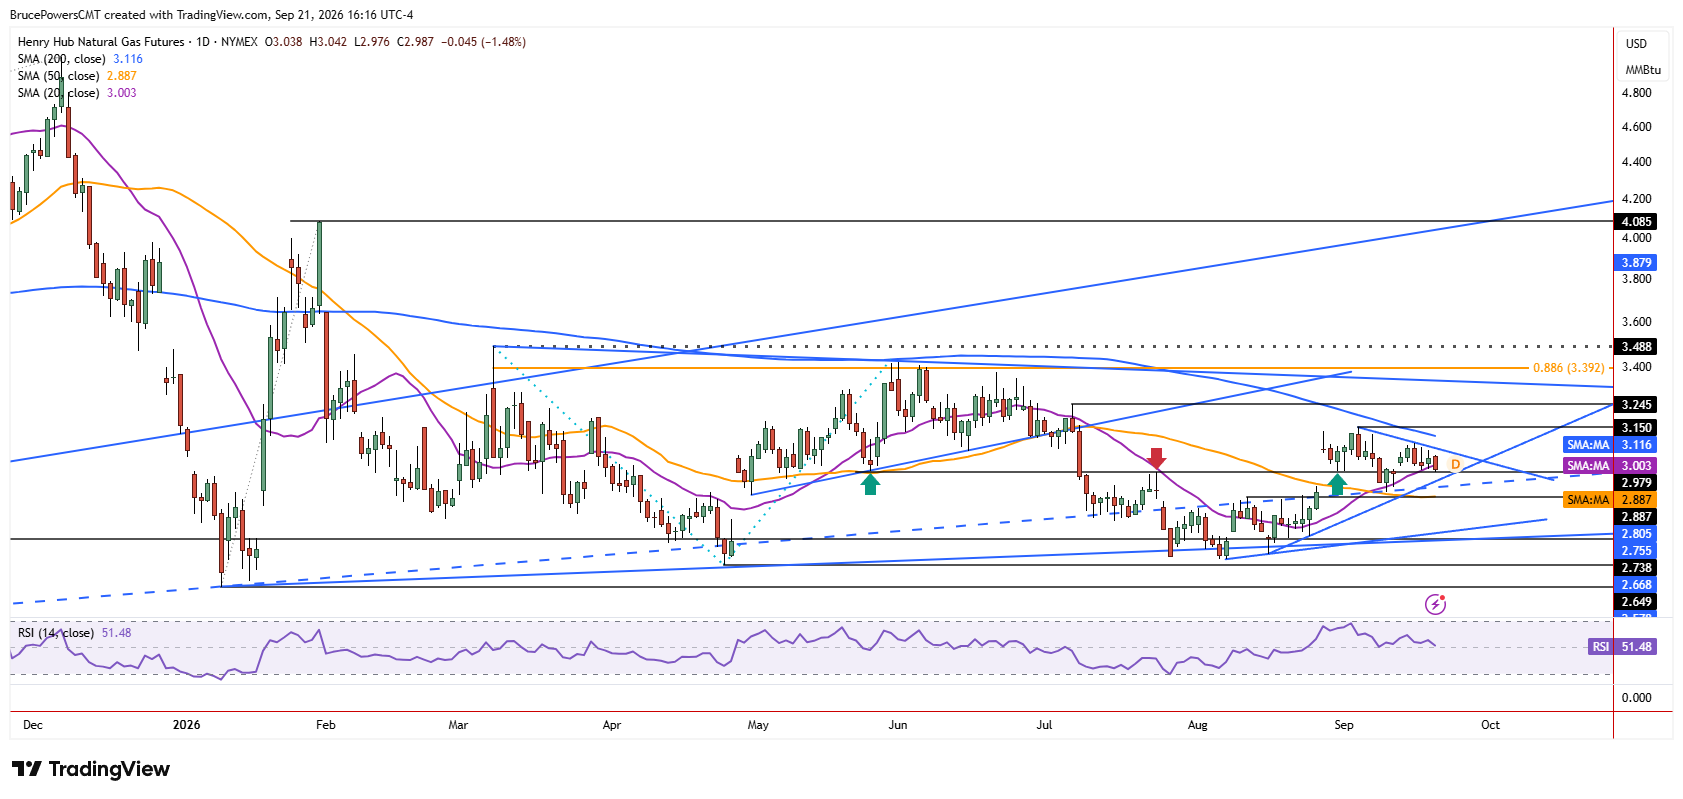
In addition to dynamic short-term support represented by the 20-day and 50-day moving averages, a short-term uptrend line also marks the potential lower boundary of the advance from August. If strength follows a test of the trendline, then an upside breakout could follow. Alternatively, a break below that line will target the 50-day moving average. That average has a good chance of holding as support since it was recently reclaimed and subsequently confirmed.
Trendlines Near a Decision Point
That rising trendline will cross the short-term falling line that goes across the upper boundary of recent price action within approximately six trading days. This means that a breakout of one of the lines will likely trigger before then and should help define the short-term direction. An upside breakout above Monday’s high would be the first sign of strength, which would also signal a bullish breakout on the weekly chart if it occurred before the end of this week. Key potential resistance is initially marked by the falling 200-day moving average at $3.12 and the recent high of $3.15.
If you’d like to know more about how to trade natural gas, please visit our educational area.