Gold (XAU) trades near $4,370 an ounce on Monday after the rebound on Friday. The price still remains under pressure due to higher bond yields. The U.S. two-year yield climbed to 4.75% while markets priced 53% chance of another Fed hike in October.
Inflation remains too high across the economy, which keeps the possibility of higher interest rates for longer. The hawkish outlook raises the cost of holding gold. Middle East tensions still support the demand for safe havens but higher yields are limiting the recovery for now.
Silver (XAG) rose toward $67 an ounce and gained for the third straight session. Oil prices continued to drop on Monday after marking a high last week. This drop in oil prices eased some inflation concerns and supported the recovery in metals. But further Fed tightening and elevated Treasury yields remain major risks.
Silver could extend the gains if oil continues to fall and expectations of rate softening persist. A fresh increase in yields and the U.S. dollar could slow the recovery in silver.

Gold Price Forecast: XAU/USD Trapped Between $4,300 and $4,530
XAU/USD Holds Key at $4,300
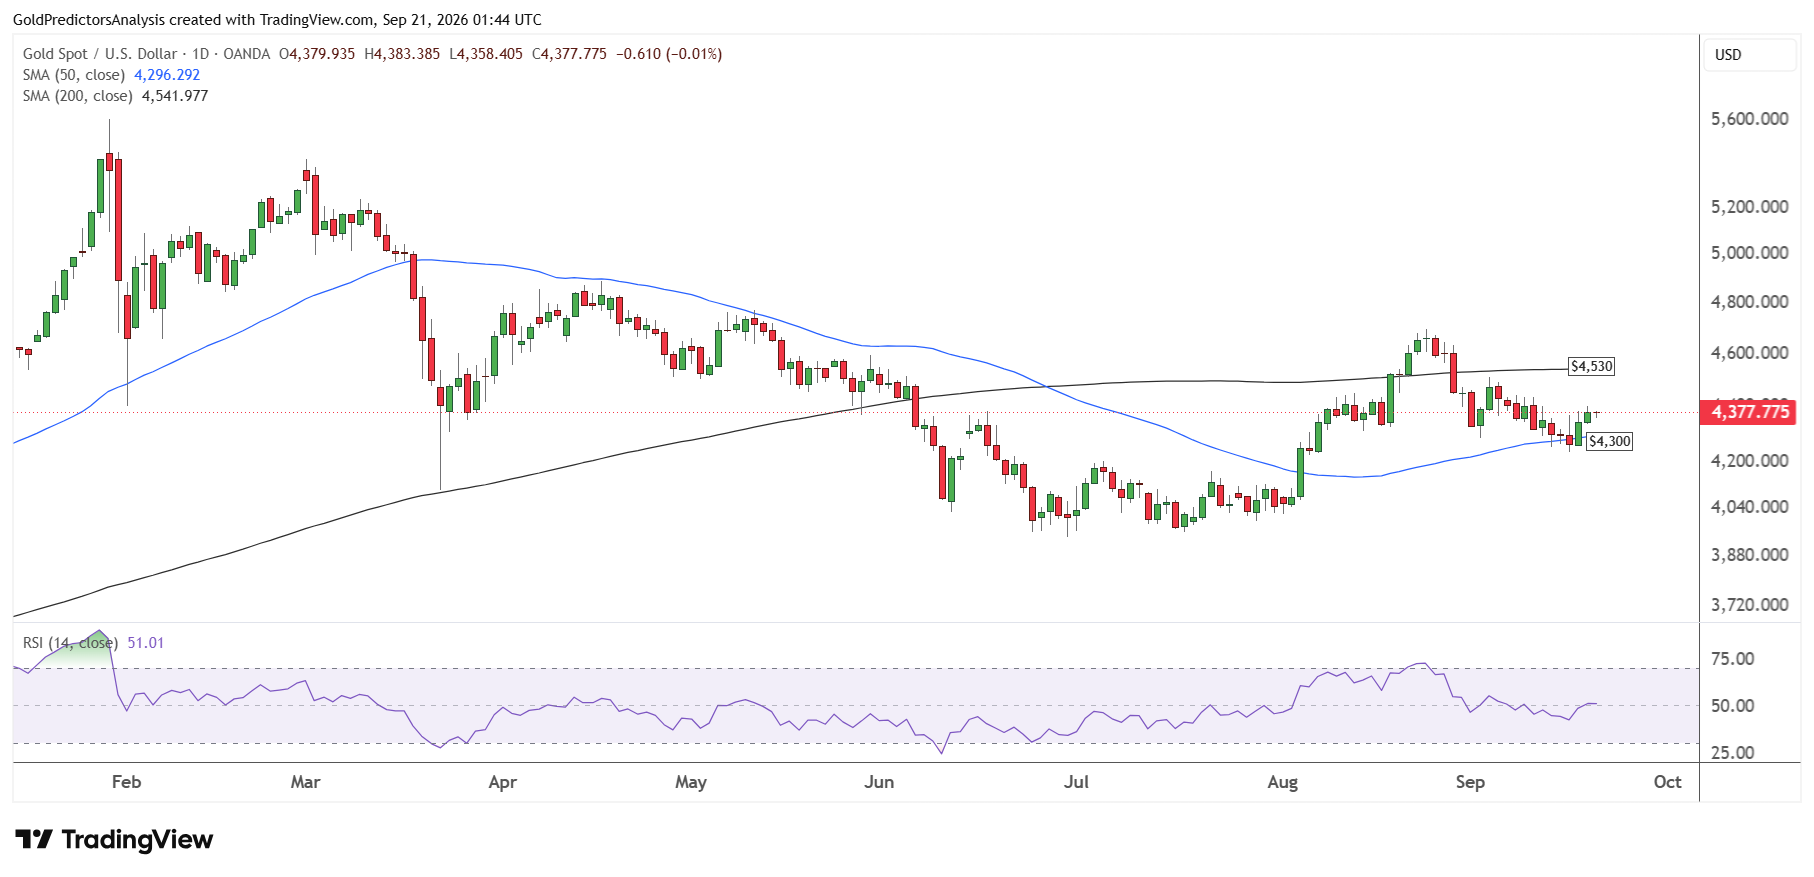
The daily chart for spot gold shows strong consolidation between the 50-day and 200-day SMAs in the $4,300 to $4,530 area. A break of these SMAs will likely define the next move in the gold market. A break below $4,300 will push the price towards the $4,150 area.
On the other hand, a break above $4,530 will open the way for a strong rally towards the $4,800 to $5,000 region. The RSI remains at the midline, which shows uncertainty in the short term. However, the price structure remains bullish as long as the price remains above the $4,000 level.
Gold Price Forecast
Every new Gold analysis as it publishes, today's technical signal and key levels, live price — on one page.
See all Gold forecastsXAU/USD Head-and-Shoulders Pattern Puts $4,300 Support at Risk
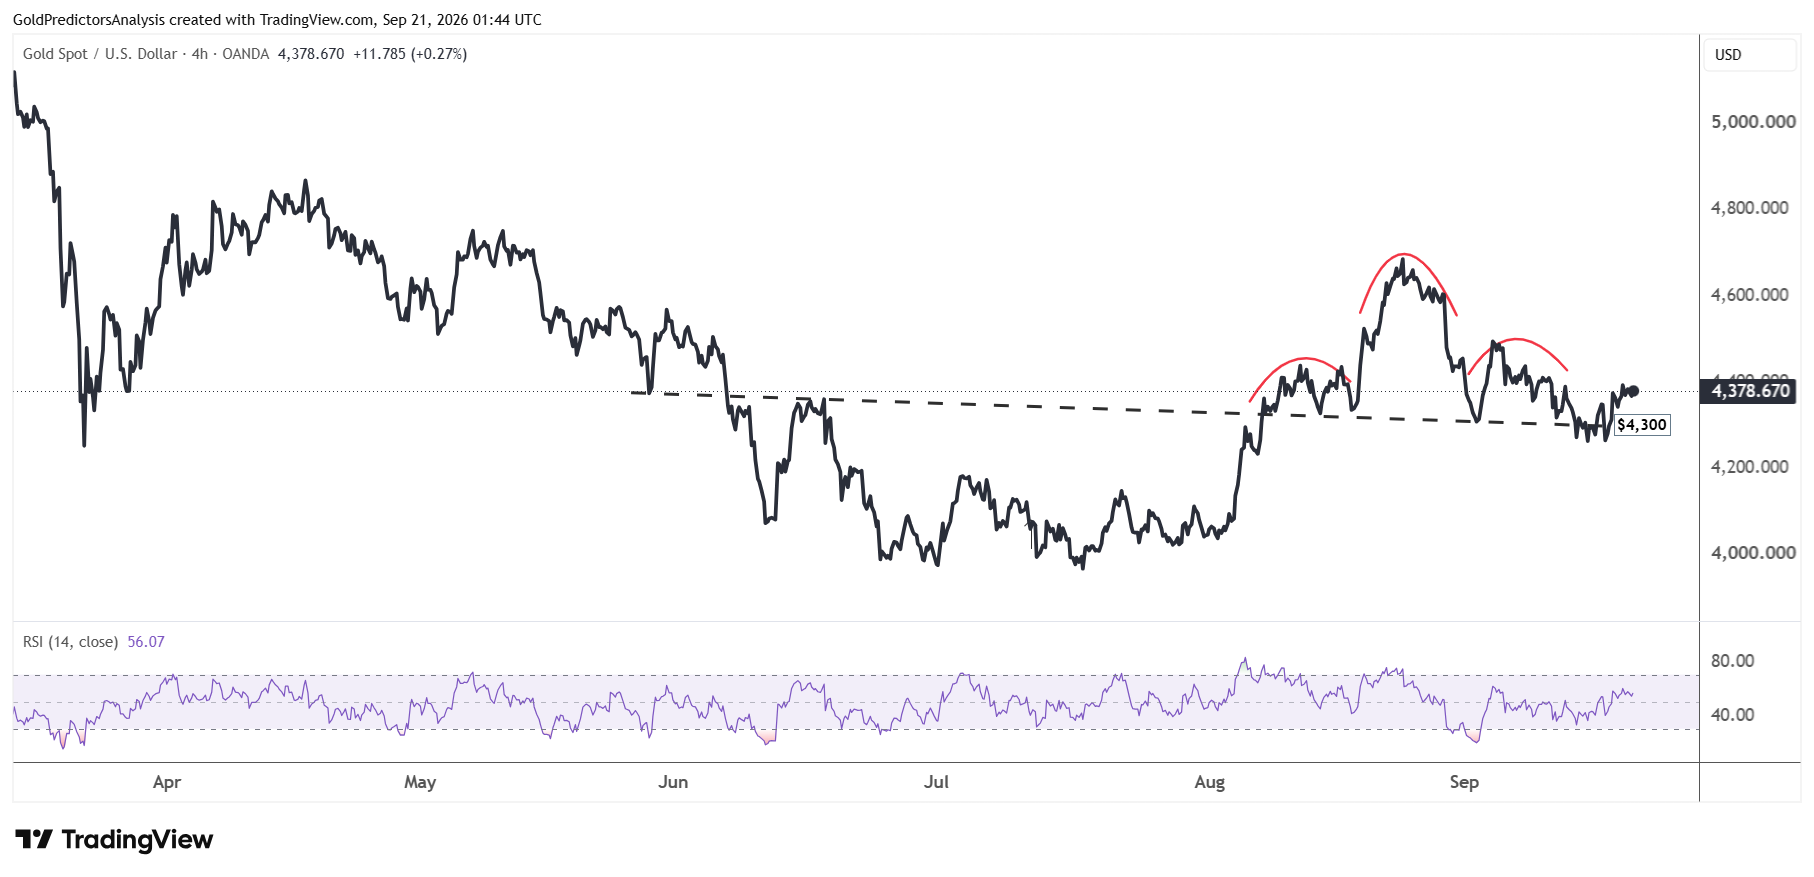
The 4-hour chart for spot gold shows negative price action around the key level of $4,300. The chart shows the formation of a head and shoulders pattern in August and September. A break below $4,300 will likely introduce deeper decline in the gold market.
However, a recovery above $4,530 will likely erase the bearish pattern and push the price higher. Gold prices have been consolidating in a tight range with no clear direction.
Silver Price Forecast: XAG/USD Eyes $72 After Triangle Breakout
XAGUSD Needs a Break Above $72 to Restore Bullish Momentum
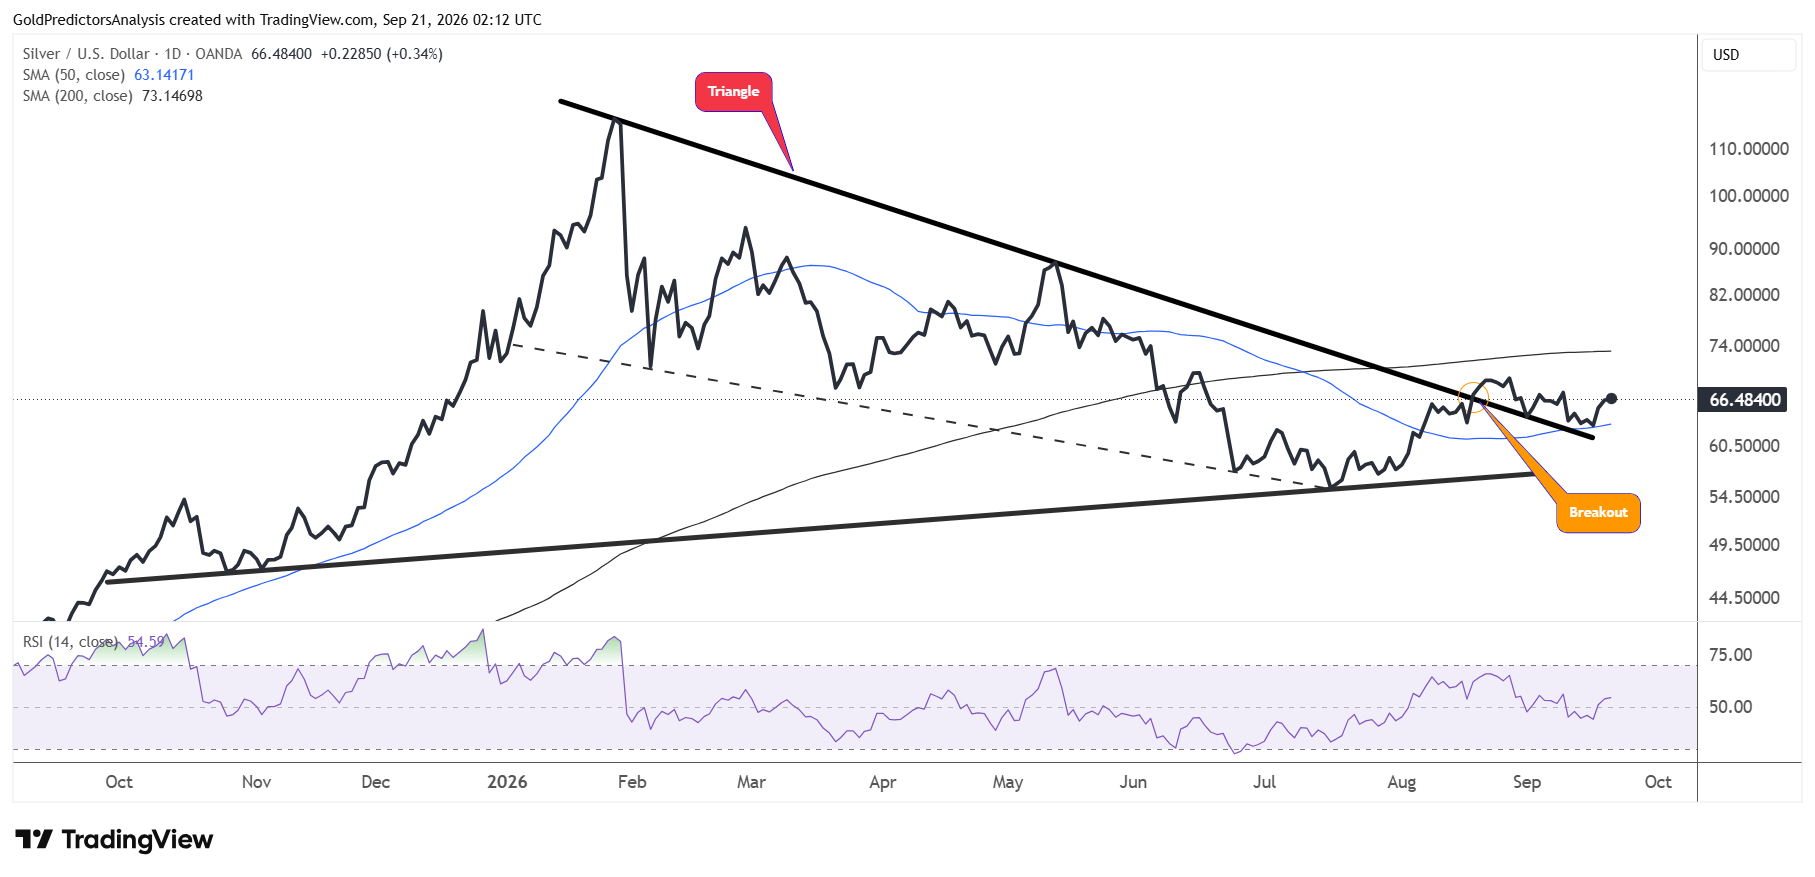
The daily chart for spot silver shows that the price broke the triangle pattern in August at $66.50. After breaking the triangle pattern, the price hit the key level of $72 and is now looking for the next move. The price is consolidating after the breakout from the triangle pattern and shows uncertainty.
A break above $72 is required to push prices higher. The immediate support in spot silver is the 50-day SMA at $63. A break below $63 will likely push prices towards the $60 area. However, a break below $60 will likely indicate further downside towards the $50 to $55 region.
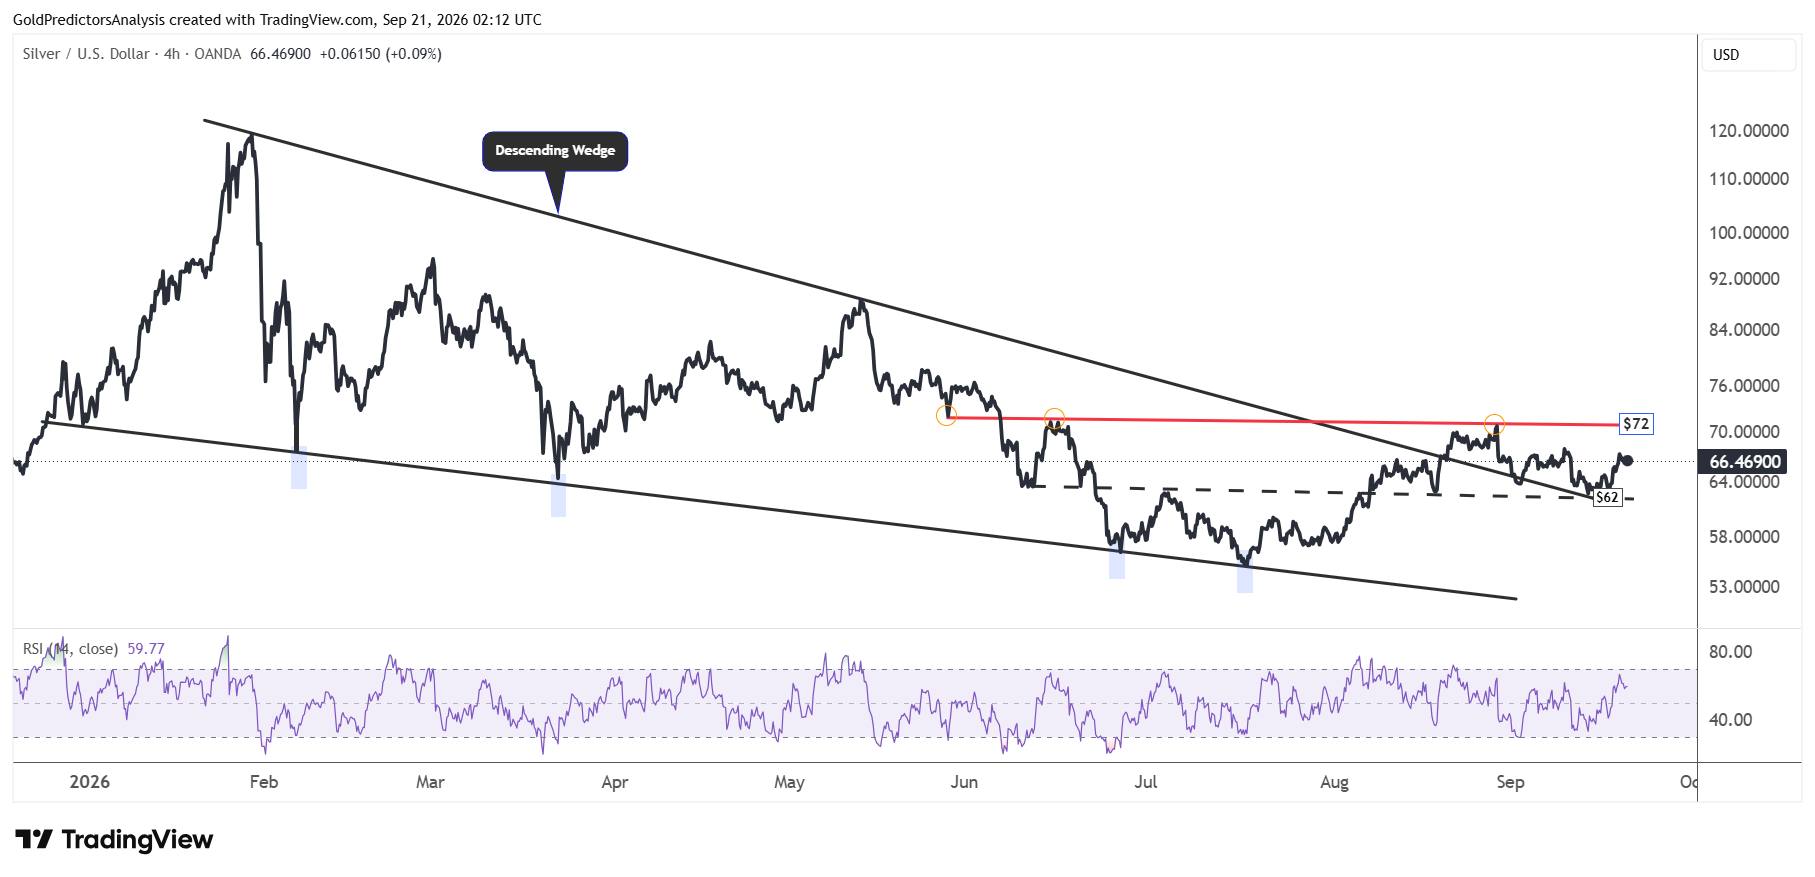
XAG/USD Faces $67.80 Resistance Before a Retest of $72
The 4-hour chart for spot silver shows the importance of the $72 area. The price must break above $72 to push higher but a break below $62 will likely introduce further downside. The breakout from the descending wedge now requires the price to move above $72 to trigger a strong rally.
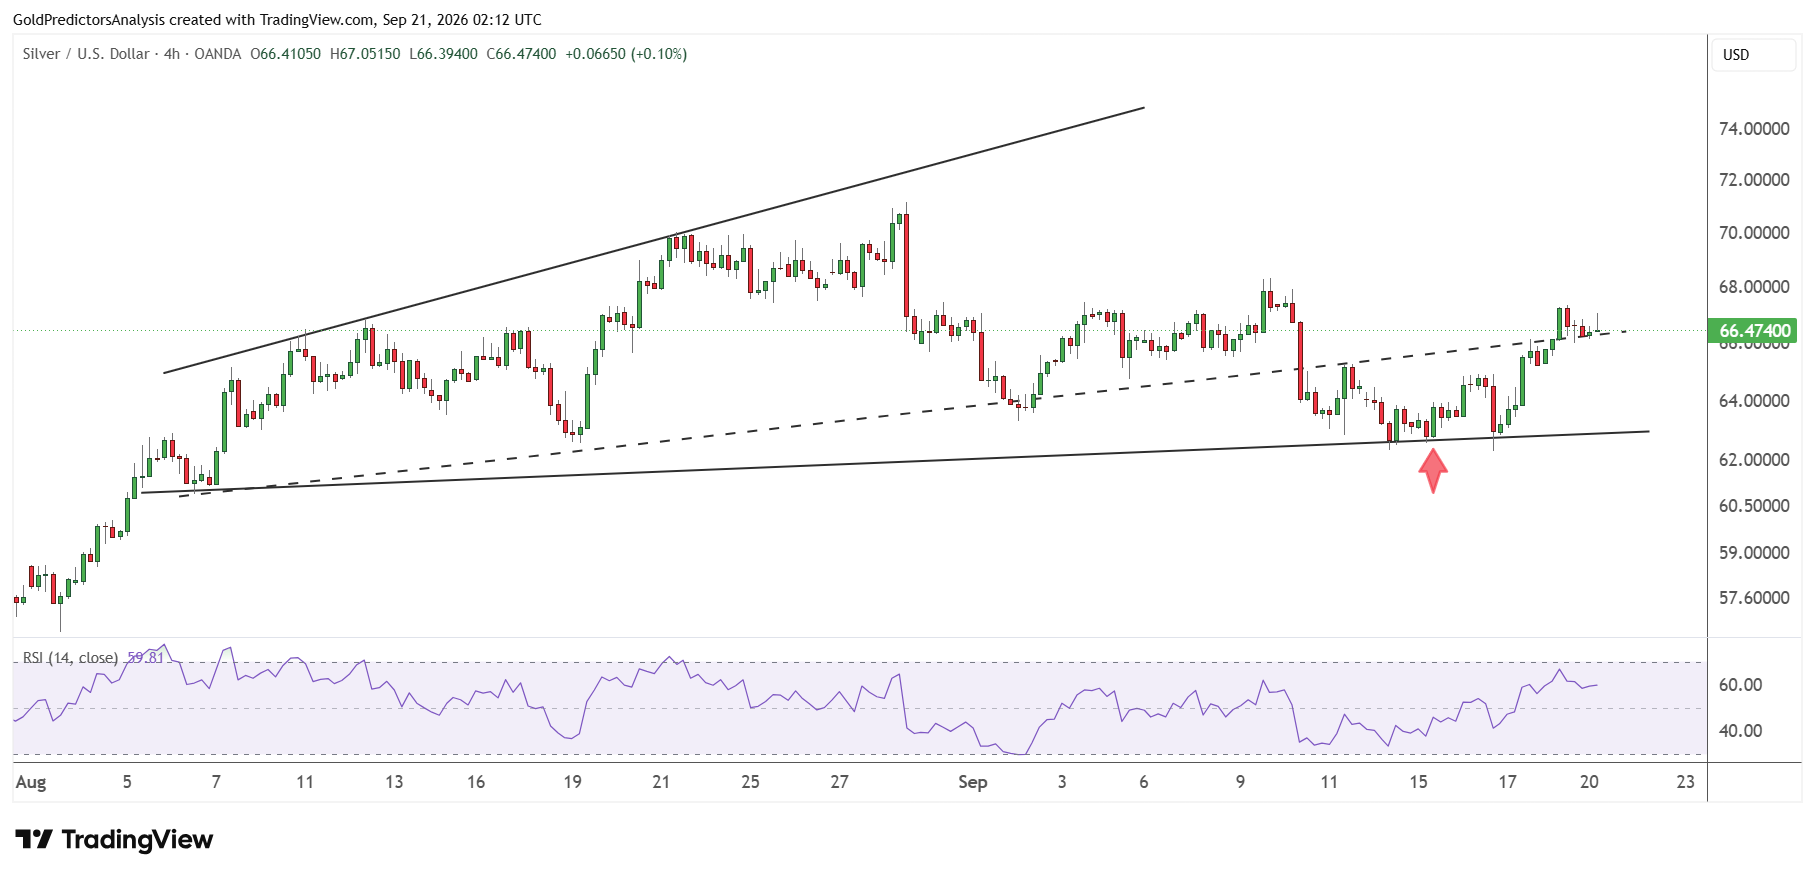
Another chart for spot silver shows that the price has formed strong support at the $62.50 level within the ascending broadening wedge pattern. After finding this support, the price has started to rally and now faces immediate resistance at $67.80. A break above $67.80 will open the way towards $72. But a break below $63 will likely open the way for a drop towards the $60 area.
What Is Next for Gold and Silver Prices?
Gold and silver prices remain in consolidation as investors weigh high yields against easing oil prices and geopolitical risks. Gold must hold above $4,300 to protect the bullish structure. A break above $4,530 could trigger the rally towards $4,800 and $5,000. But a break below $4,300 would expose the $4,150 area.
Silver also needs a clear breakout. A move above $67.80 would open the way towards $72 while a break below $63 could push the price towards $60. In my view, the next move in both metals will likely depend on the Treasury yields and Fed expectations.