
Natural Gas Gained a Penny on Short Covering and Called It a Day
Short covering into the weekend lifted October natural gas off a one-week low and that was the extent of it. European gas hit a 3.75-year high earlier in the week and the bid leaked into U.S. contracts. The Commodity Weather Group shifted cooler Friday morning and took the late-season demand argument off the table. The rally came from positioning, not from anything fundamental changing.
October Nymex natural gas settled at $2.912, up $0.011 or +0.38%.

Daily October Natural Gas Technical Analysis
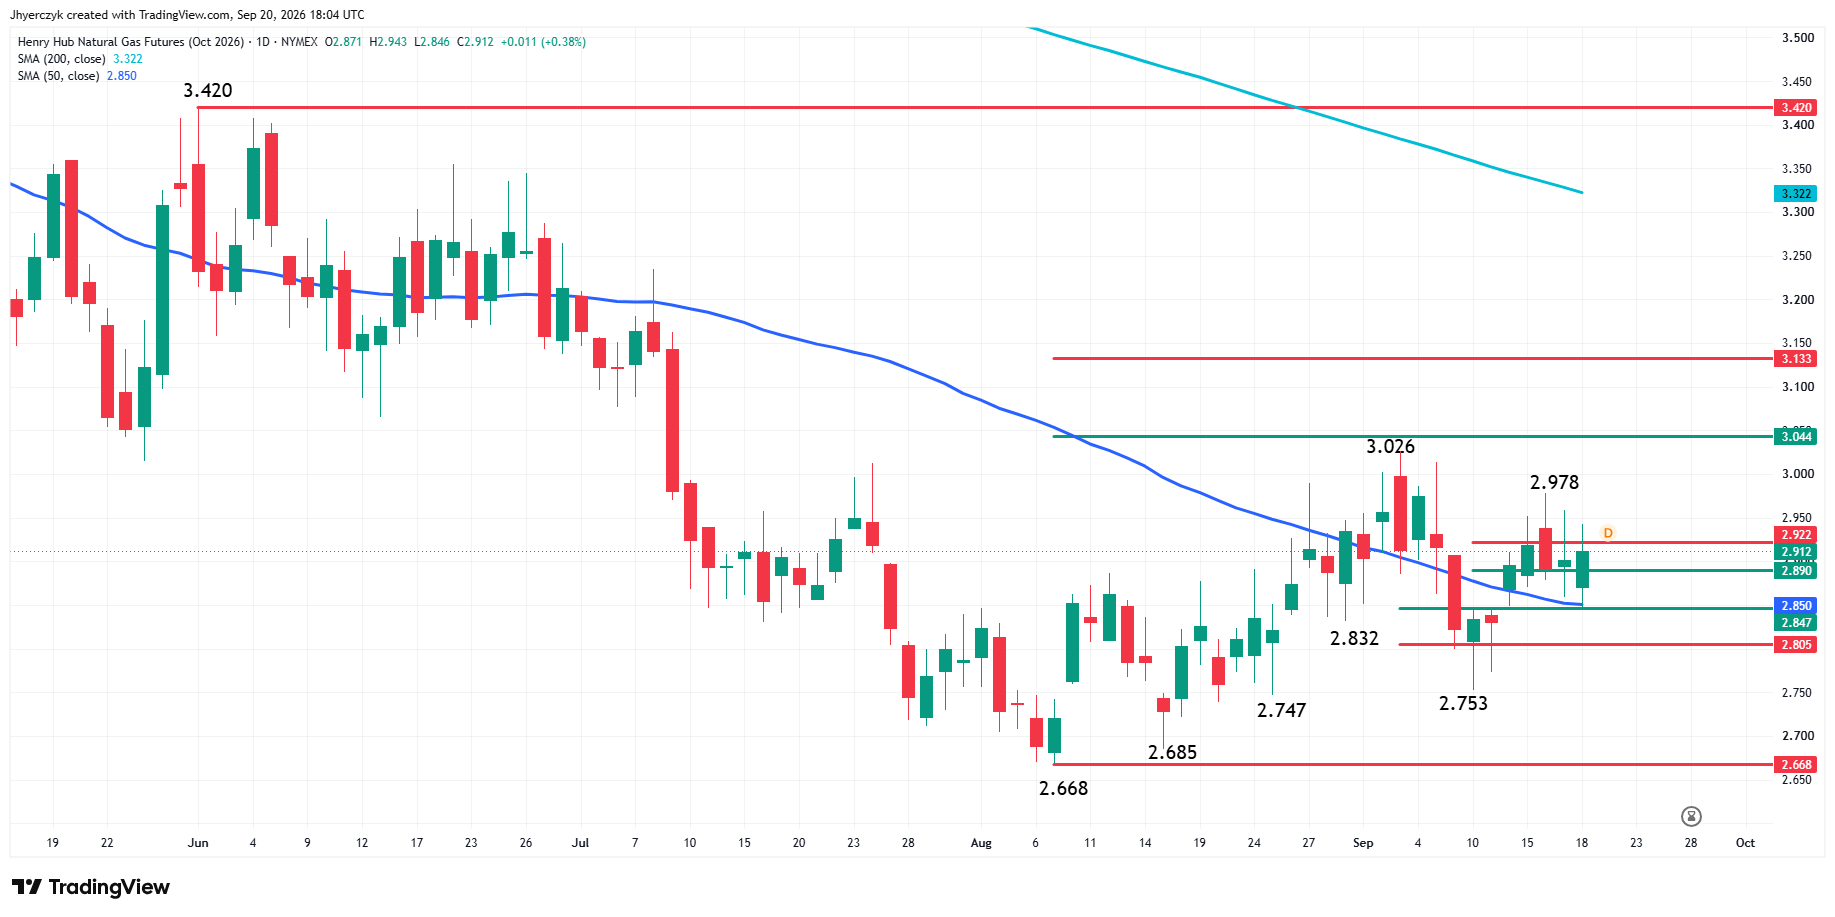
October natural gas futures closed higher on Friday and finished on the strong side of the 50-day moving average at $2.850. Buyers faced resistance at a minor retracement zone from $2.890 to $2.922. The main trend remains down on the daily swing chart, with main tops at $2.978 and $3.026.
On the downside, retracement-zone support sits directly below the 50-day moving average at $2.847 to $2.805.
Daily November Natural Gas Technical Analysis
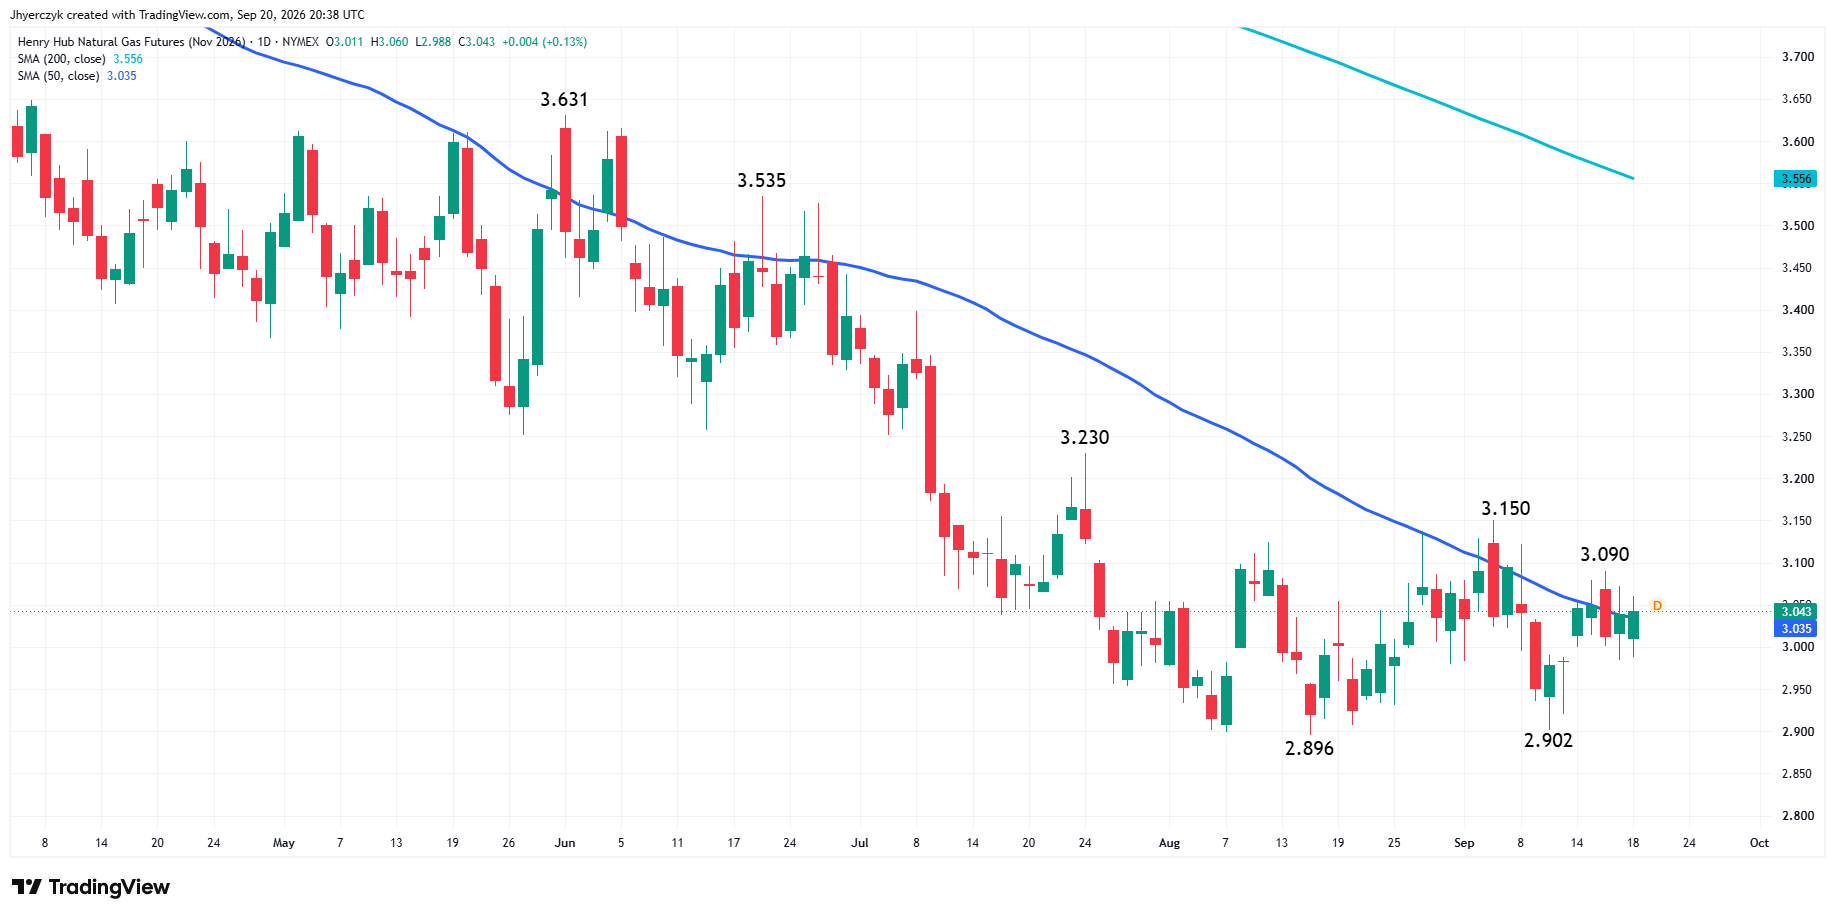
November natural gas futures settled at $3.043 on Friday, slightly above the 50-day moving average at $3.035. The main trend remains down on the daily swing chart. The key upside level is the September 3 main top at $3.150. Nearby resistance is the September 16 high of $3.090.
On the downside, the 50-day moving average at $3.035 is the first support, followed by the $3.000 area, the September 10 low at $2.902 and the August 17 low at $2.896.
Natural Gas Price Forecast
Every new Natural Gas analysis as it publishes, today's technical signal and key levels, live price — on one page.
See all Natural Gas forecastsThe Forecast Killed the Last Reason to Buy
Above-normal temperatures are retreating across the South and Southeast between September 23 and October 2. Gas-fired power burn was the only domestic demand story keeping this market off its lows. That story ended Friday morning with one model run. The Edison Electric Institute still has lower-48 electricity output up 16.1% from a year earlier at 94,427 gigawatt hours in the week ended September 12 and trailing 52-week generation up 3.3%. Those numbers belong to last week. Next week’s numbers lose the heat behind them.
One Light Build Does Not Fix the October Problem
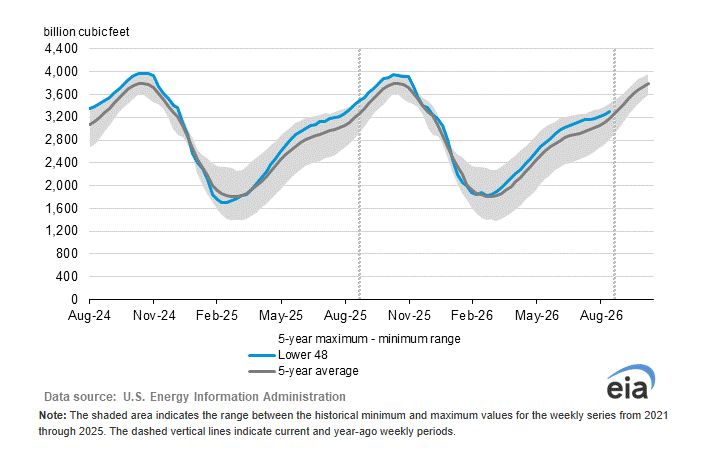
Thursday’s 44 bcf injection came in below the 48 bcf estimate and well under the five-year average build of 74 bcf. That should have mattered more than it did. Inventories are sitting 3.7% above the five-year seasonal average. The EIA has end-of-October inventories projected at 3,985 bcf, highest in a decade. A single lean build against a trajectory like that is a footnote. The bulls needed five of them in a row and the cooler forecast just told them they are not getting the next one.
134 Rigs and Nobody Is Slowing Down
Baker Hughes pushed the natural gas rig count to 134 on Friday. That matches the three-year high from February. At $2.91 producers are not pulling back. They are adding iron. Lower-48 dry gas production ran 113.8 bcf per day, up 4.9% from a year earlier according to BNEF. Demand came in at 75.7 bcf per day, down 0.6% from a year ago. The gap between supply and domestic demand is not closing. The EIA raised its 2027 production forecast to 116.0 bcf per day from 115.3 in July. More gas is coming next year too.
LNG net flows to export terminals ran 19.2 bcf per day, up 0.7% from the prior week. Exports are doing what they can. They are not growing fast enough week to week to change the math on 113.8 bcf per day of production heading into the shoulder season.
Europe Is the Only Bid Standing
European storage sat at 69% full as of September 16. The five-year average is 85%. Norway has nothing left to send. Russian gas is off the table. Qatari cargoes are stuck behind the Strait of Hormuz. Spot LNG was trading near $26 per million British thermal units in the week ended September 11. That is 150% above where it sat in February. Europe is paying that because there is nothing else available at any price.
Asia is backing away from the same market. Kpler tracked Asian LNG imports at 20.09 million metric tons in September, down from 22.27 million a year earlier. Coal and pipeline gas are cheaper. Europe could pull 7.98 million tons this month and October volumes may reach 10.53 million as utilities scramble to close the storage deficit before the first cold snap. The less Asia buys the more Europe has to fight over and the prices reflect it.
What to Watch
Weather models next week are the first test. If the cooler pattern holds, domestic demand fades into shoulder season and sellers have the surplus, the production growth, and the rig count all working for them heading into October expiration. Europe is the one force that can override all of that. Storage 16 points below average with winter approaching and the Strait still closed means one disruption headline away from another spike in overseas prices that pulls U.S. exports higher and tightens the weekly builds.
The October contract leans bearish with the main trend down on the daily swing chart and the lower main top at $2.978 reinforcing resistance. The 50-day moving average at $2.850 is the pivot and the market is sitting on it without pushing through. A sustained move through $2.922 would be the first sign of a near-term shift, however, clearing $2.978 is required to change the trend. Below the 50-day, the retracement zone at $2.847 to $2.805 is the first target.
November is telling a different story. The settle above the 50-day at $3.035 and a higher low at $2.902 versus the August low at $2.896 say selling pressure is fading on this contract. Buyers need $3.090 to put the main top at $3.150 in play and clearing that level turns the main trend higher. Below the 50-day, $3.000 is the line, followed by $2.902 and $2.896. The 200-day moving average at $3.556 remains well overhead.
More Information in our Economic Calendar.