


Silver (XAG) ended last week near $66 after rebounding on Friday, but the outlook remains uncertain in the short term. Expectations of another Fed rate hike, a U.S. dollar index above 100 and the 10-year Treasury yield near 5% may limit further gains. But the price structure in the long term remains bullish while the support zone of $50-$55 holds. In my view, a break above $72 could open the path toward $90, while a move below $60 may bring $55 back into focus.
Fed Hike and 5% Treasury Yields Keep Silver Under Pressure
Silver enters the new week under pressure due to tighter U.S. monetary conditions. The Federal Reserve raised interest rates by 25 basis points to 3.75%-4.00% on Wednesday. The market expects the odds of another rate hike in October to be 57.6%. This hawkish outlook may limit the recovery in silver.
The U.S. dollar index gained about 1.2% last week and touched 100.45 on Friday. This was highest level in seven weeks. Higher U.S. rates supported the dollar by making dollar based assets more attractive. Therefore, silver may struggle to extend the recovery if the index remains above 100.
Despite these headwinds, spot silver rebounded on Friday to close the week at $66.25. The correction in oil prices eased some concerns of inflation and encouraged investors to close bearish positions. This rebound shows that buyers remain active near the current levels. But it does not confirm a broader recovery because the dollar and Treasury yields remain elevated.
Silver will now react to busy week of U.S. economic data and Fed speeches. Flash PMI data, jobless claims and durable goods orders may reshape expectations of interest rates. Strong data or hawkish Fed comments could keep the dollar strong and the 10-year Treasury yield near 5%. But the soft readings may weaken the dollar and help silver extend the recovery.
Brent Oil Price Forecast
Every new Brent Oil analysis as it publishes, today's technical signal and key levels, live price — on one page.
See all Brent Oil forecastsSilver’s Next Move Depends on the 10-Year Treasury Yield Near 5%
The daily chart for 10-year US Treasury yields shows that the yield has climbed back to the resistance level of 5%. The Treasury yield remains above the 50-day SMA at 4.72% and the 200-day SMA at 4.40%. This structure keeps the yield trend positive.
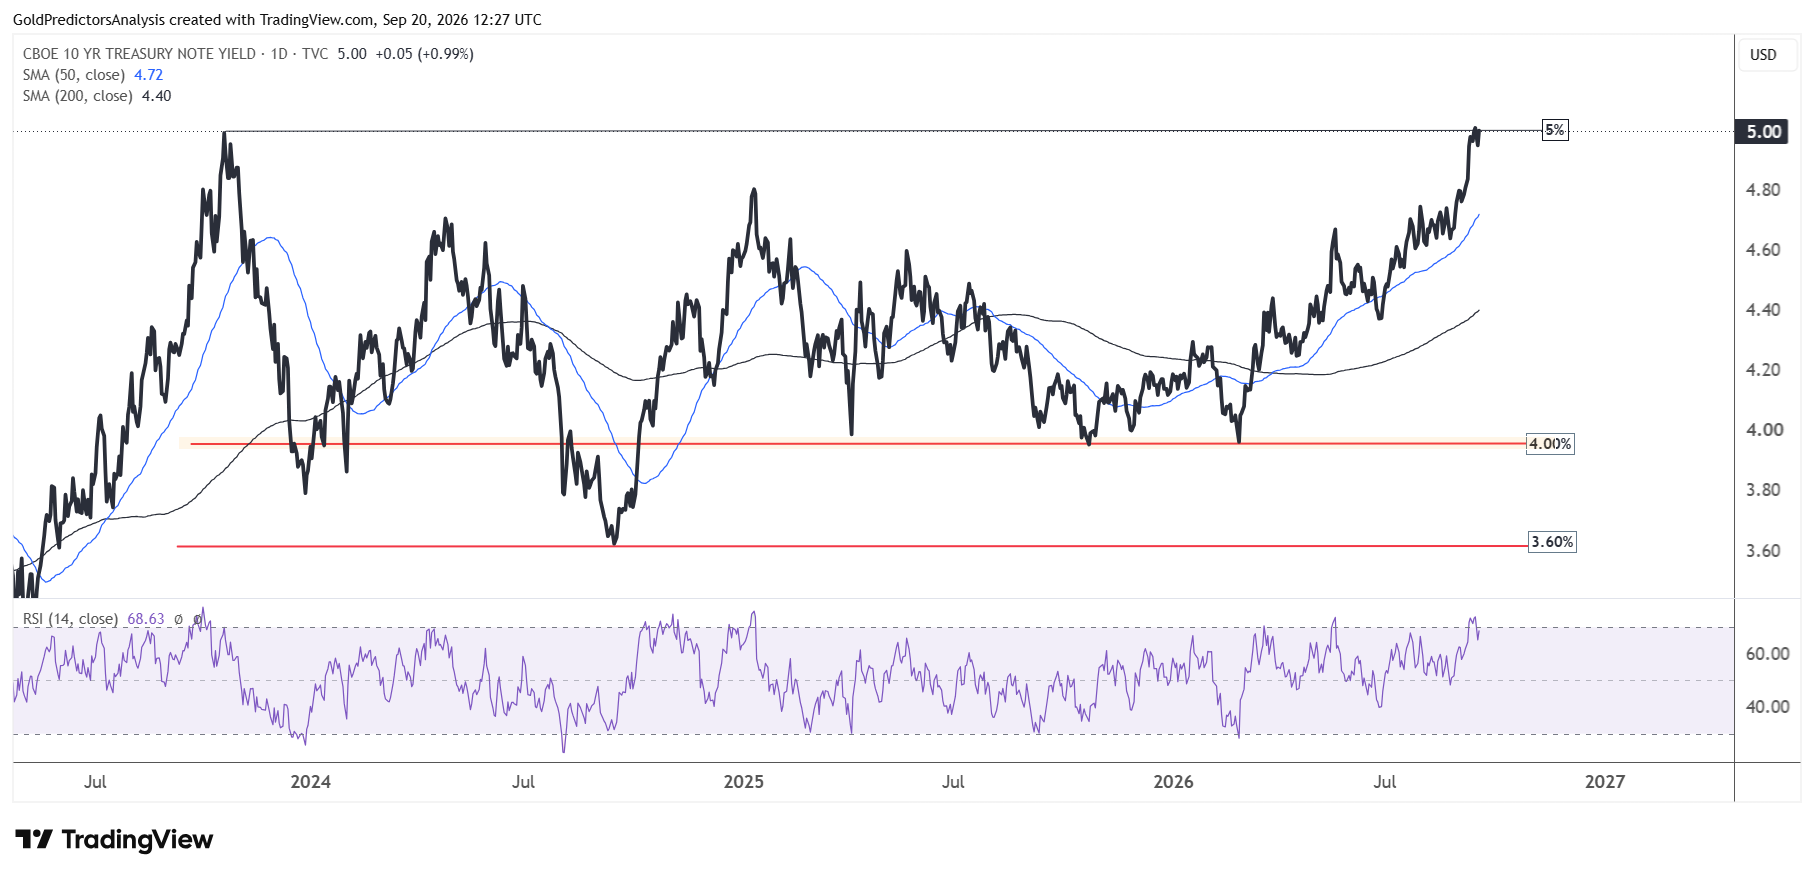
The RSI is near 69 which shows strong momentum. But it also places the yield close to overbought territory. A clear break above 5% could extend the rally in Treasury yields. But a rejection could pull the yield back toward the 50-day SMA.
The chart below shows that gold (XAU) and silver began strong rallies in late 2023 despite the US Treasury yields remaining high. This shows that rising yields did not completely remove demand for precious metals.
But both metals started to correct as the 10-year yield moved back toward 5% in 2026. Higher yields increase the opportunity cost of holding silver because the metal pays no interest. Therefore, the latest rise in yields may continue to limit the recovery in silver in the short term.
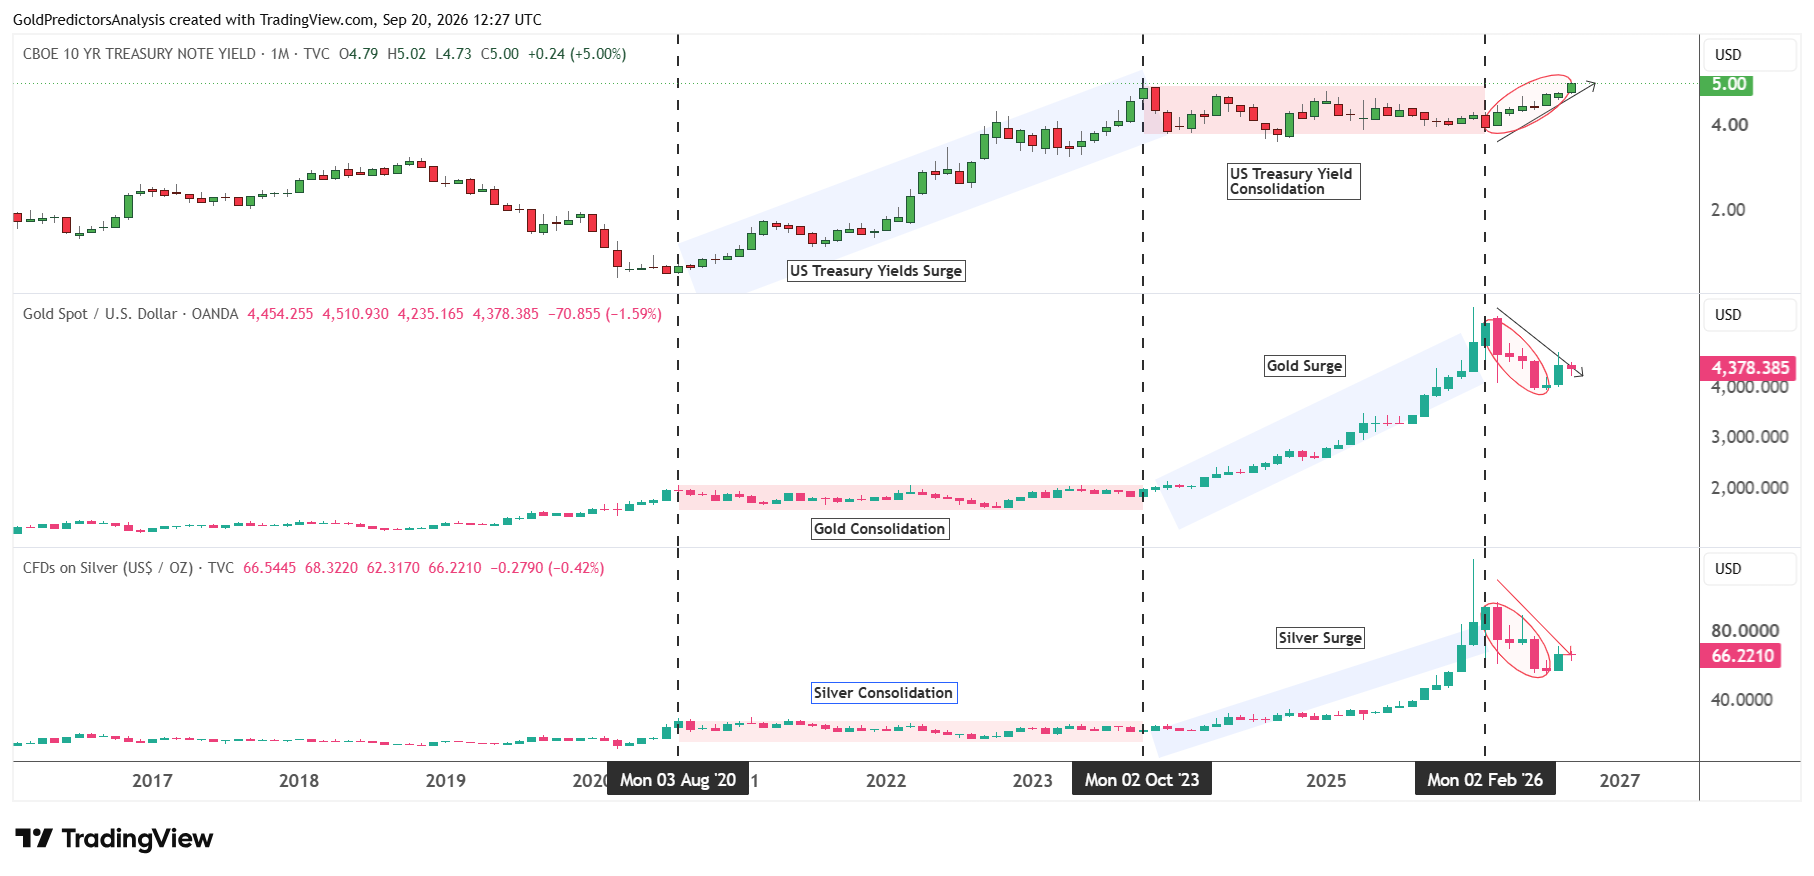
Silver is now consolidating near $66 after the sharp decline from the record high. A rejection in the 10-year yield at 5% would reduce some pressure and could support silver to push the price back to the resistance level of $72.
A break above 5% in 10-year US Treasury yields would create headwinds for silver and may push the price back to the support zone of $50-$55. In my view, the reaction of the 10-year yield around 5% will help determine whether silver resumes the long term rally or extends the correction.
US Dollar Index Near 100.50 Adds to Silver’s Headwinds
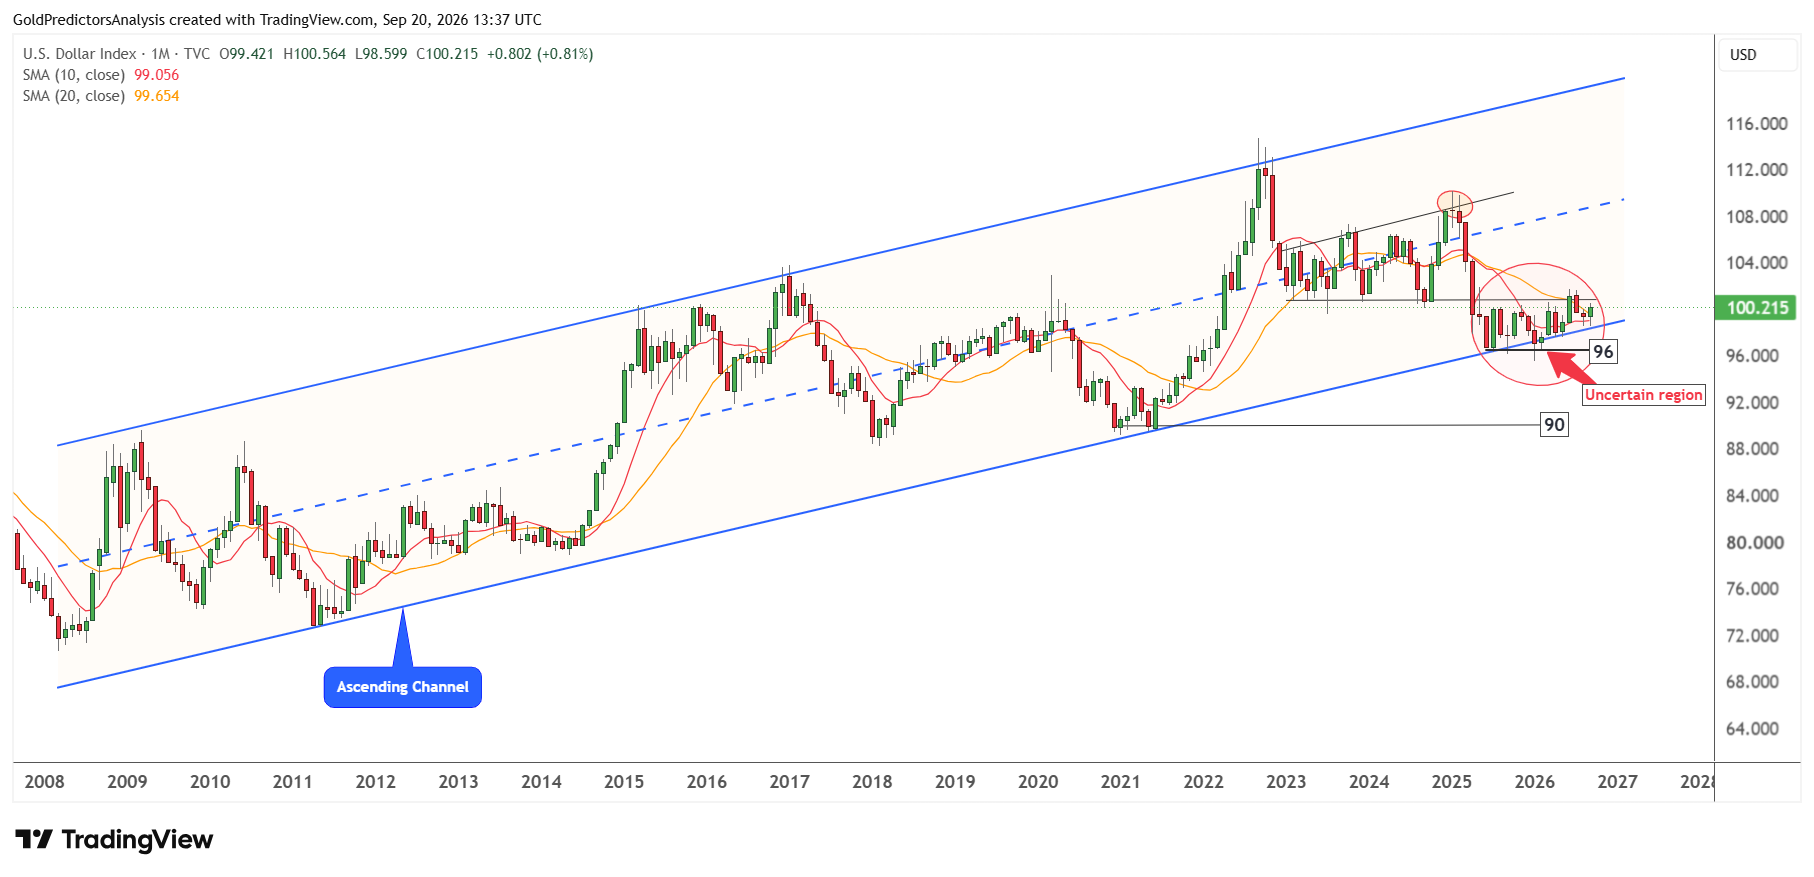
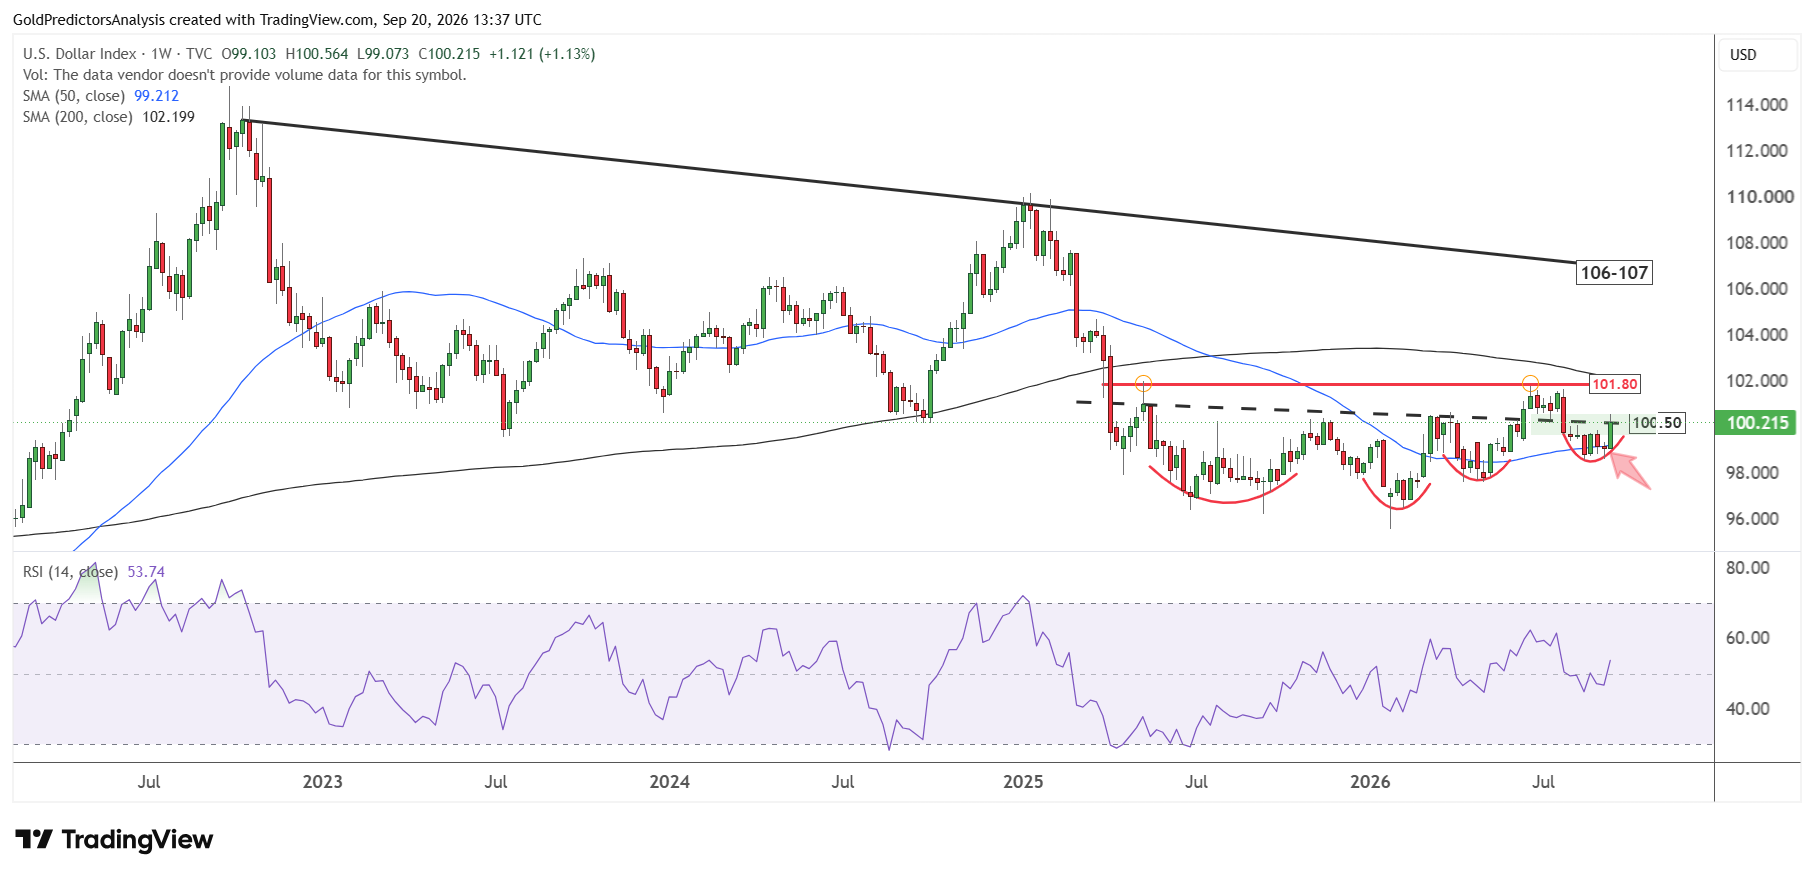
The U.S. dollar index has been consolidating in a tight range since June 2025. The index hit a low of 96.37 in July 2025 and started to consolidate between 96.50 and 100.50. The index attempted to break above 100.50 in June 2026 and hit a high of 101.80, but it failed to break higher and dropped again.
The failure to break above 100.50 signals strong uncertainty in the short term. The index faces strong support at 96. This support is reinforced by the ascending channel pattern that stretches from the April 2011 lows. A break below 96 will lead to strong drop toward the 90 area. But a break above 101.80 will push the index higher toward the 106-107 zone.
The strong consolidation from June 2025 through 2026 is also evident on the weekly chart. The chart shows that the price is trying to stabilize above support at the 96 level. This consolidation is now approaching the band between the 50- and 200-week SMAs.
A break above 101.80 will likely push the index toward the descending trend line in the 106-107 zone. This descending trend line stretches from the September 2022 highs. The RSI remains above the midline, which indicates further upside in the short term.
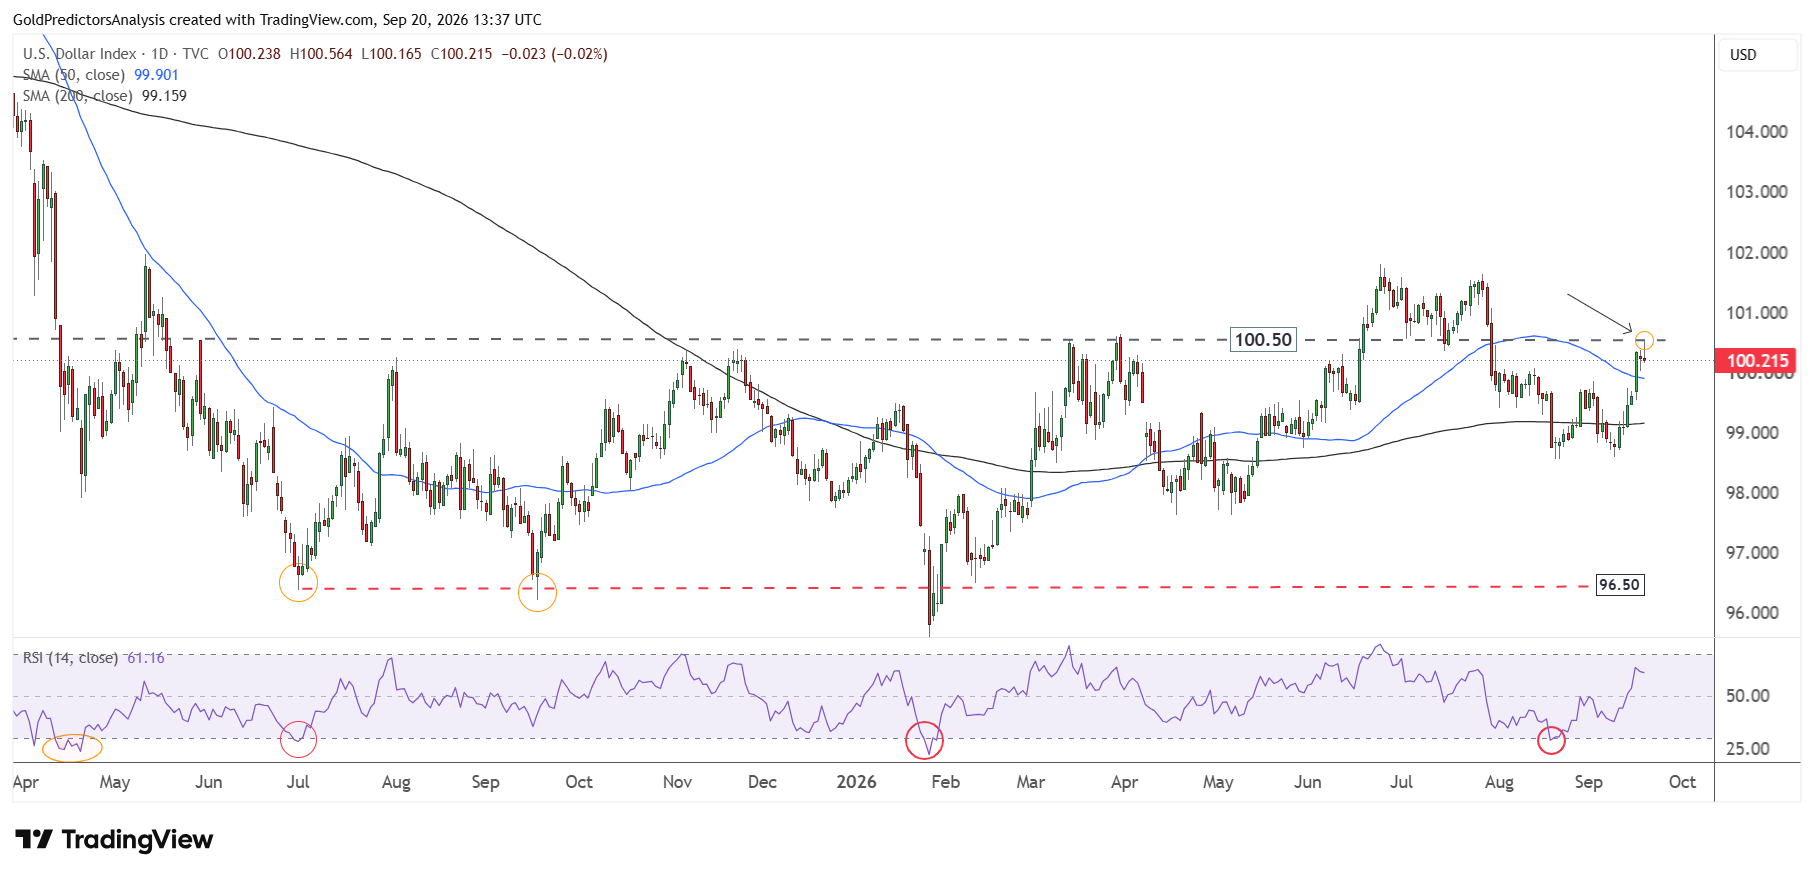
The daily chart for the U.S. dollar index shows that the index has recovered above the 50-day SMA at 99.90 and reached a high of 100.50 last week. The index fell again on Friday but the outlook remains uncertain due to expectations of a further rate hike by the Fed.
A break above 100.50 will push the index toward 101.80. The strength in the U.S. dollar index suggests that the rallies in silver prices might be limited in the short term.
Long-Term Silver Outlook Remains Bullish Above $45–$55 Support
Cup-and-Handle Supports the Long-Term Bullish Structure
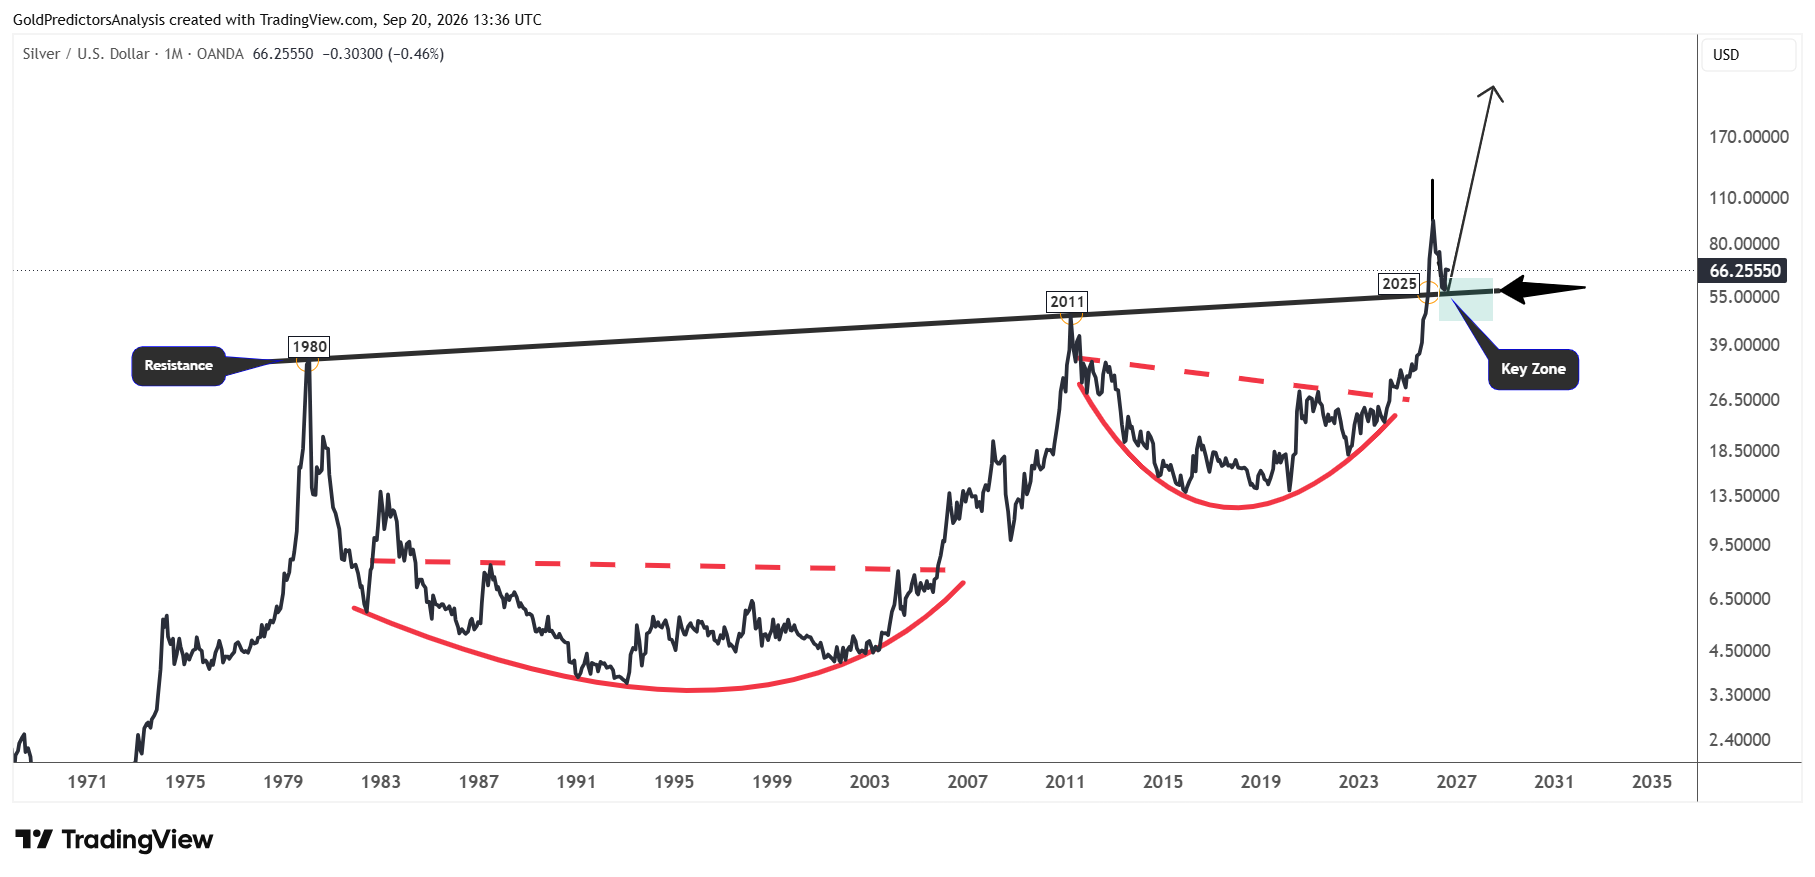
Silver shows a constructive price structure in the long term despite strong uncertainty in the short term. This bullish structure is visible on the monthly chart, which shows the formation of a cup and handle pattern.
The price broke out of this formation in 2025 and marked a high at $120 in 2026. After reaching this high, prices retraced to test support at the neckline of the cup and handle around $50-$55 and triggered another rebound.
The key zone remains between $45 and $55. As long as this support zone holds, the possibility of another surge in silver during the next few months remains high. But a failure at $45 may push silver toward the $35 area.
Ascending Channel Points to $90 Above $72 Resistance
The importance of the $50 region in spot silver is also evident on the monthly chart below. The chart shows that silver prices have been trading within an ascending channel since the May 2020 lows.
The silver price formed an inverted head and shoulders pattern from September 2020 to May 2024 and triggered a strong surge toward the resistance of this channel in January 2026.
The sharp shadow candles in January 2026 and May 2026 suggest that the silver market entered a strong consolidation zone. This triggered a strong drop to a market low of $54.77 in July 2026.
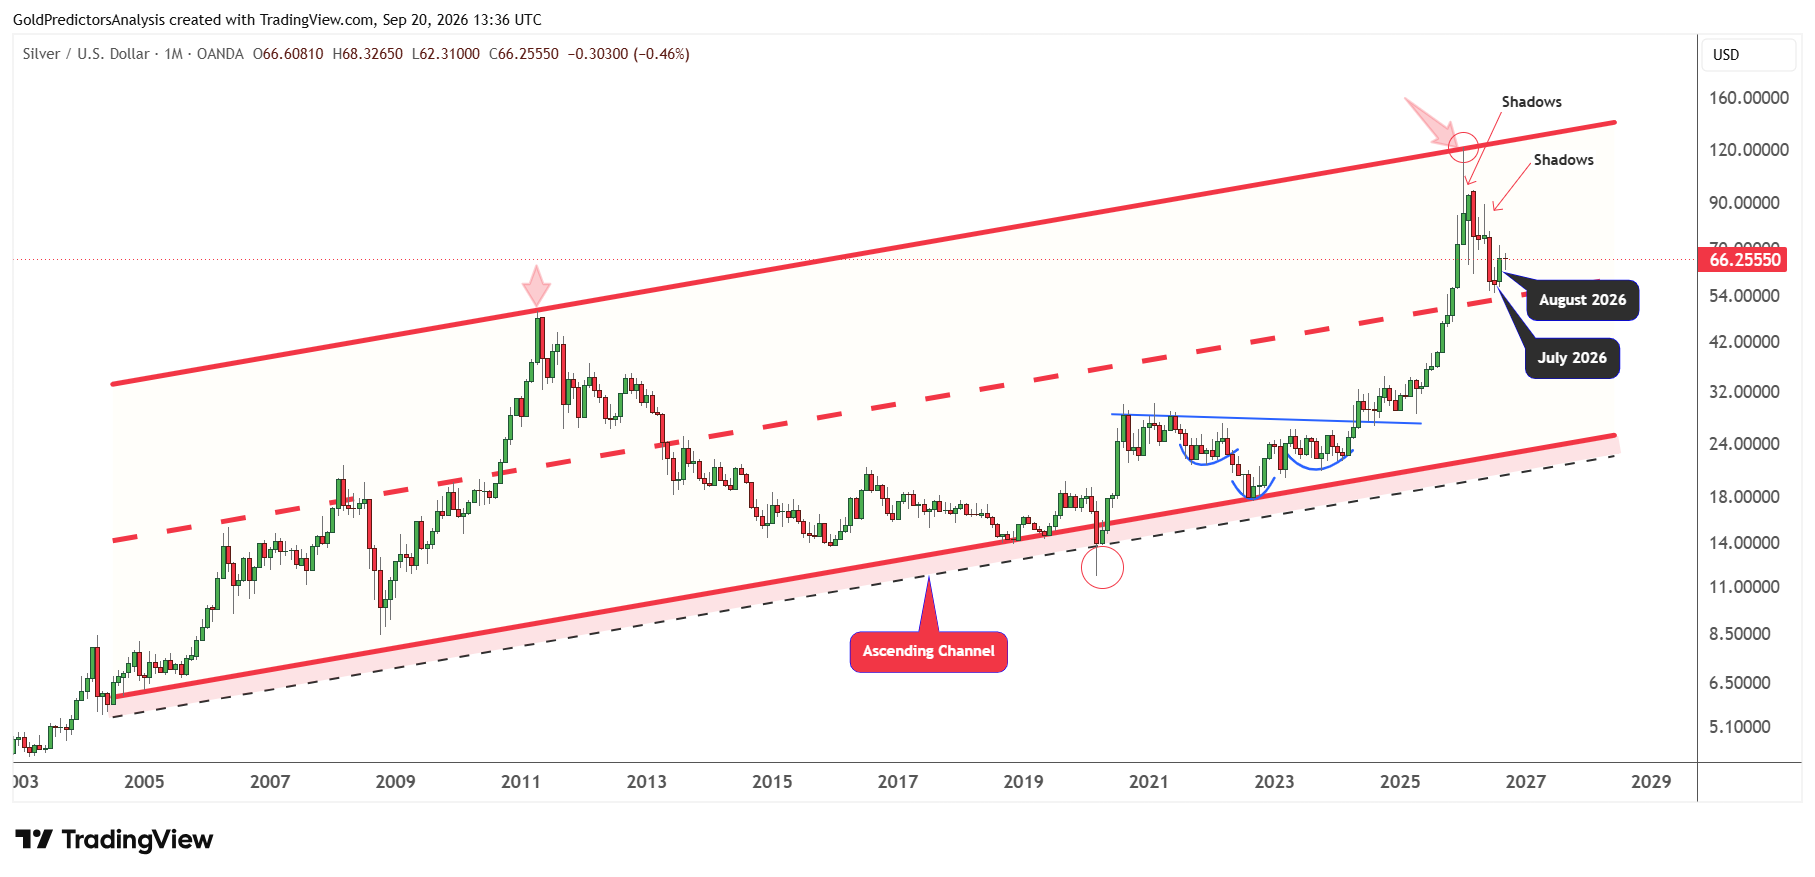
This support is seen at the midline of the ascending channel pattern, which helped trigger a rebound in August 2026.
The price is now approaching the key pivotal level around $72. A break above this area will likely push the rally further upward toward the $90 area. But a failure at the $50–$55 area will support further downside in the short term.
Overall, the price structure for silver remains bullish. Once this correction is over, the market will likely rally higher again toward the $150 area.
Falling Wedge Breakout Faces a Key Test at $72
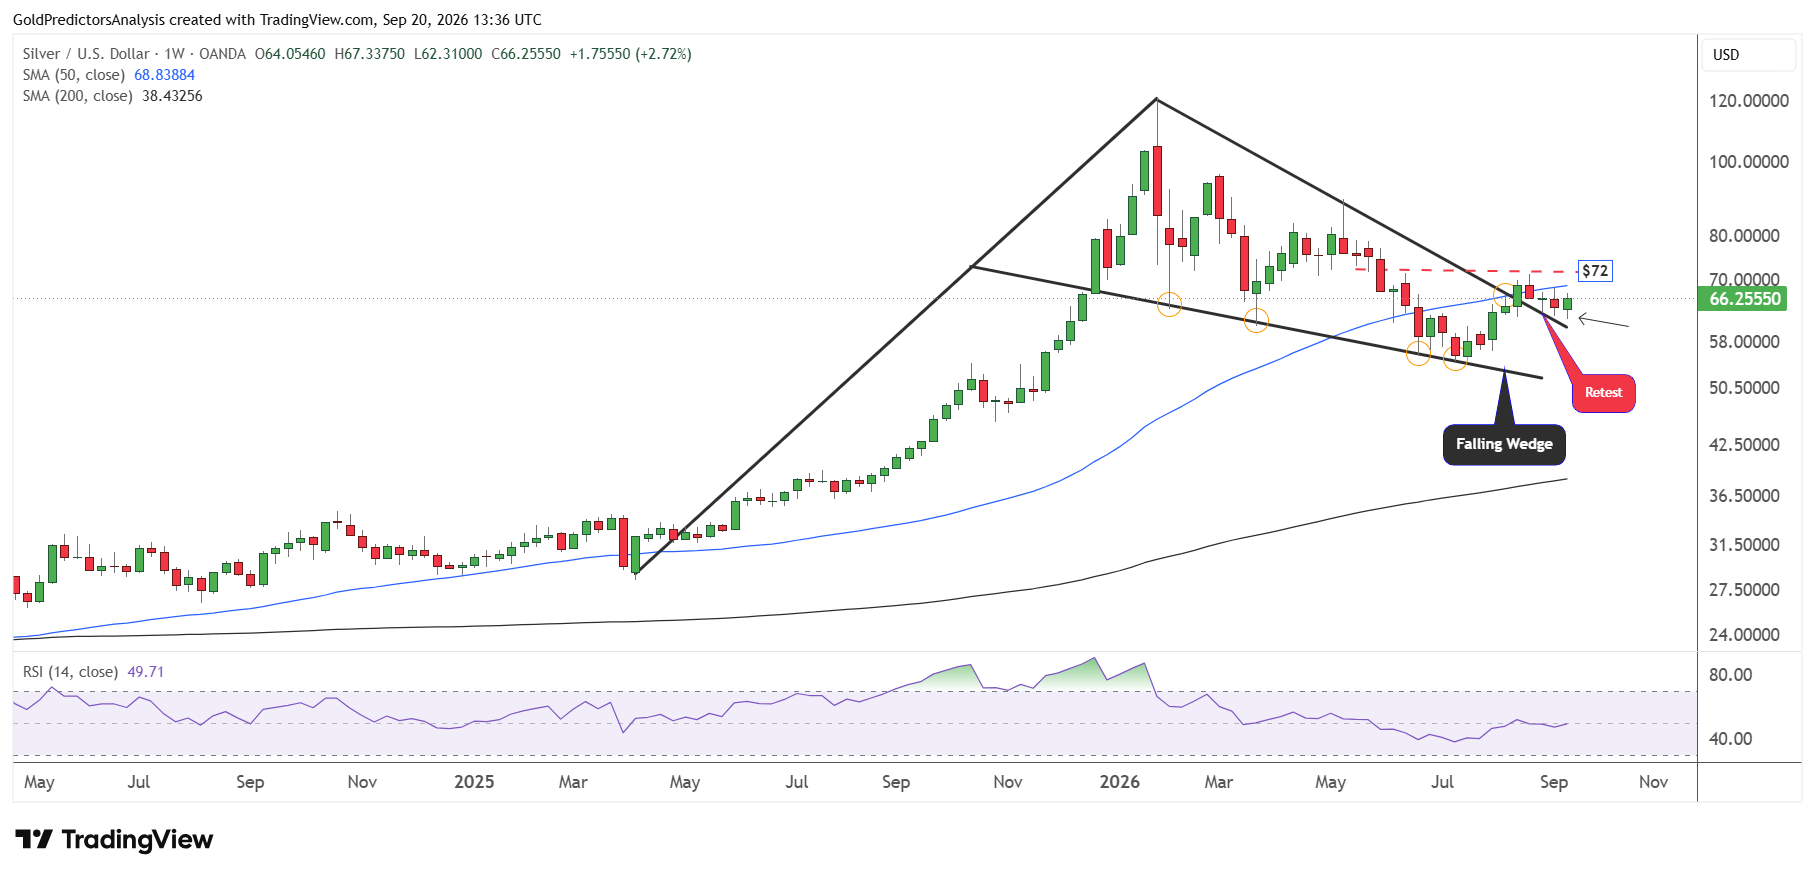
The weekly chart for spot silver also shows bullish price structure in the short term after the price breaks the falling wedge pattern.
After the breakout, silver has been consolidating within the $60-$72 area. The market needs to push above $72 to confirm the falling wedge pattern and trigger a strong move toward the $90 region. But a break below $60 will likely signal further downside toward the $55 area.
The RSI remains near the midline, which shows uncertainty in the short term. Therefore, a break below $60 in spot silver will invalidate the falling wedge pattern and indicate further downside. However, a break above $72 will indicate a strong upward move.
Bottom Line
Silver remains under pressure in the short term. The expectations of a Fed hike, a U.S. dollar index above 100 and the 10-year Treasury yield near 5% may limit the recovery in silver. The rebound in silver on Friday shows that buyers remain active but silver must break above $72 to confirm stronger rally. Until then, the price may continue to move between $60 and $72.
The silver structure in the long term remains bullish while the support zone between $50 and $55. A break above $72 could open the path toward $90 and later $150. But a break below $60 would increase the risk of a decline toward $55. In my view, the reaction of Treasury yields around 5% will determine whether silver resumes the long term rally or extends the correction.
Read more: Oil Pullback Eases Inflation Fears