Gold (XAU) and silver (XAG) rebounded on Thursday as pressure from oil and bond yields eased. Spot gold gained 1.83% on Thursday while spot silver gained 3.55%. The 10-year Treasury yield dropped to around 4.95% after moving above 5% earlier this week.
Oil prices also corrected for the third session as markets focused on alternative supply routes in the Middle East and signs that part of the East-West pipeline of Saudi Arabia could return within days. This decline eased some immediate fears of inflation and supported gold and silver prices.
But oil still remains above $100 as the regional tensions continue and the Fed has signaled more rate hikes may follow. In my view, gold and silver may remain volatile until Treasury yields remain elevated and the outlook for oil becomes more stable.

Gold Price Forecast: $4,530 Breakout Could Target $4,800
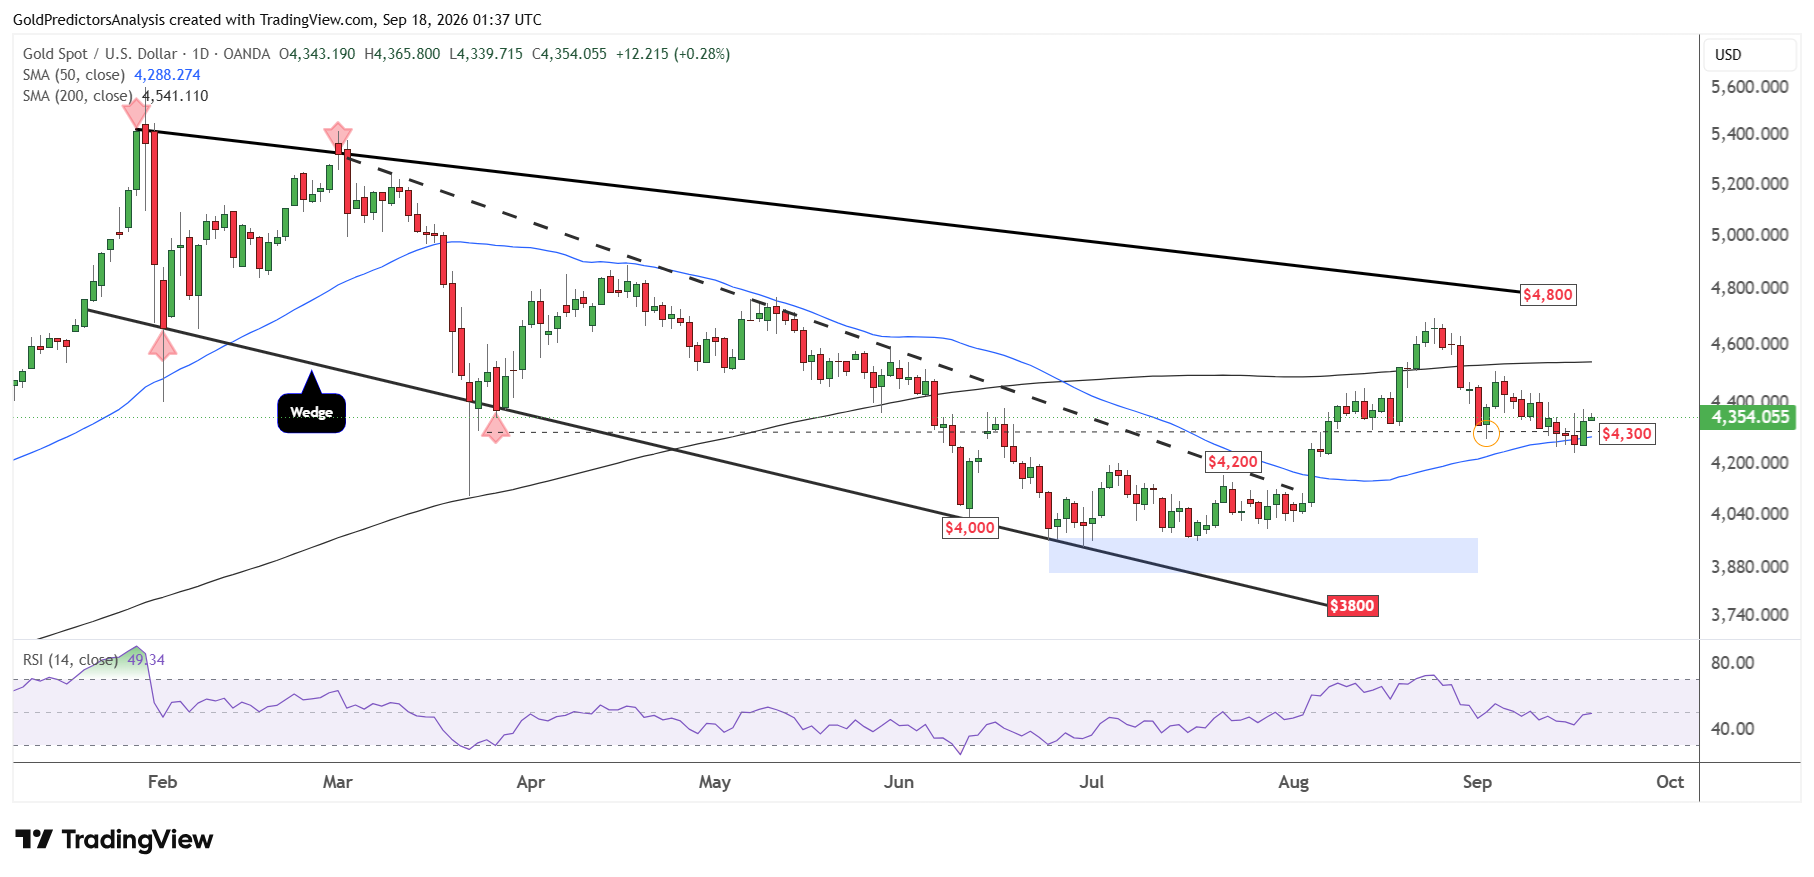
The daily chart for spot gold shows that the price rebounded on Thursday from the 50-day SMA near $4,270. But the RSI remains below the midline and the price is still weak until it can break above the $4,530 level. The price has been consolidating between the 50- and 200-day SMAs and needs breakout above these moving averages.
A break above $4,530 will push the price toward the $4,800 region. This level is defined by the descending trendline that stretches from the January 2026 highs. But a confirmed break below $4,270 will push the price toward the $4,000 region.
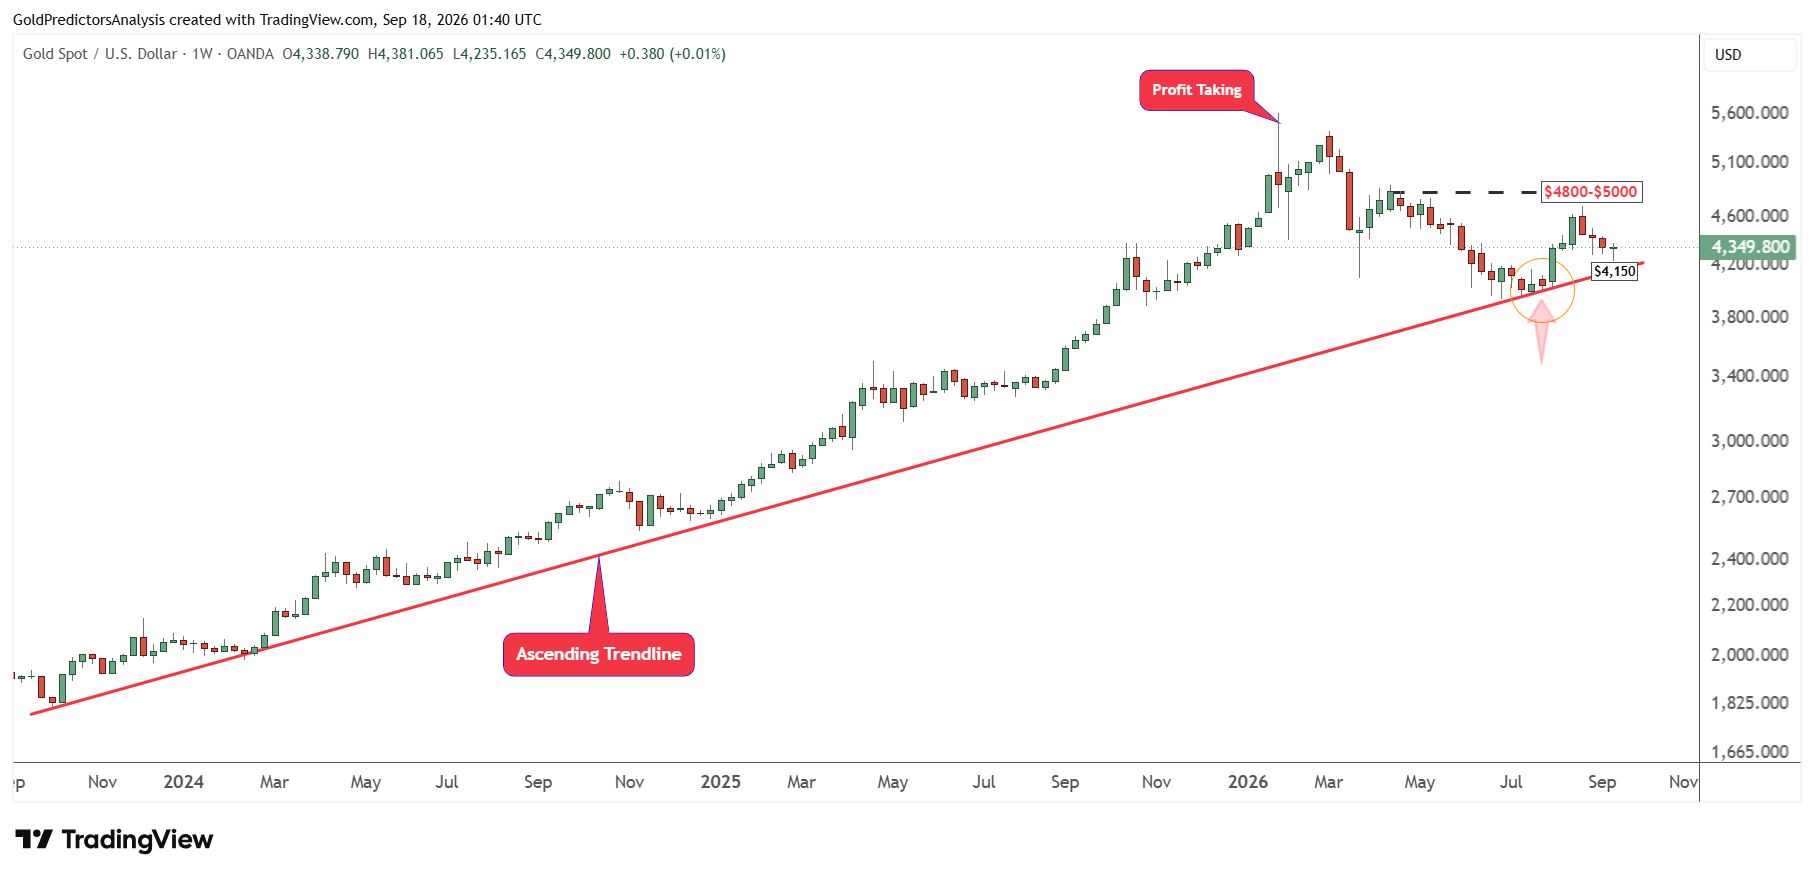
However, the weekly chart for spot gold shows constructive price action above the ascending trendline that stretches from the October 2023 lows. A confirmed break above $5,000 is required to initiate strong bullish momentum in the gold market. But a break below $4,150 will likely break the immediate trend and push gold prices lower.
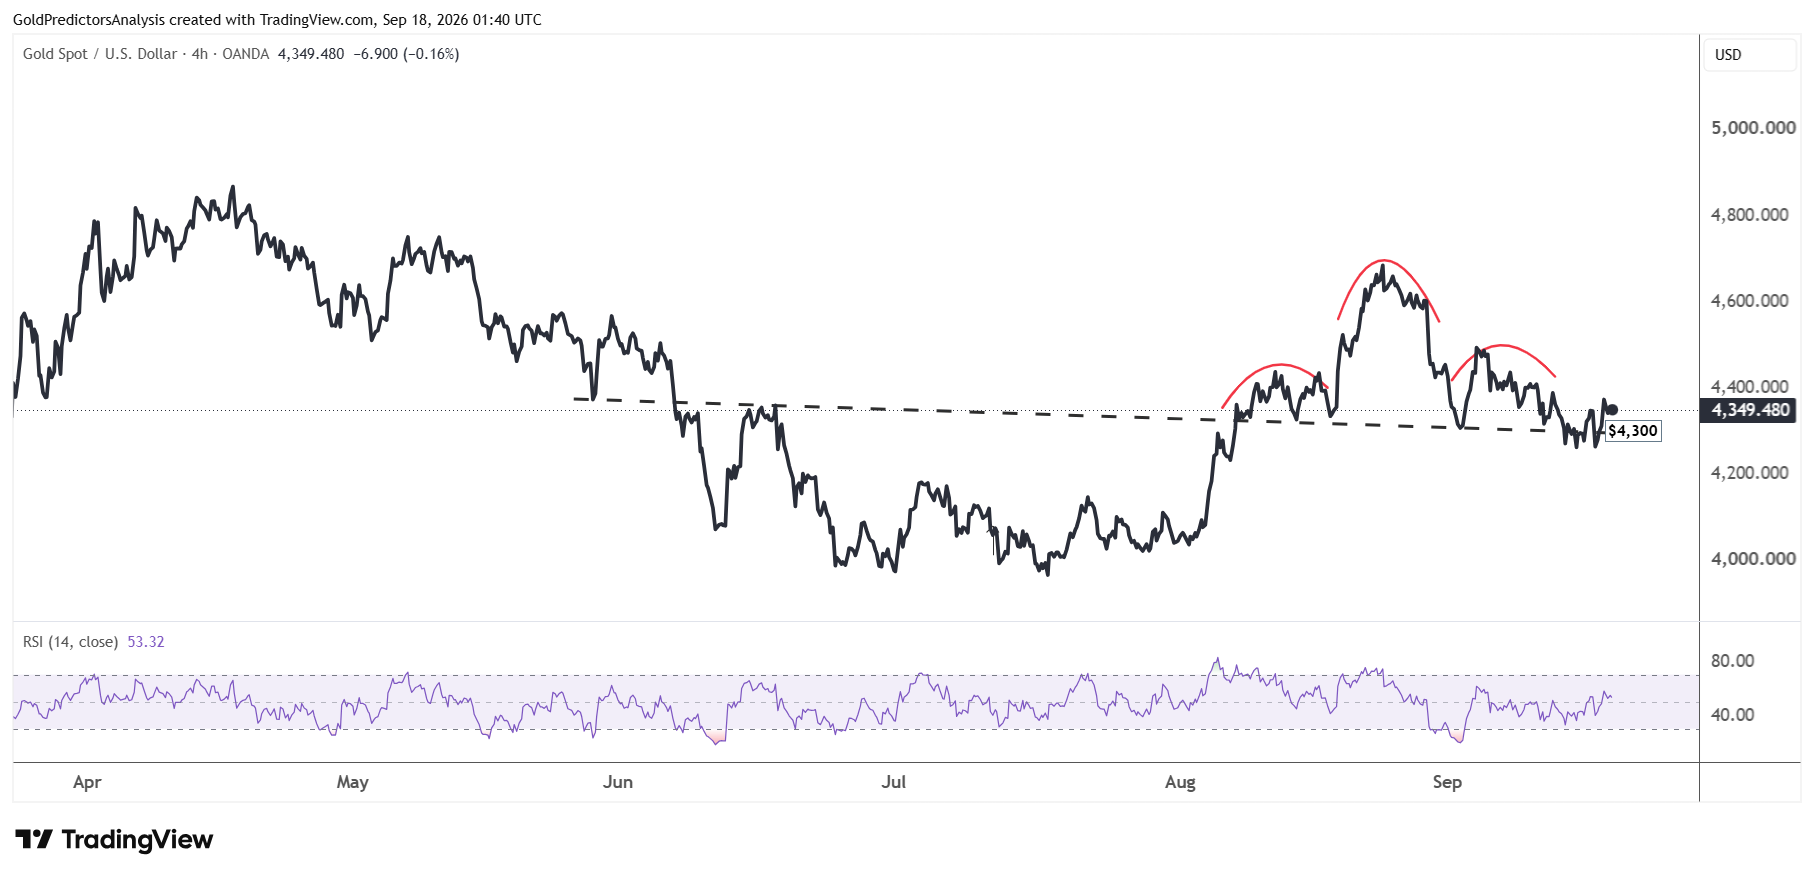
The 4-hour chart for spot gold also shows negative price action despite the strong rebound from support at $4,300. This bearish price action is seen in the inverted head and shoulders pattern that formed in August.
But a strong recovery above $4,530 will also erase this bearish development and push prices toward the $4,800 area. A break below $4,270 is required to open the way for further downside.
Gold Price Forecast
Every new Gold analysis as it publishes, today's technical signal and key levels, live price — on one page.
See all Gold forecastsSilver Price Forecast: $66 Breakout Brings $73 into Focus
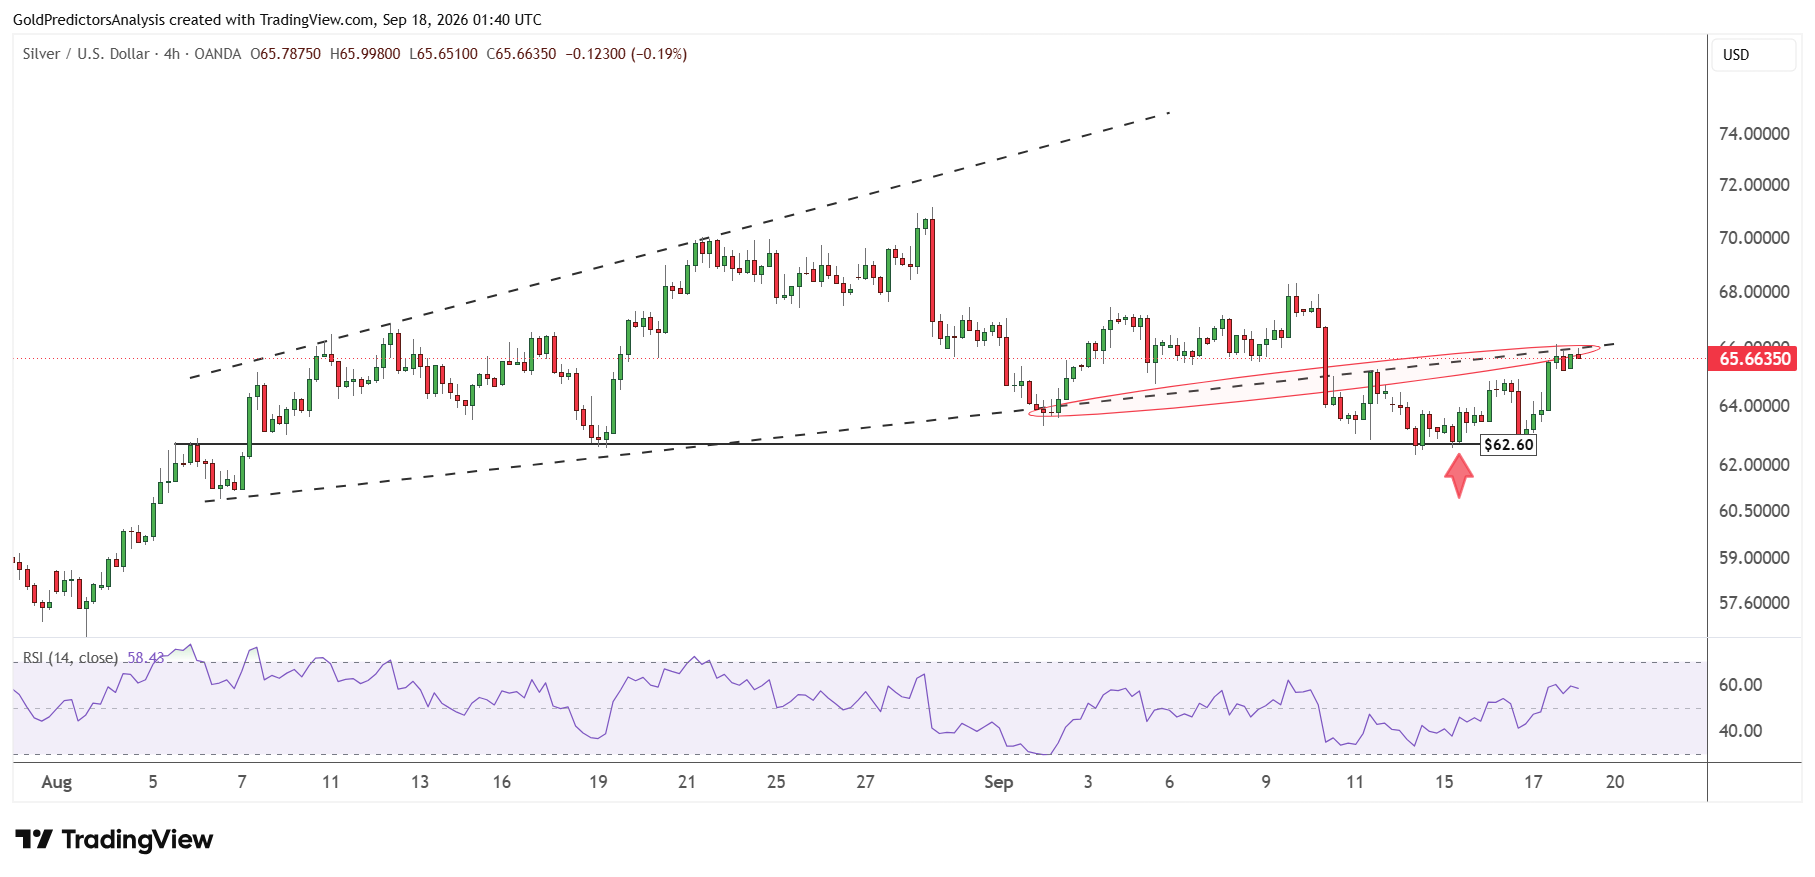
The daily chart for spot silver shows that the price rebounded on Thursday from the 50-day SMA, which is the key support in the spot silver market. Strong resistance is seen at the 200-day SMA near $73.
A break above this level will likely push prices towards the $89 area. The rebound in silver prices has also pushed the RSI above the midline, which keeps the outlook bullish in the short term.
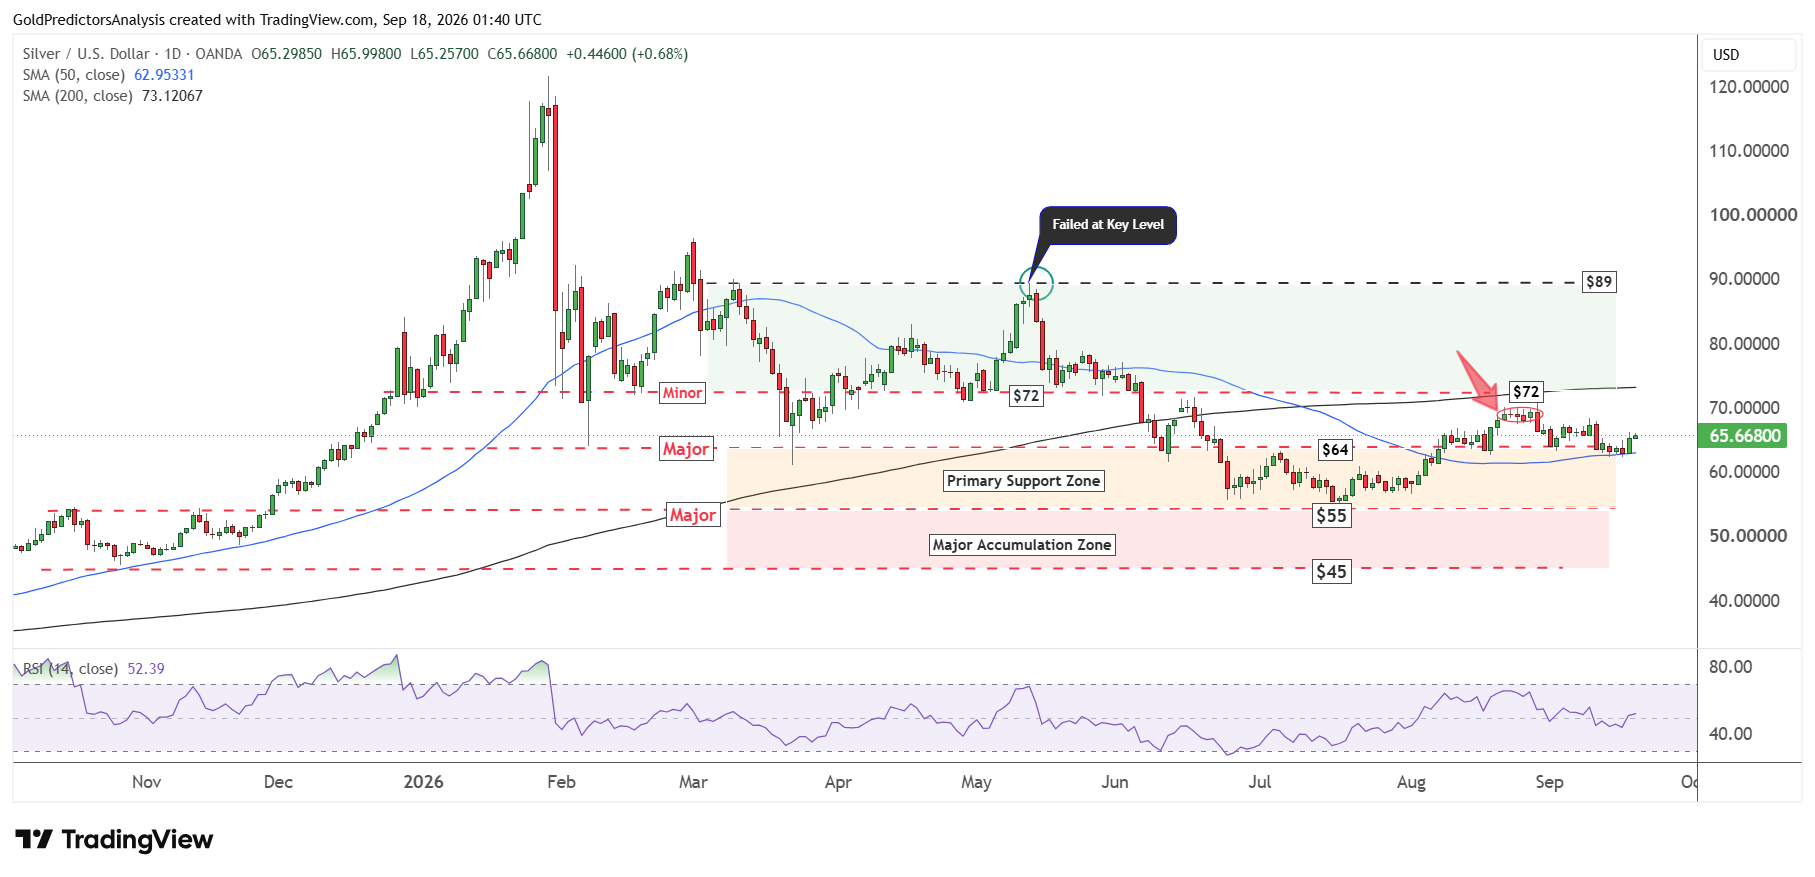
But a break below the 50-day SMA near $62 will likely open the way for further downside towards the $55 area. On the other hand, a break above $73 will push prices toward the next important level in the $89 region.
The 4-hour chart for spot silver shows the rebound from key support at $62.60 in the short term. The 50-day SMA also defines this support level. The price is now challenging immediate resistance in the $66 region. The black dotted trendline defines this resistance. A break above $66 will likely push prices towards the $68 area. A break above $68 will likely open the way for a strong rally toward the $72-$73 region.
What to Watch Next
Gold and silver recovered from support at $4,270 as oil prices and Treasury yields eased from the resistance levels. But the rebound in gold still needs confirmation. Gold must break above $4,530 to strengthen the recovery but a break below $4,270 could expose the $4,000 region.
Silver presents strong momentum in the short term but the price must break above $73 to extend the rally. A break below $62 would weaken the outlook and open the way towards $55.
In my view, both metals may remain volatile as oil is still above $100 and the Fed may raise rates again. The correction in oil prices and Treasury yields may support further gains in precious metals, but the strength in oil market could bring sellers back.
Read more: Fed Hike and 5% Treasury Yields Test Gold Recovery