20-Day Average Faces Pressure
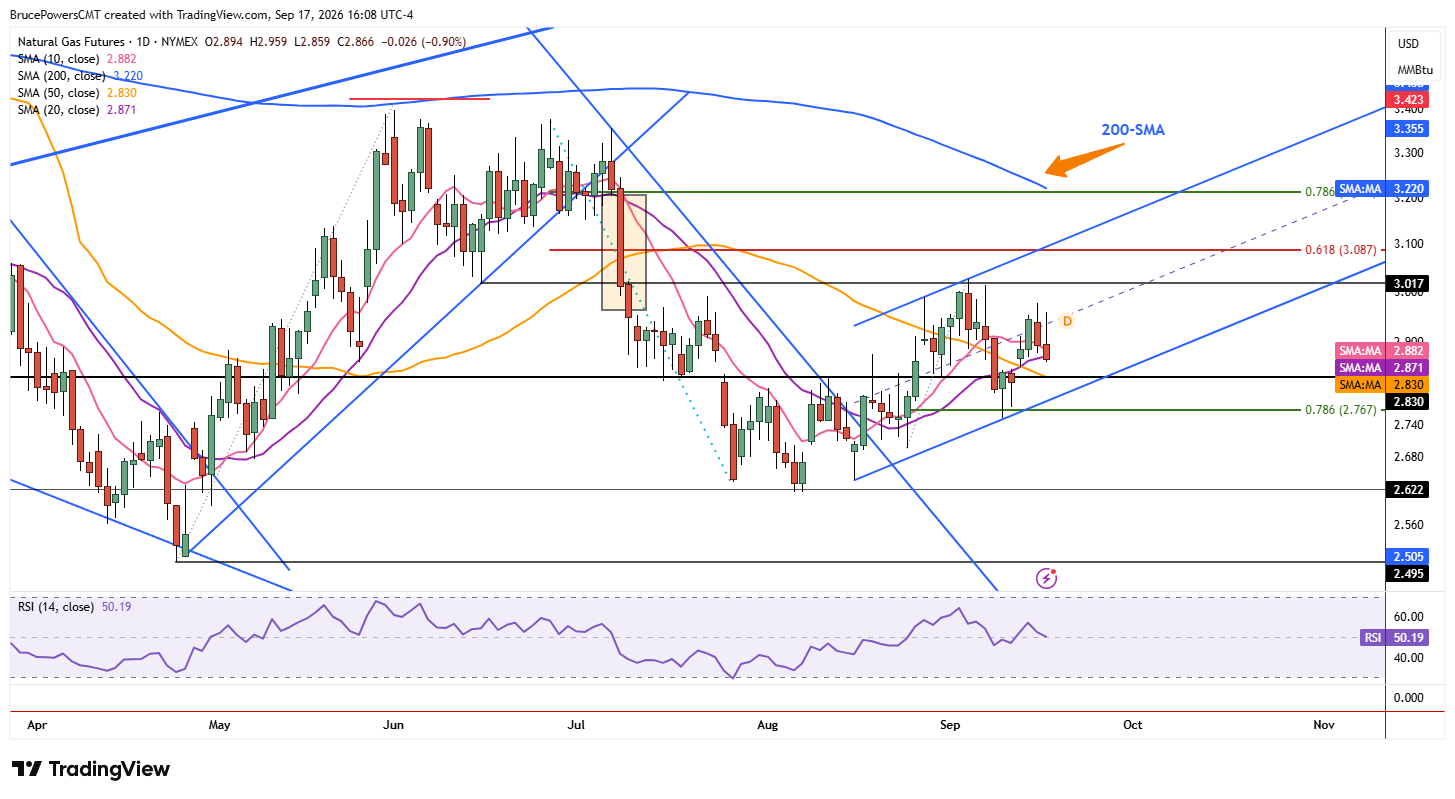
Short-term weakening in natural gas continued Thursday, with a retest of support at the 20-day moving average occurring with a three-day low of $2.86. However, downward pressure continued at the time of writing, with natural gas still trading near the lows of the day. This suggests that the 20-day moving average may break, potentially targeting support near the 50-day moving average, currently near $2.83 and falling. A sustained break below the 20-day average would therefore increase the likelihood of a deeper pullback within the larger bullish structure.

Rising Channel Defines Bigger Picture
The larger bullish pattern that is unfolding is a rising trend channel. Both the upper and lower channel boundaries have been confirmed by two points, supporting the validity of the structure. The lower boundary of the pattern becomes a potential downside target if there is a sustained break below the 20-day moving average. Since the 50-day moving average is falling it could be near the lower boundary line when approached by price, assisting in identifying a particular price level. That potential confluence could make the lower channel boundary an important area to watch if selling pressure increases.
Resistance Levels Map Next Advance
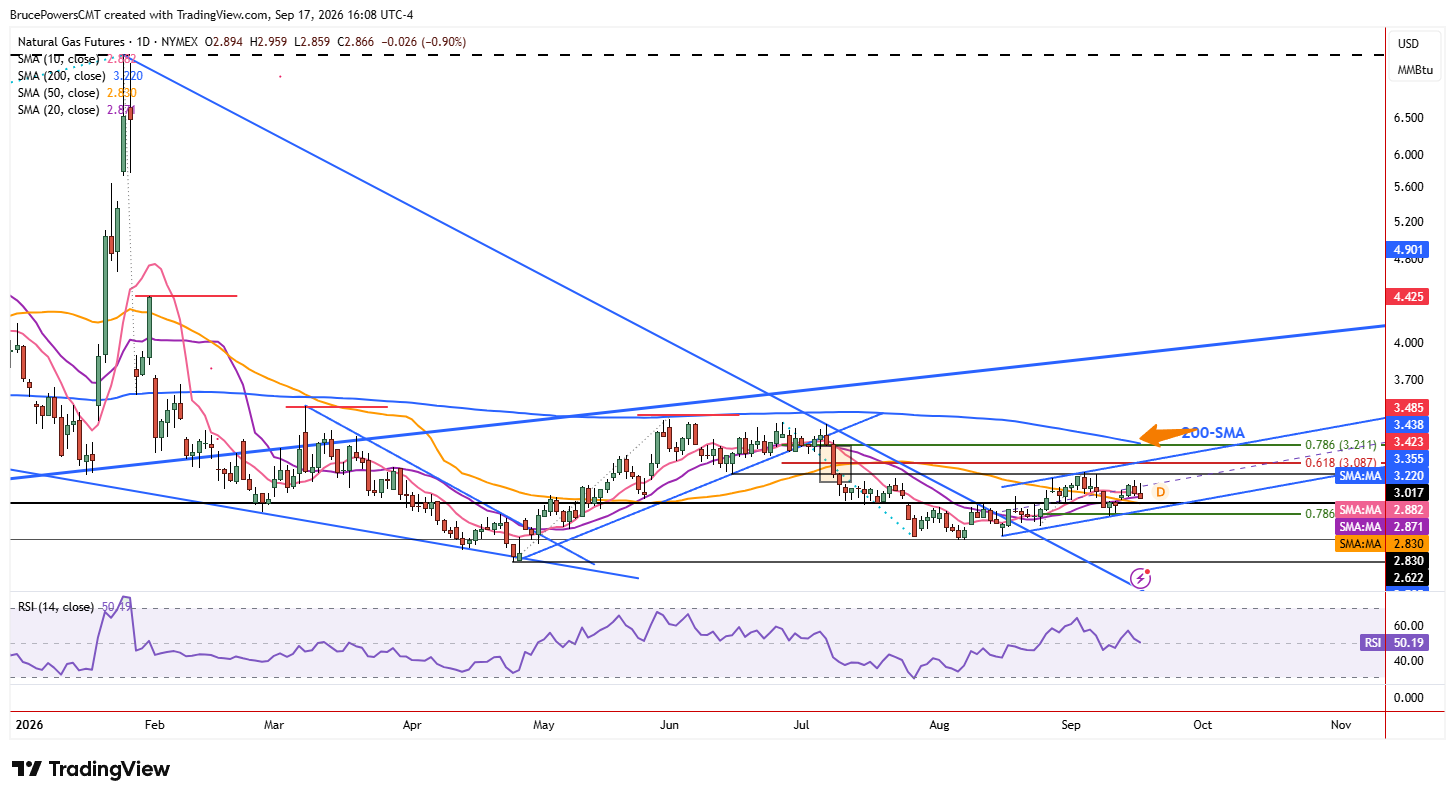
If support holds and is followed by strength, the first upside target will be this week’s lower swing high of $2.98, followed by the recent high of $3.03. Higher up is the 61.8% Fibonacci retracement at $3.09 and the 78.6% Fibonacci retracement at $3.21. However, the 200-day moving average provides another potential upside target. Currently at $3.22 and falling, it will soon fall below the 78.6% retracement level, thereby lowering the potential upside target for natural gas.
Bullish Structure Remains in Focus
This week’s bullish reversal from the lower boundary of the rising channel suggests an eventual upside target near the top boundary of the pattern. That does not mean the target will necessarily be reached, but it does suggest that the developing advance has a good chance of eventually reaching and exceeding the $3.03 high on the way to the 61.8% Fibonacci retracement zone. Consequently, the current weakness may ultimately prove to be a pullback within the larger bullish structure, potentially setting the stage for the next decisive upswing toward higher targets.
If you’d like to know more about how to trade natural gas, please visit our educational area.