Gold Rallies on Oil and Yield Reversal, Not a Softer Fed
The Fed did not give gold anything Wednesday. Warsh raised rates, kept inflation at the center of the decision and left another hike on the table. Gold rallied Thursday anyway because the trade that had been hitting it all week came apart on its own.
Oil dropped for a second session. The 10-year pulled back from 5%. The dollar gave back Wednesday’s gain. Those three moves opened the door at the same time and gold buyers did not hesitate. The metal is up more than 2% on a day when the fundamental story has not changed. The conditions around it have.
At 19:27 GMT, Spot Gold (XAUUSD) is trading $4,347.32, up $83.47 or +1.96%. The session high is $4,381.07 and the low is $4,257.60.
Daily Spot Gold (XAUUSD) Technical Analysis
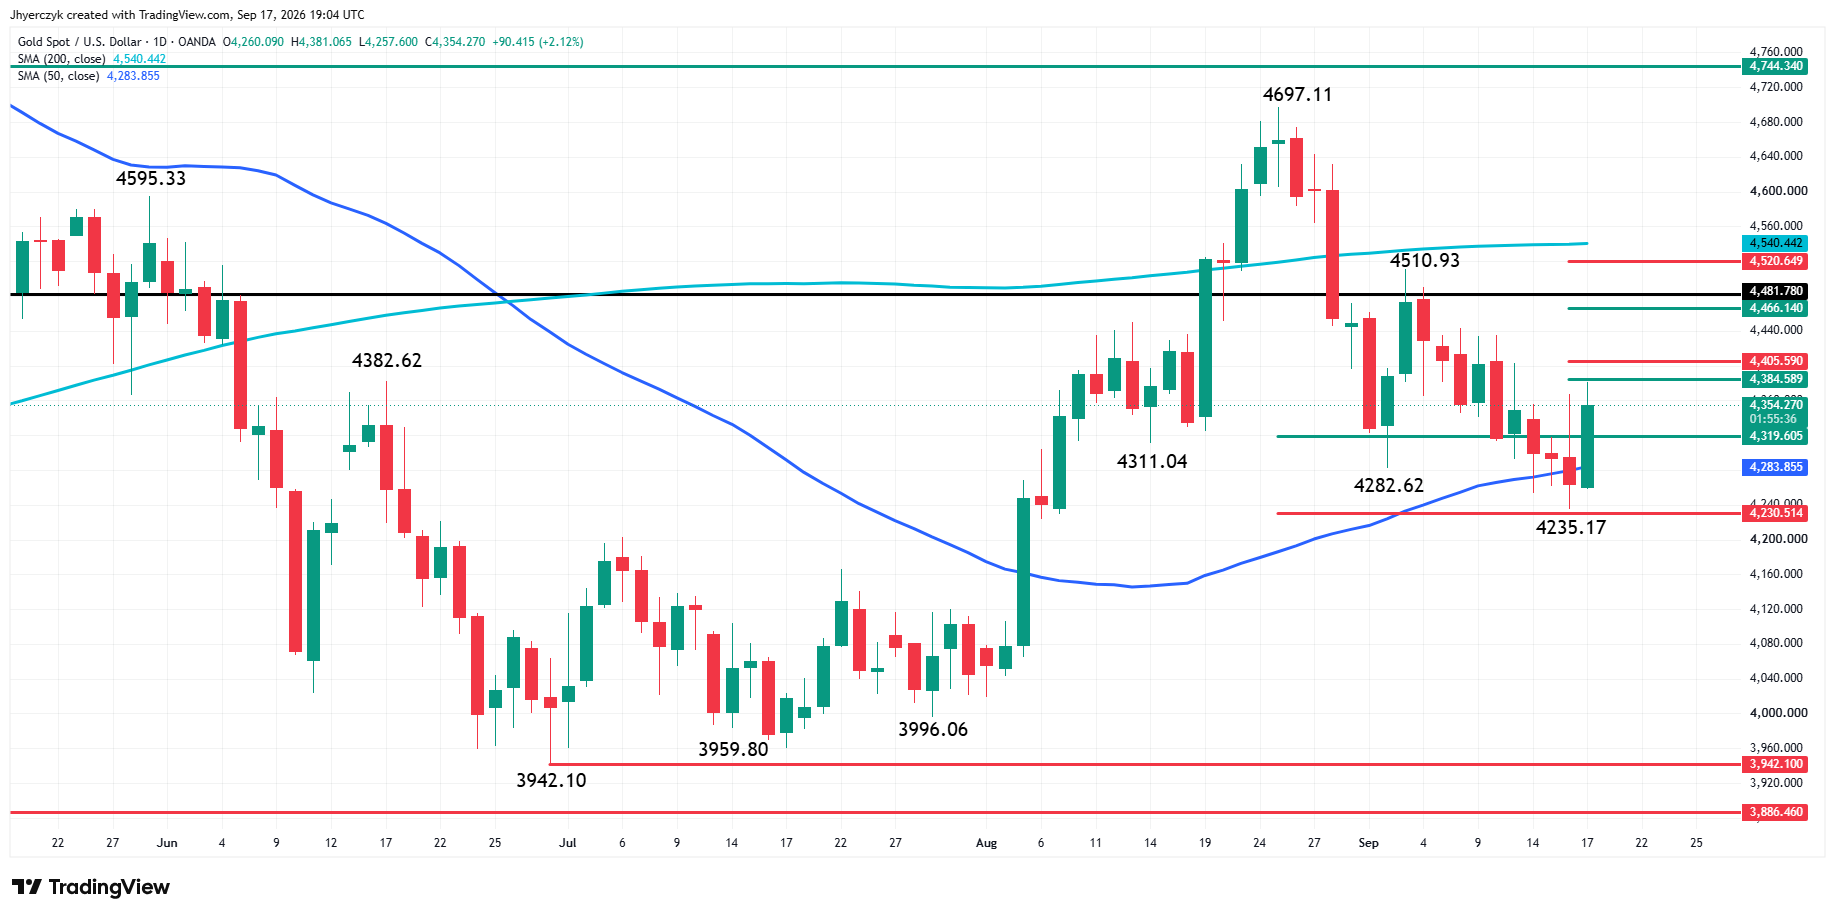
Spot Gold is trading sharply higher late Thursday after finding support inside the retracement zone at $4,319.61 to $4,230.51 and overtaking the 50-day moving average at $4,283.86 and the 50% level at $4,319.61.
The surge sent the market into a minor retracement zone at $4,384.59 to $4,405.59.
The main trend is still down according to the daily swing chart. A trade through $4,235.17 will reaffirm the downtrend. Taking out $4,510.93 will change the main trend to up.
On the upside, overtaking $4,405.59 sets up a move into the retracement zone at $4,466.14 to $4,520.65 with the 200-day moving average at $4,540.45 above it.
Gold Price Forecast
Every new Gold analysis as it publishes, today's technical signal and key levels, live price — on one page.
See all Gold forecastsOil Broke and Gold Moved
Crude fell for a second session as Saudi Arabia pushed more barrels through Oman and traders pulled back from the most aggressive Middle East disruption bets. Brent dropped toward the low $100s after testing near $110 earlier in the week. That reversal in crude mattered for gold because oil had been the fuel behind the yield and dollar rally that was grinding the metal lower since Monday.
Thursday’s low at $4,257.60 came first. Buyers showed up at the 50-day moving average and pushed XAUUSD more than $120 off the session bottom. The dollar index fell 0.2% to 100.07 after gaining 0.7% Wednesday. The 10-year yield dropped five basis points to 4.945%. Gold moved because all three forces that had been holding it down let go on the same day. That does not happen often and the $89 rally shows what happens when it does.
The Dot Plot Says the Fed Is Not Finished
Warsh raised the target range to 3.75%-4.00% Wednesday. The dot plot was the harder message. Sixteen of 18 officials projected at least one more increase. Four saw room for two additional hikes. That is not a committee ready to stand pat after one adjustment.
Initial claims at 196,000, below the 207,000 estimate, gave Warsh no reason to soften the outlook. The labor market is not cracking. Housing is starting to feel it. August building permits fell 2.7% to an annualized 1.394 million and starts dropped 2.6% to 1.275 million. Both missed. The rate-sensitive corner of the economy is showing cracks while the jobs market refuses to cooperate.
Gold is trading between those two realities Thursday. The metal is rallying because the oil and yield trade loosened. The Fed’s stance has not loosened with it. Sixteen dots pointing higher is a ceiling that one day of lower yields does not remove.
The Dollar Retreat Came After Its Best Day in Three Months
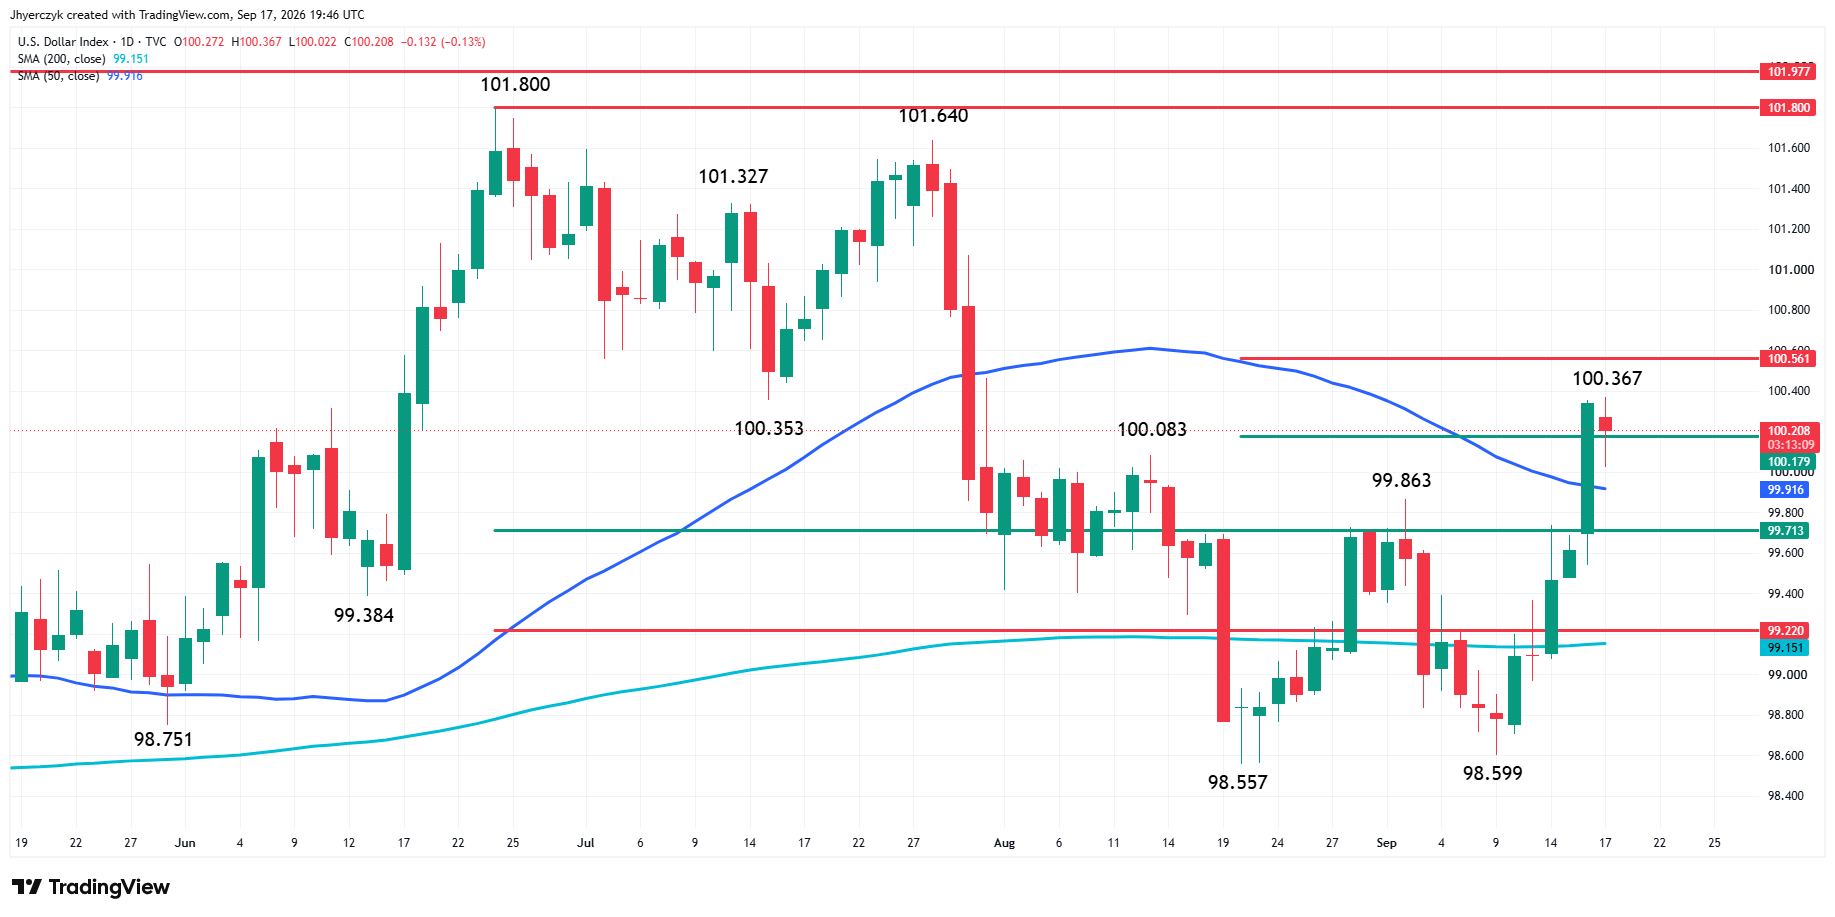
Wednesday’s dollar rally was the largest one-day advance in three months. Thursday took some of that back. The dollar weakened against the euro and yen as yields eased with the oil price. The move gave gold the room it needed for the short-covering rally to build into something larger.
The retreat is still a correction inside a stronger weekly trend. The dollar index is about 1.4% higher than a week ago. A one-day pullback fueled a sharp gold rally. A renewed dollar push would put the rate trade back in front and send attention right back to the downside levels.
The Bank of Japan Is the Next Rate Test
The Bank of England held rates unchanged Thursday. The Bank of Japan is expected to raise Friday to a 31-year high. That decision runs through the yen, global bond yields and the dollar. A hawkish BOJ supports the yen and adds pressure to the greenback. That would extend gold’s relief trade into the weekend. A less aggressive message gives the dollar another reason to firm after Thursday’s pullback and gold loses the currency tailwind that drove today’s rally. Friday is not a neutral calendar day for the metal.
What to Watch
The Fed raised rates and sixteen dots point to more tightening. That has not changed. What changed Thursday is that oil, the dollar and yields all reversed at the same time and gold ran $120 off its low in a single session. The question going into Friday is whether the conditions that produced that rally hold through the BOJ decision or whether crude and the dollar firm back up and take the relief trade away. Gold does not need the Fed to turn dovish. It needs the oil-driven inflation trade to stop feeding yields and the dollar. Thursday gave buyers one day of that. Friday tests whether they get a second.
The bias leans bearish with the main trend down on the daily swing chart, however, Thursday’s rally from $4,257.60 through the 50-day moving average at $4,283.86 and the 50% level at $4,319.61 has weakened the bearish setup considerably.
The minor retracement zone at $4,384.59 to $4,405.59 is where the rally stalled Thursday and a sustained push through $4,405.59 would open the door to $4,466.14 to $4,520.65 with the 200-day moving average at $4,540.45 sitting at the top of that range. That is the level that changes the conversation from short-covering to trend reversal.
On the downside, a move back under $4,319.61 puts the 50-day and the $4,235.17 bottom back in play and tells traders Thursday was a one-day event driven by an oil pullback, not the start of a real recovery.
If you’d like to know more about how to trade gold, please visit our educational area.