


Emerging Strength Within Consolidation
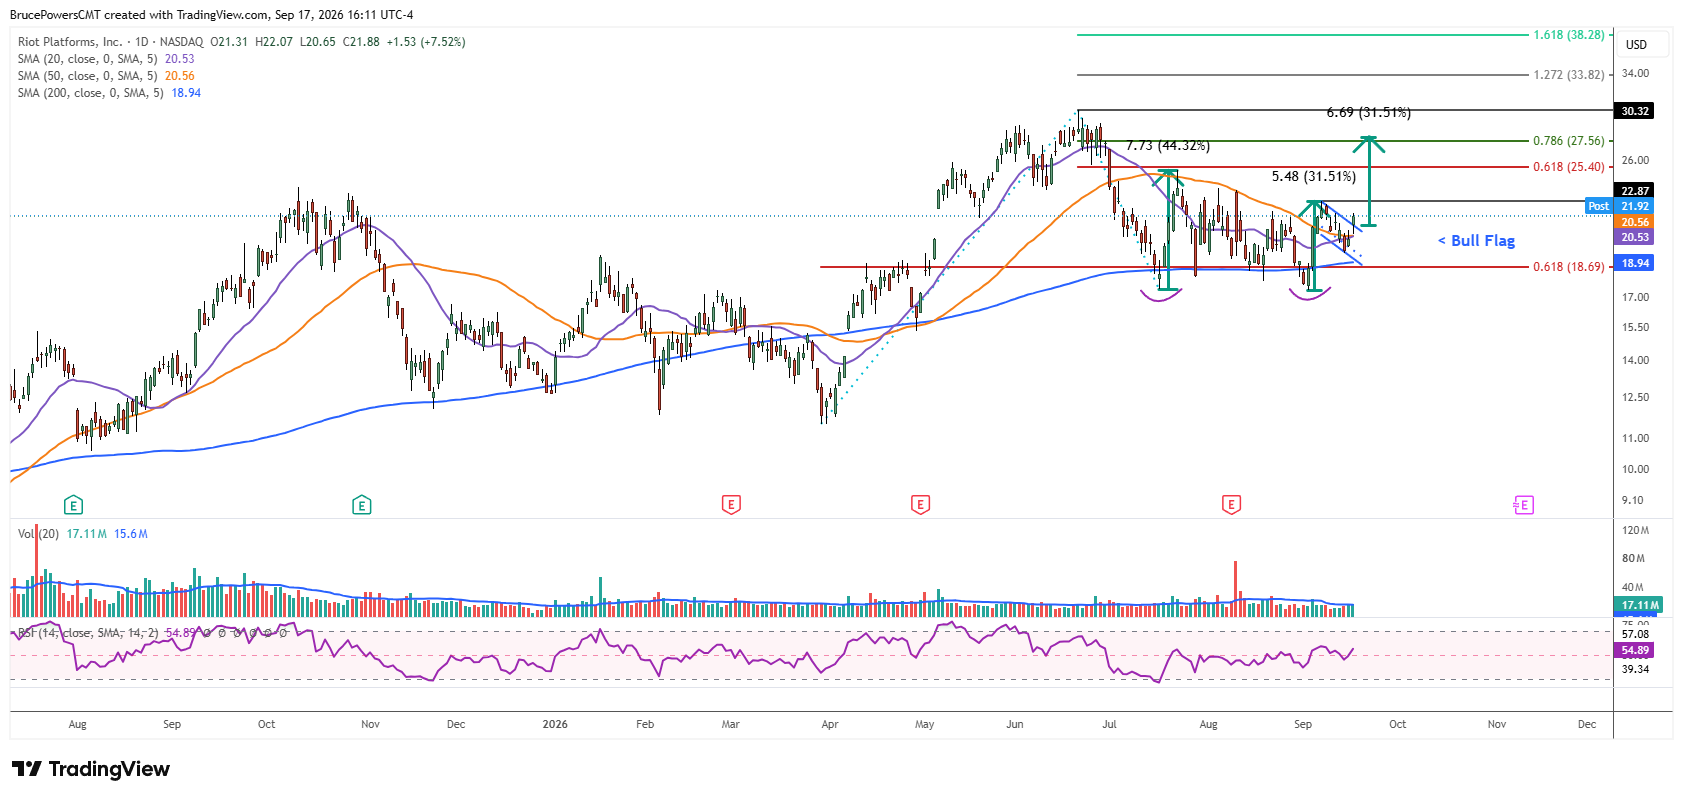
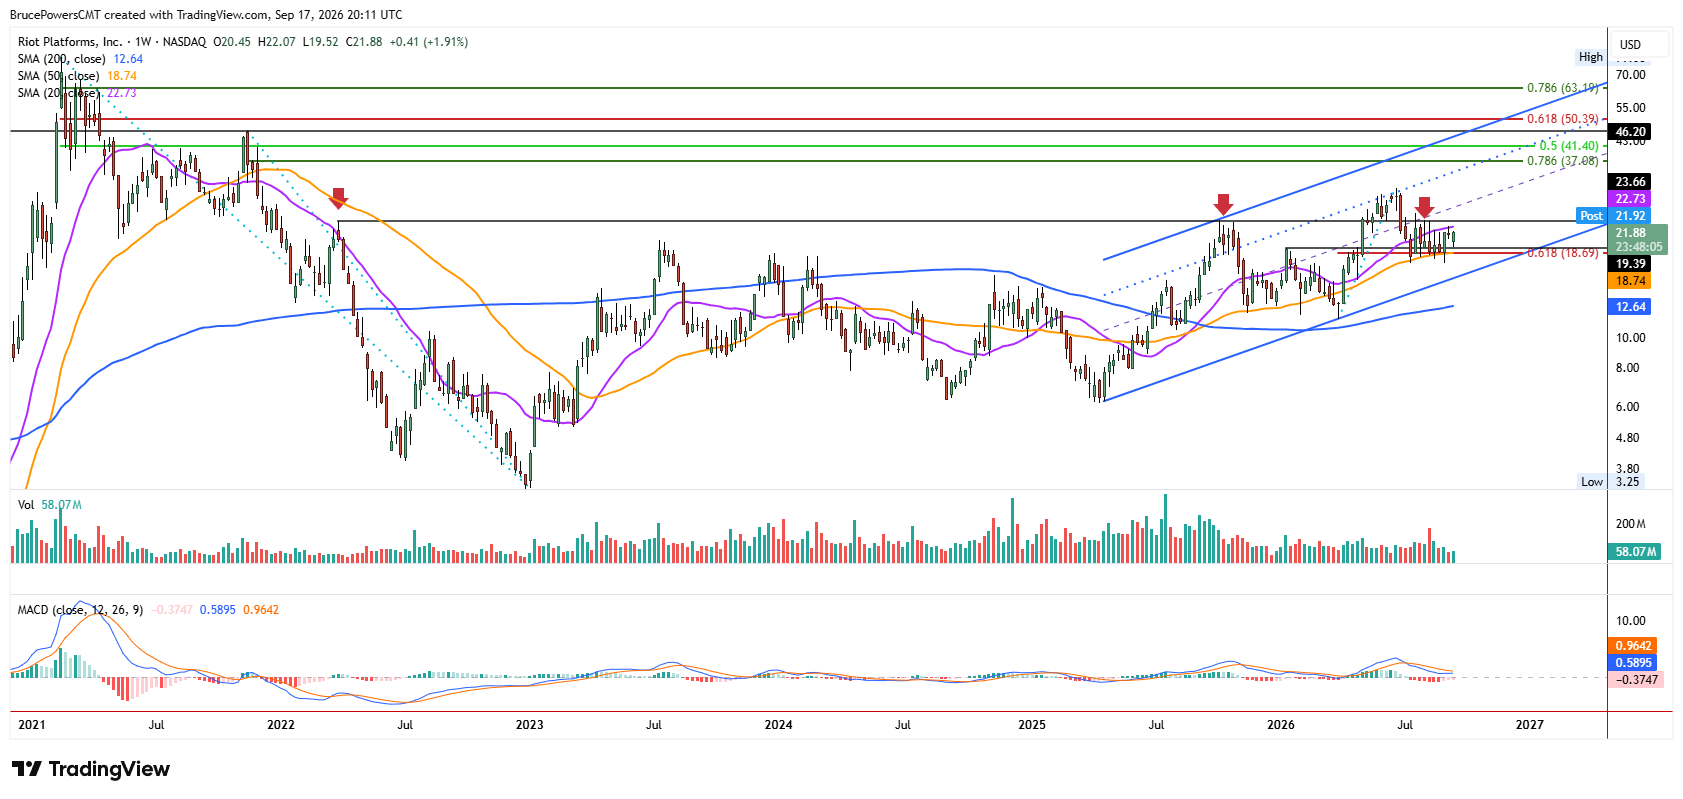
Although shares of Riot Platforms, Inc. (RIOT), a U.S.-based Bitcoin mining and digital infrastructure company, have been consolidating for around 10 weeks, the daily chart shows signs that strength may be emerging within the larger weekly consolidation structure. The breakout of a small bullish flag pattern triggered on Thursday, while price action also confirmed resistance at the convergence of two key moving averages. Both the 20-day and 50-day moving averages were reclaimed two weeks ago, resulting in a high of $22.87 last week, before a pullback developed into a bullish flag formation.

200-Day Moving Average Holds Significance
The pattern is bullish since its formation followed a relatively sharp four-day advance that began with a failed break below the 200-day moving average before a second low of $17.39 was subsequently established in early September. This price behavior around the 200-day moving average is similar to what occurred during the formation of the earlier mid-July low of $17.44.
There was a one-day close below the average before buyers regained control the following day, leading to a sharp advance of a little more than 44%. Similarly, after the recent retest of support near the 200-day moving average was completed, buyers regained control and drove a rally through a range of potential resistance, resulting in an advance of around 31.5%.
50-Day Average Shifts to Support
Strong support has been indicated near the lows since July, followed by a bullish pattern that formed after a sharp rally. During the advance, the 50-day moving average was reclaimed and has now been confirmed as support. The 50-day moving average had represented dynamic resistance for most of the recent bearish correction, making its successful reclaim and subsequent support test potentially significant. This shift suggests that underlying strength may be improving.
Breakout Levels Point Higher
If that switch from resistance to support continues to hold, the trend may be positioned to extend higher. The flag breakout also confirms that assessment. A bullish continuation signal would be triggered above the recent high and top of the flag at $22.87. An approximate measuring objective from the flag points to the $27.85 area, which is reinforced by the nearby 78.6% Fibonacci retracement of the prior decline.
Notably, the first rally from the bottom in July found resistance near the 61.8% Fibonacci retracement zone. Therefore, a sustained move above $22.87 would provide an important confirmation that the recent strengthening within the larger consolidation is beginning to translate into a broader advance.
If you’d like to know more about technical analysis and how traders use it, please visit our educational area.


