Falling Wedge Takes Shape
Gold further confirmed the formation of a potential falling bullish wedge on Thursday, establishing a higher daily low of $4,257 and rallying to a four-day high of $4,381. The advance triggered a rise above two key dynamic resistance indicators, including the downtrend line and the 10-day moving average, which is near $4,346. Although the recovery of those indicators is not set to be confirmed with a close above the levels, the higher daily low, positive performance for the session, and likely close in the top third of the day’s range show that buyers remain in control in the short-term.
That could lead to confirmation of the falling wedge with a decisive breakout above $4,381. Such a breakout would provide an important confirmation of the developing bullish structure and signal that the recent consolidation may be ending.

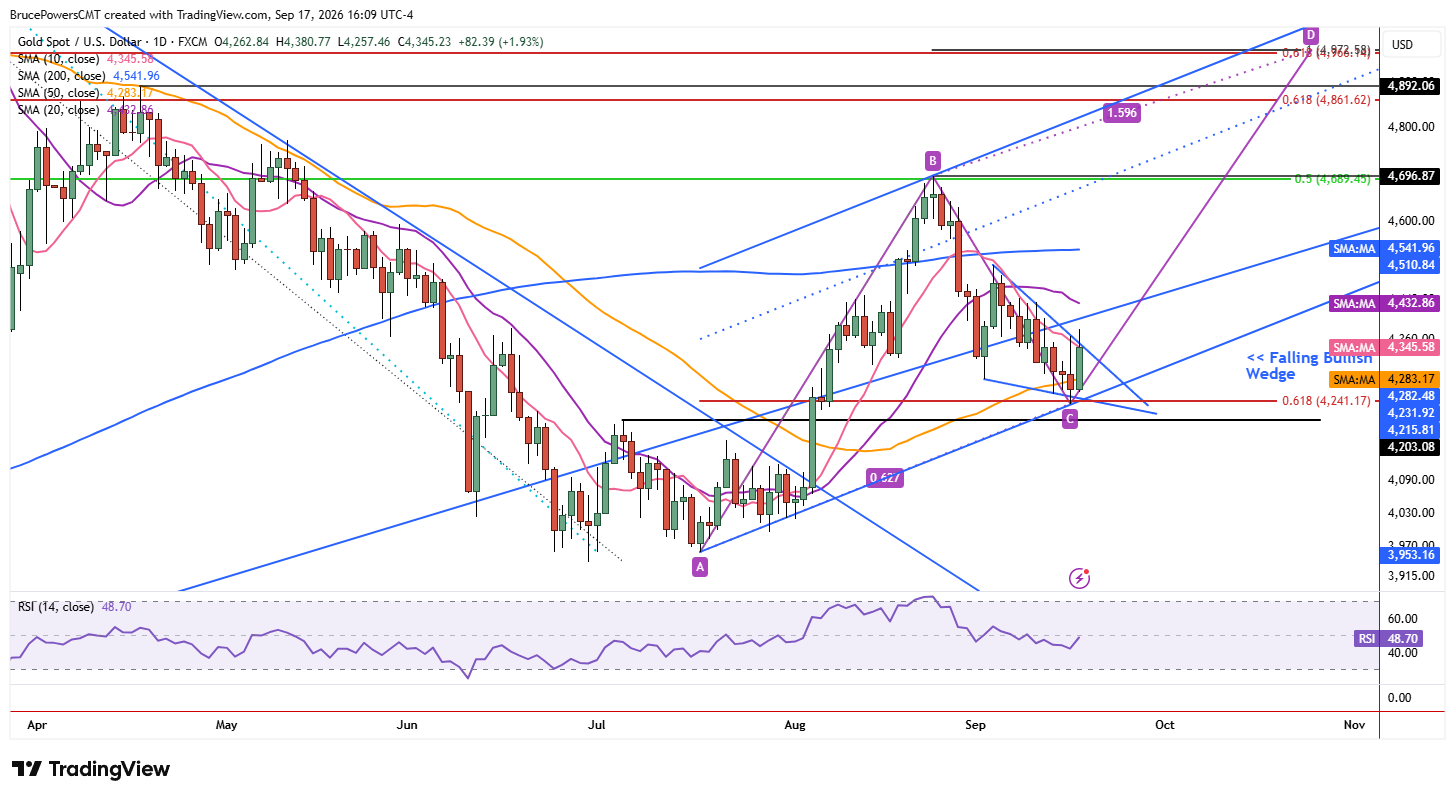
Support Confluence Preserves Bullish Setup
The formation of the falling wedge has occurred following a test of a support zone defined by the confluence of the 61.8% Fibonacci retracement of the prior advance and the 50-day moving average. This is a good example of why key price levels should be watched as price areas or zones. A higher daily low has now been established following Wednesday’s low of $4,235, identifying key structure support, while the 50-day moving average defines dynamic support, near $4,281 currently. The ability to hold above this support zone has helped preserve the developing bullish setup.
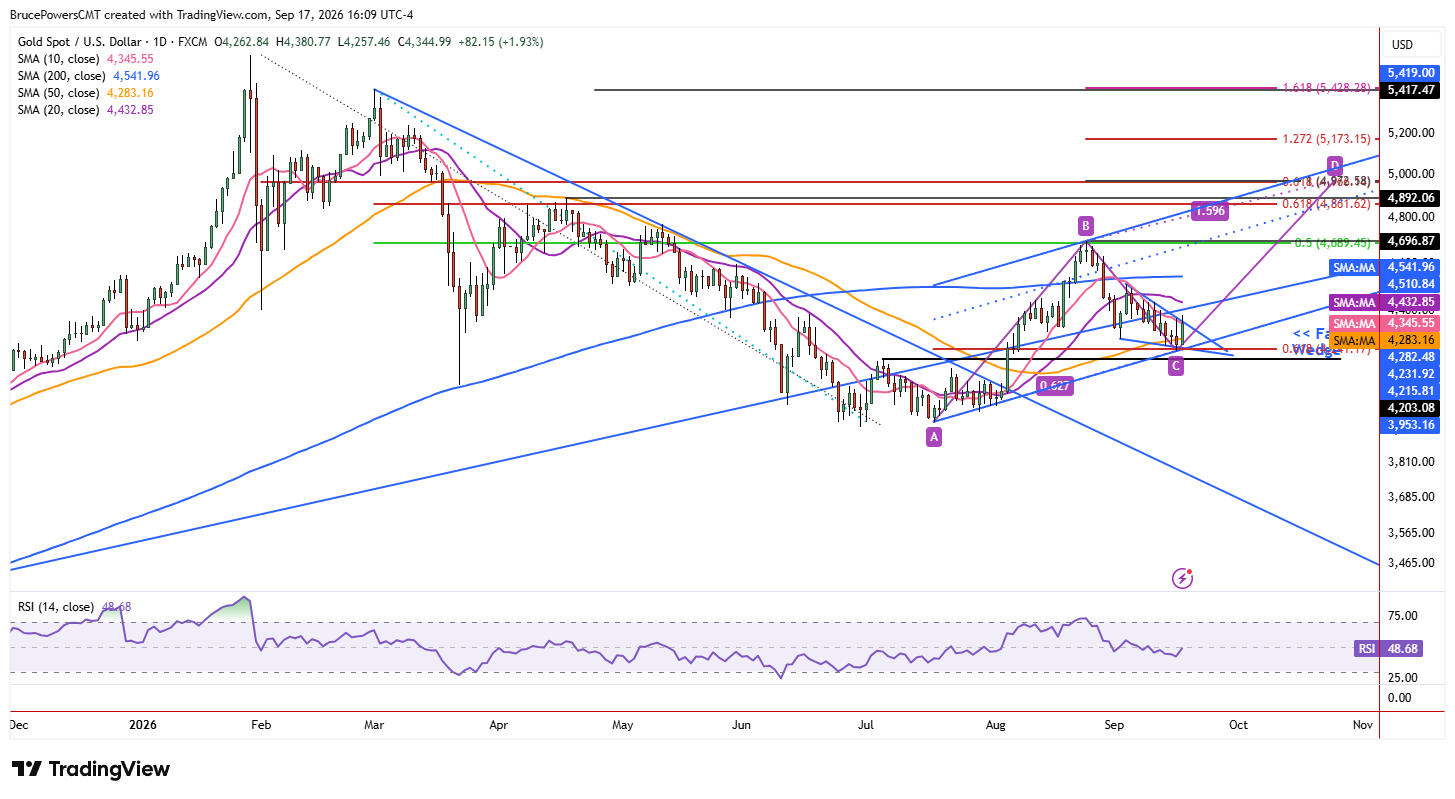
$4,381 Breakout Opens Next Leg
A decisive advance above $4,381 will signal a breakout of the wedge pattern and a reclaim of the 10-day moving average, along with the downtrend line. That would also signal the possible beginning of the next leg up in the advance that began in early August and the progression of a rising ABCD pattern. When there is price symmetry between the two upswings, a potential resistance level is identified. That occurs at $4,973. The significance of that potential upside target is supported by the 61.8% Fibonacci retracement of the full prior decline at $4,966. The close alignment of these two levels creates a potentially significant resistance zone near $4,966-$4,973.
Moving Average Holds Key
If strength follows, the 50-day moving average will be confirmed as support after it had marked dynamic resistance until the August 5 rally. Once the first pullback to that key indicator confirms its role as a support level, the developing bullish trend should be ready to proceed. For now, the $4,235-$4,281 area defines important underlying support, while a decisive move above $4,381 would provide the next confirmation that the falling wedge is resolving higher.
If you’d like to know more about how to trade gold and silver, please visit our educational area.