Gold Drops on a Rate Problem War Headlines Cannot Fix
Bombs hit Riyadh over the weekend. Gold opened Monday and went down anyway. Three central banks raised rates in eight days and Minneapolis Fed President Neel Kashkari called inflation broad-based Sunday. The safe-haven bid showed up on the dip and got sold into before it could do anything. That is weeks of the same failed trade. The August high was the top. Every rally since has stalled and been sold.
At 07:07 GMT, Spot Gold is trading $4,354.74, down $23.65 or -0.54%.

Daily Spot Gold Technical Analysis
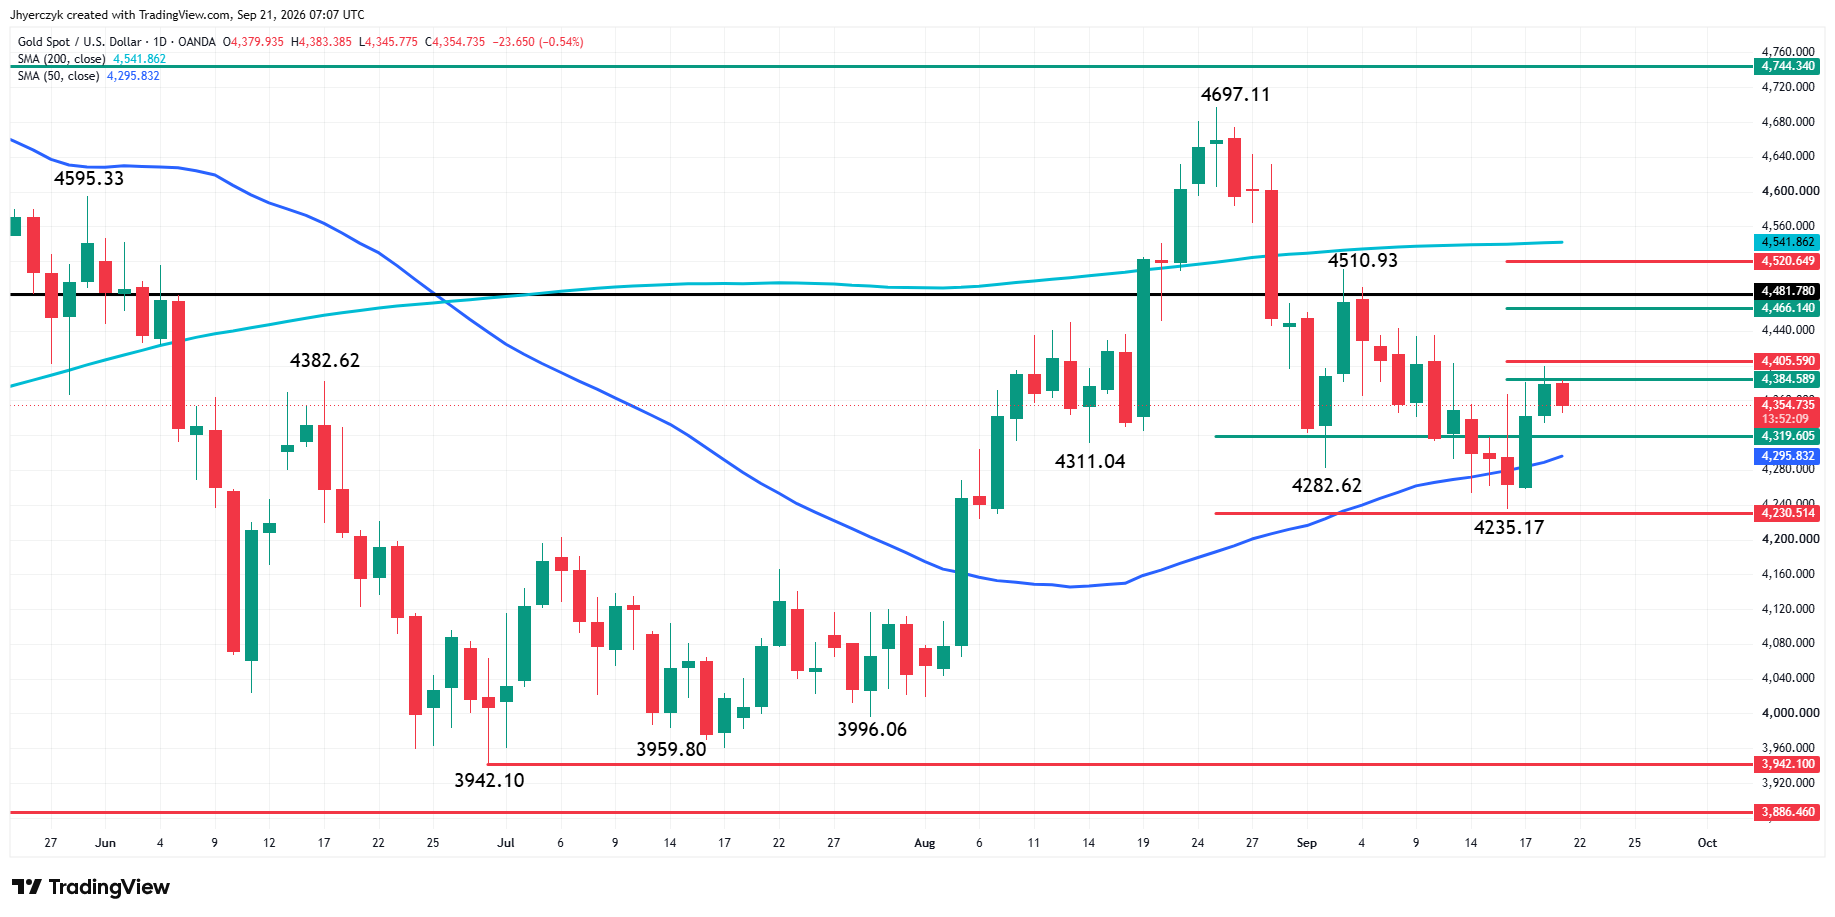
Spot Gold is trading above the 50-day moving average at $4,295.83 and below the 200-day moving average at $4,541.86.
The main trend is down on the daily swing chart. Gold posted a lower high at $4,510.93 after the $4,697.11 top and broke to a lower low at $4,235.17. The current recovery stalled below $4,384.59.
Resistance is $4,384.59, followed by $4,405.59, the $4,466.14 to $4,481.78 zone, and $4,510.93.
Support is $4,319.61, the 50-day moving average at $4,295.83, and $4,282.62. Below that, the $4,235.17 to $4,230.51 area.
Gold Price Forecast
Every new Gold analysis as it publishes, today's technical signal and key levels, live price — on one page.
See all Gold forecastsKashkari Shut the Door Before Gold Could Get Through It
The Fed raised last week. The ECB the week before. The Bank of Japan on Friday. Gold sold into every one of them. The case for a pause needed the Fed to acknowledge that inflation was cooling somewhere. Kashkari went the other direction Sunday. Inflation is too high across the economy, not just in energy. That was the one argument the doves had left and Kashkari took it away.
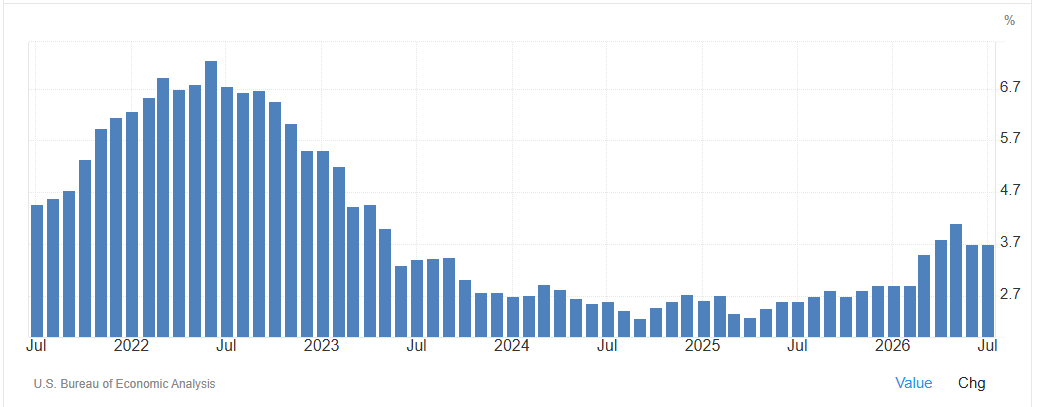
Policymakers project at least one more rate increase this year. Rate futures have another hike priced by mid-2027. The cuts gold was trading in the spring keep getting pushed further out. Monday was supposed to be a war-premium session after the Riyadh strike. It turned into another rate session and gold has been losing that trade since August.
The August top happened when the market still believed the Fed was finished. Weeks later the Fed is still going and gold is still stuck between the moving averages with no momentum in either direction. Kashkari was not the only hawk talking Sunday but he was the one who took the energy argument away from the rate-cut camp. The next data print either confirms what he said or gives the doves something to push back with. Gold is sitting and waiting for that answer.
Oil Gave Gold a Chance Monday and Nothing Happened
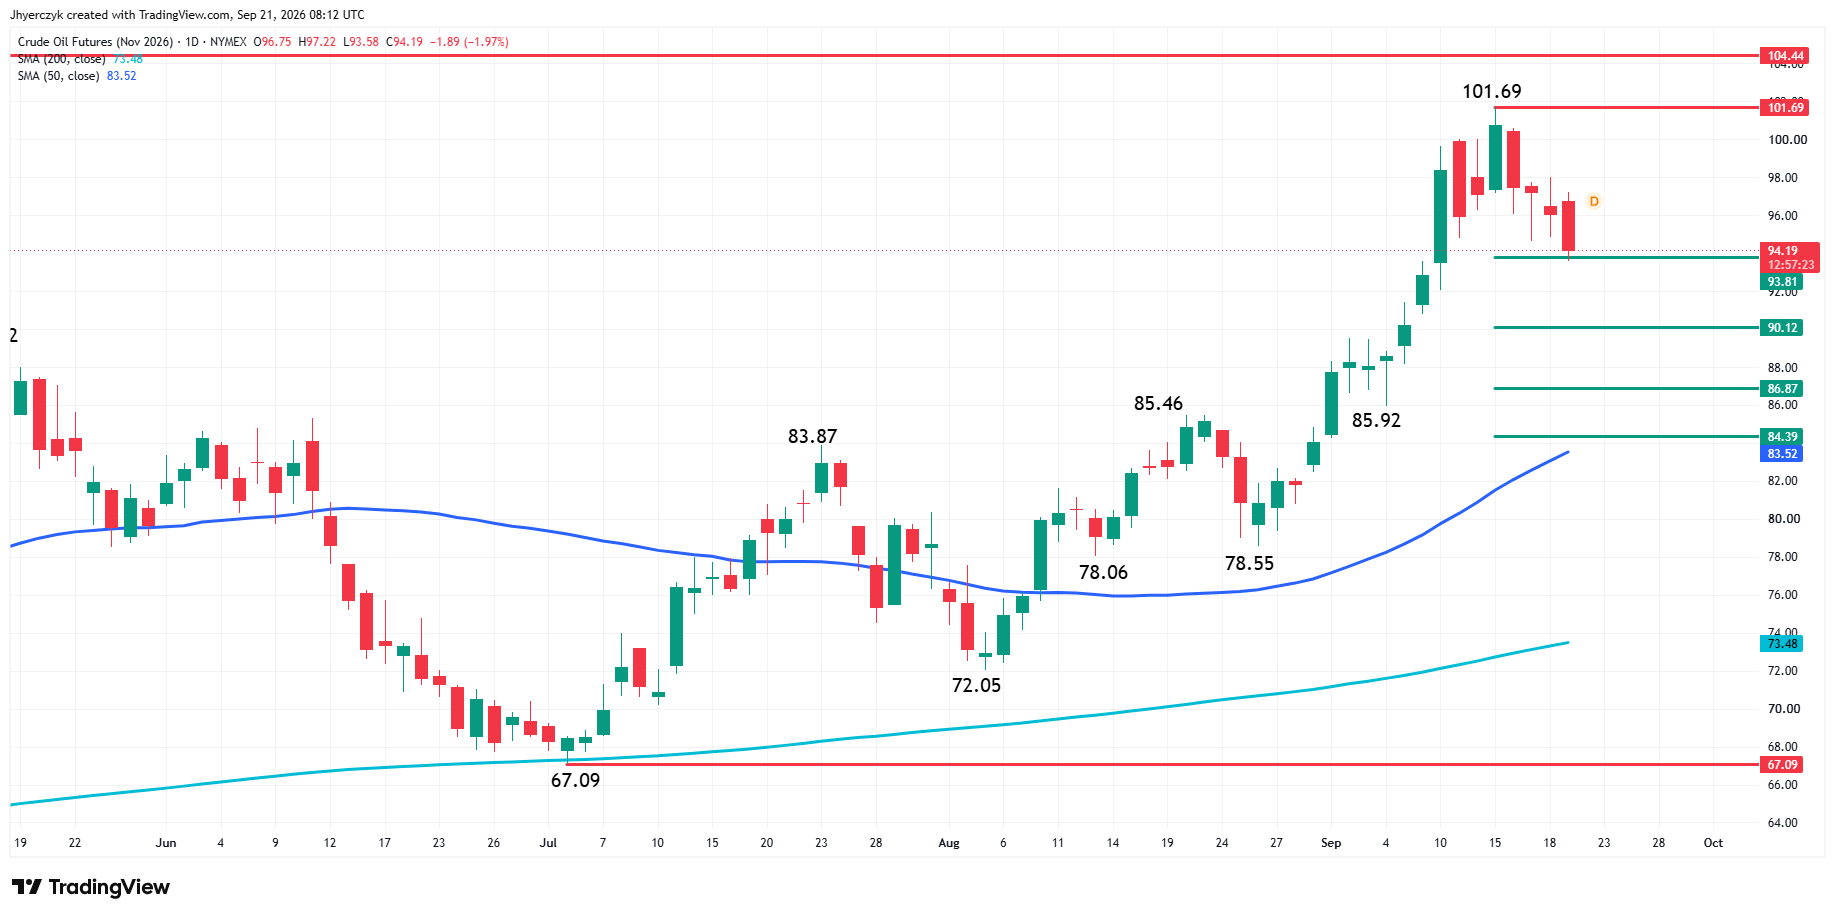
Crude fell nearly $2 after Saudi export data showed barrels moving through the Strait of Hormuz again. Gold needed that to pull yields down and soften the rate conversation. Yields did not follow. Gold lost $23 on a day when crude dropped $1.80.
The whole chain has to work for gold to get a rally going. Lower oil into lower yields into softer Fed talk. Monday delivered the first link. The second and third did not show up. One session of cheaper crude against a backdrop where Kashkari just called inflation broad-based is not going to change anything by itself. The inflation data has to turn. The Fed’s language has to shift. A single crude headline is not getting gold to the other side of the rate trade.
The conflict is still running through supply routes. Fuel costs are elevated even with Saudi barrels moving again. The drop in crude Monday was real. Whether it lasts past the next Houthi headline is a different question. Gold will not react to that until the bond market reacts first.
India Pulled Back and China Bought the Dip Again
India’s gold demand stayed soft last week. Buyers held off anticipating lower prices. India stepping aside during a correction takes a physical bid off the table at the worst time. Gold is already losing the rate trade. Losing the Indian bid on top of that strips one more layer of support out.
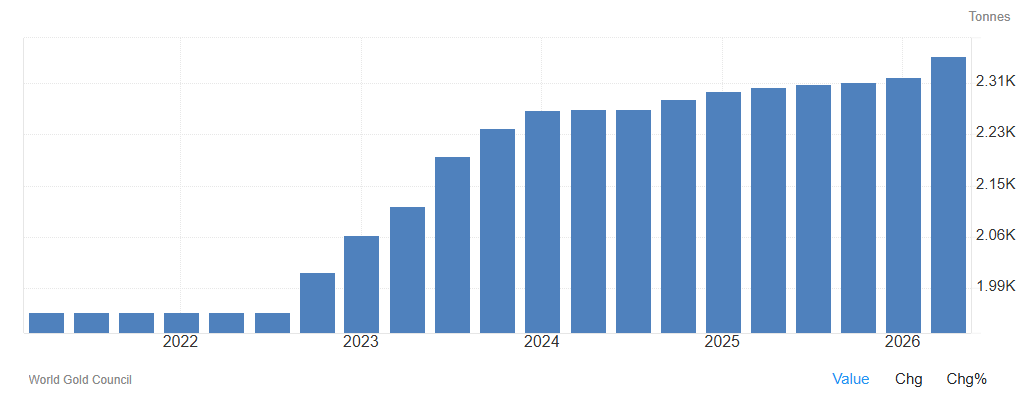
China kept buying. Premiums held steady and investment demand stayed intact on weakness. Chinese buyers have been accumulating on dips consistently for weeks. At current prices that is not enough to reverse the decline. It keeps the physical market from falling apart underneath the rate selling. If gold trades back toward the September low, the steady Chinese accumulation starts to count for more. Right now it is a floor in search of a reason and the rate trade is not providing one.
What to Watch
Central bank speakers and inflation data this week are the catalyst. Kashkari called it broad Sunday. If the rest of the Fed follows that line there is nothing for gold to trade except the next lower high. The next data print either supports the hawks or gives the doves room to push back. Oil coming down only matters if yields come down after it and Monday said they are not interested. India stepping aside strips physical support during the correction. China buying every dip keeps a bid underneath but Chinese premiums alone are not going to reverse a decline running across three central banks.
Sellers own the chart below $4,384.59 and $4,405.59 with the main trend down and the lower high at $4,510.93 confirmed. Below $4,319.61, sellers have a path through the 50-day moving average at $4,295.83 and $4,282.62 into the $4,235.17 to $4,230.51 zone.
Gold has to clear $4,384.59 and then deal with $4,405.59 to put the $4,466.14 to $4,481.78 zone in play. The lower high at $4,510.93 and the 200-day at $4,541.86 both have to break to turn the trend.
If you’d like to know more about how to trade gold, please visit our educational area.