



Gold & Silver Outlook: Fed Tightening Caps Metals as Easing Oil Softens Inflation Fears
Gold and silver lost value the previous week with additional hawkish actions by the U.S. Federal Reserve. The prices of precious metals are also impacted by geo-political events, and war, and the current prices reflect a mix of these and other forces.
Tighter U.S. monetary policy is putting upward pressure on the value of the U.S. dollar. The Federal Reserve announced last week that it was increasing the target range for the federal funds rate by 0.25 percentage points to 3.75% to 4.00% for the first increase since 2018. The Fed stated it expected additional rate increases in the future, which is bullish for the U.S. dollar. The increase in the target range for the federal funds rate increases headwinds for metals priced in U.S. dollars.
The price of oil was also bullish for precious metals. On Monday, the price of oil fell after it was reported that the United Arab Emirates and other Gulf States were restoring their exports. Saudi Arabian exports have almost returned to pre-August levels, and some of the country’s exports are being transferred to waiting ships off the coast of Oman. The decreased price of oil reduces the risk of additional inflation and supports the bullish outlook for precious metals.
Geopolitical tensions are still high, especially with the ongoing Iran situation after 7 months. The disruption of shipping through the Strait of Hormuz and concerns about security in the Red Sea continue. High geopolitical tensions mean that investors will still see gold as a safe-haven asset even with lower expectations for gold demand as interest rates rise.
Expectations for industrial demand for silver are likely better with rising electrification and solar energy, but tightening monetary policy and a possible recession are also likely to negatively impact investment and industrial demand.
There are still a lot of speeches scheduled by Fed officials this week, and the market will interpret each speech for any new clues about the likely direction for interest rates.
We expect little to no change for gold or silver this week, with geopolitical uncertainties and easing energy prices likely to offset the expectations for higher interest rates and possible recession.

Gold Technical Analysis: XAU/USD Holds $4,334 Support as $4,400 Resistance Caps the Recovery
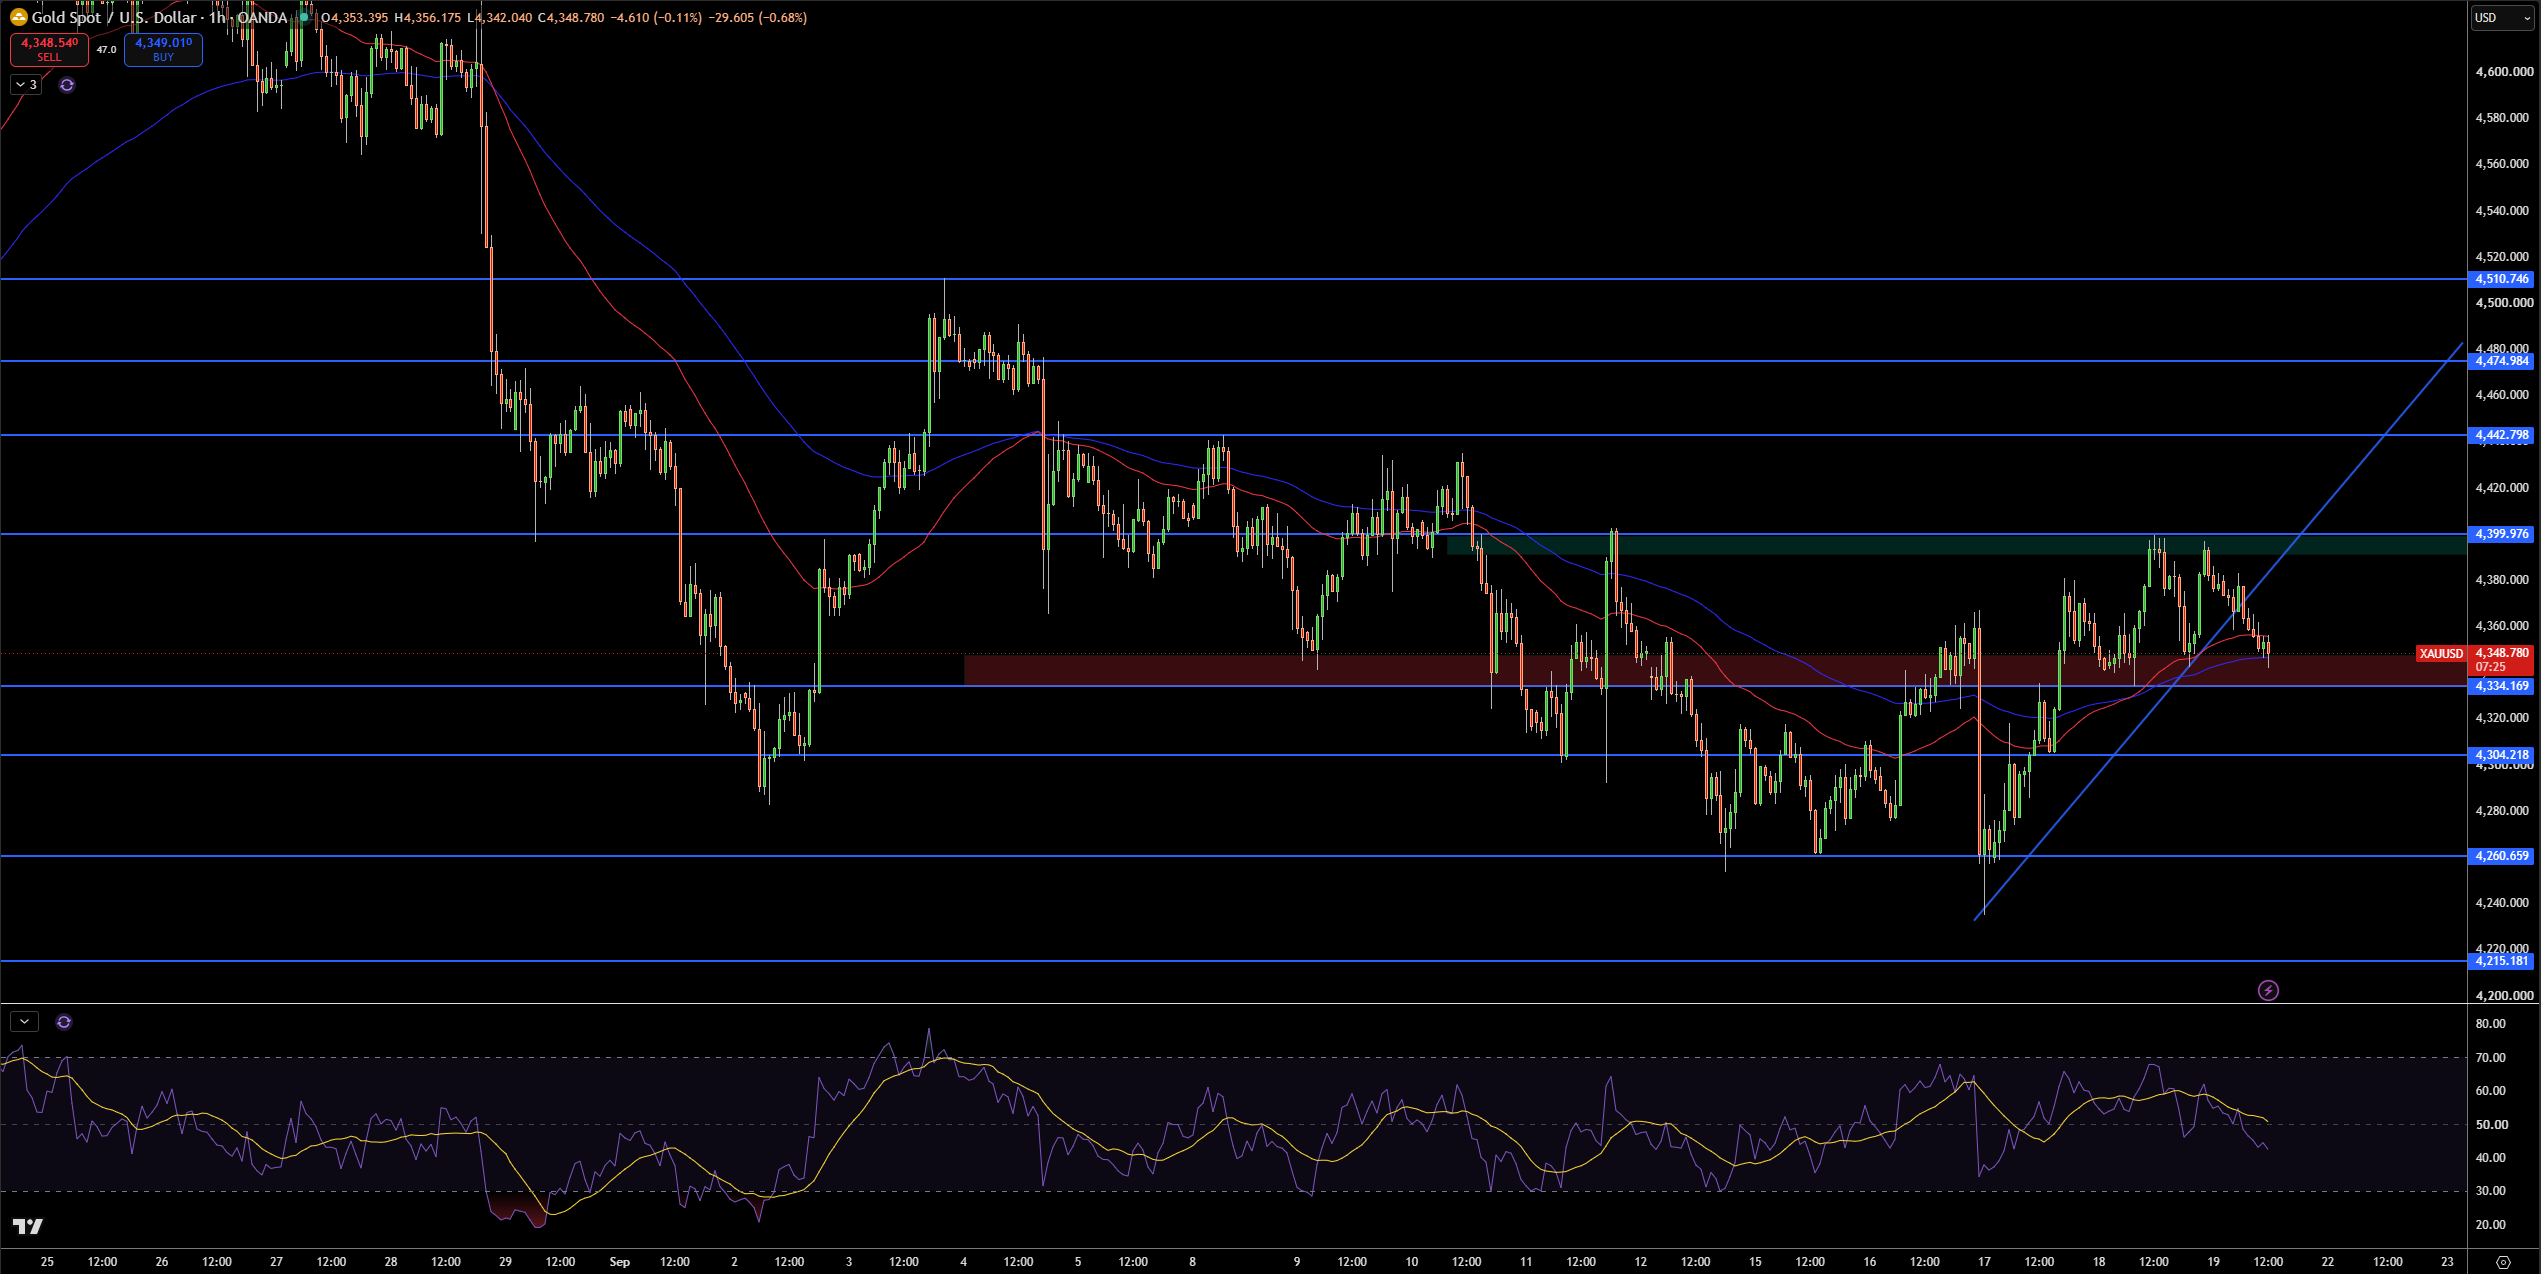
The 1-hour chart of gold shows it is currently trading at $4,349. Currently, the price of gold is trading between support at $4,334 and resistance at $4,400. The overall structure of the gold market is bearish and price is currently correcting to the downside. The bullish structure from the recent lows is still in place.
I expect gold to encounter resistance at $4,400. A break above $4,400 would open the way for price to increase to $4,443 and then to $4,475 and $4,511. If gold breaks support at $4,334, it would open the way for gold to retest support at $4,304 and then at $4,261.
Rising Money Flow indicates that gold is currently in a bullish condition. The Relative Strength Index (RSI) and the Momentum are both above their respective neutral levels, which suggests that the bullish condition of gold is strengthening. I am currently neutral to slightly bullish on gold as long as it is trading below the $4,400 level. If gold trades above $4,400, I will become mostly bullish and expect further bullish movement.
Gold Price Forecast
Every new Gold analysis as it publishes, today's technical signal and key levels, live price — on one page.
See all Gold forecastsSilver Technical Analysis: XAG/USD Tests $65.64 Support as Descending Trendline Keeps Pressure Intact
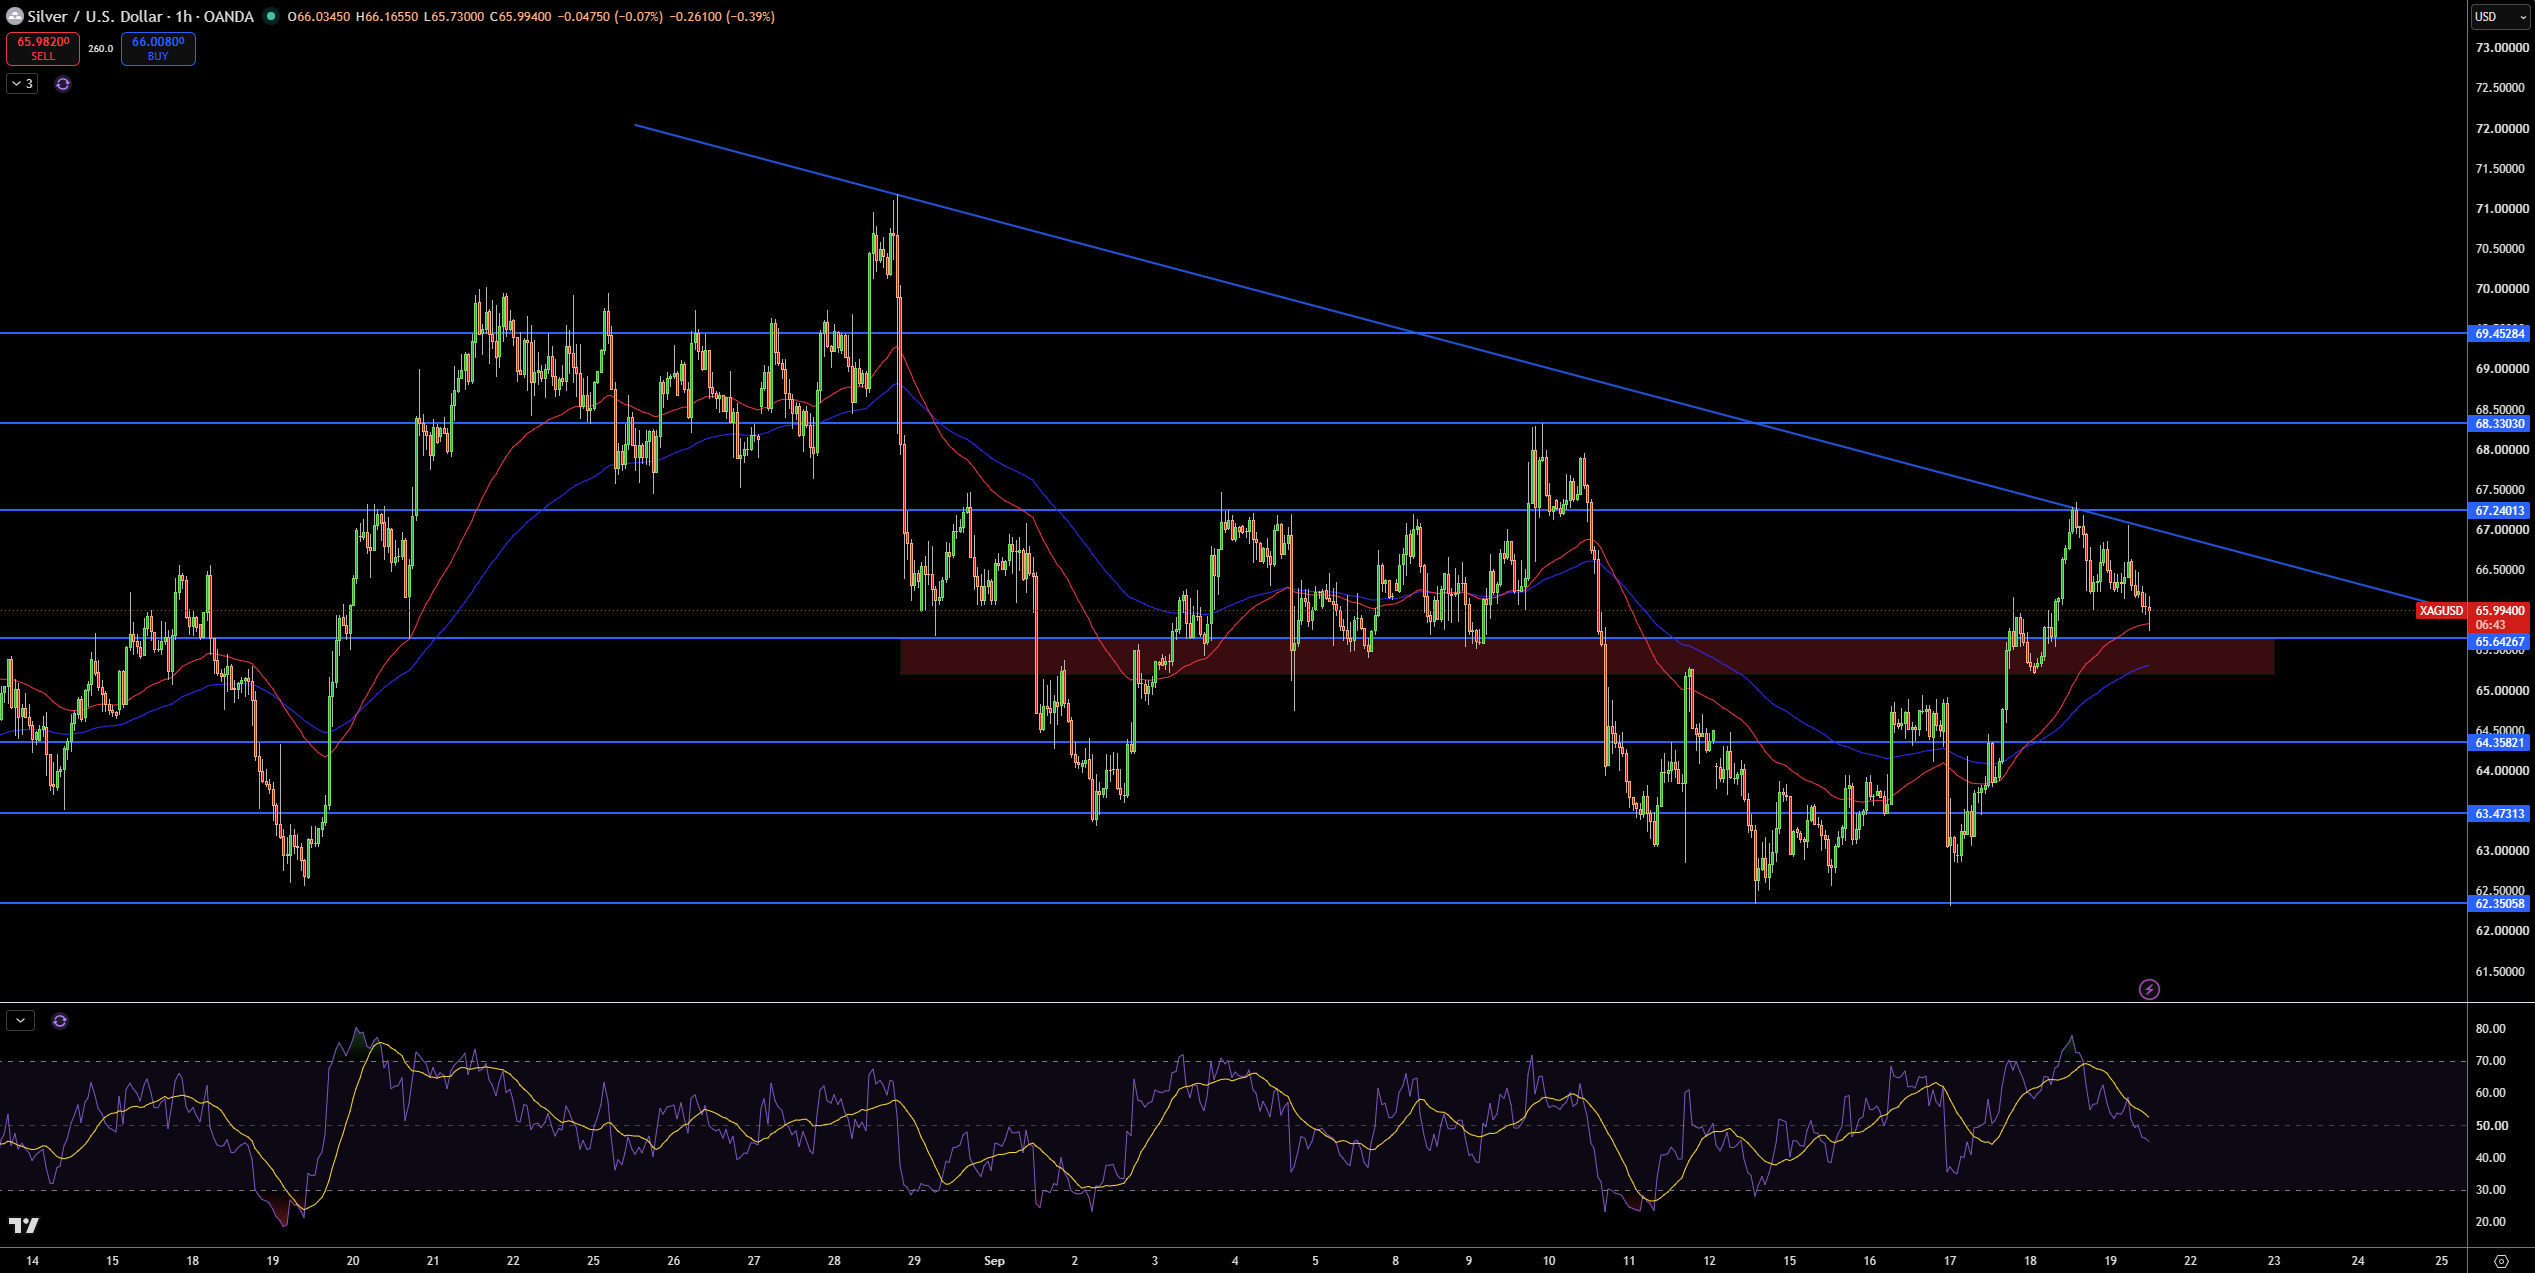
Silver has pulled back from $67.24 and is currently trading at the $65.94 support zone. The $65.64 support level is further tested by downward sloping trendline resistance. The $65.64 support level is important short-term support, but does not guarantee a floor in the market.
The $65.64 support level is the first major support level and a breakdown below this level is expected to see a retest of the $64.36 support level, and subsequently the $63.47 and $62.35 support levels. The $67.24 resistance is the first major level of resistance, and if broken should see a move higher to the $68.33 and $69.45 levels.
Momentum is also suggesting a breakdown, with the Relative Strength Index (RSI) also moving lower. I will consider silver positions bearish as long as $67.24 and the overall trendline resistance remains in place. A move higher to $67.24 would alter my near term outlook on silver. Below $65.64 would be a better indication of a move to $64.36.



