
Saudi Exports Recovering Through the Route Nobody Trusts
The Houthi strike on Riyadh over the weekend should have been worth $2 to crude. It lasted about an hour. Kpler showed Saudi exports back above 4 million barrels per day in September after falling to 2.4 million in August, the lowest since 2013. The barrels are getting through and the Sunday night rally died on that data before Monday’s open.
At 06:46 GMT, November WTI crude oil futures are trading $94.28, down $1.80 or -1.87%. November Brent crude oil futures are trading $101.94, down $1.92 or -1.85%.

Diesel Is Not Following Crude Down
Crude dropped nearly $2 Monday. Diesel did not move. IIR Energy has U.S. refining capacity falling by 371,000 barrels per day next week. Russian refinery disruptions are pulling regional fuel supply tighter at the same time.
That is the floor crude keeps hitting on the way down. The export recovery and the diplomacy headlines can soften the geopolitical bid on crude. The product side is ignoring both of them. Diesel at these levels with capacity dropping next week puts a limit on how far sellers can press this correction even with Saudi barrels moving again.
The Ship Count and the Flow Data Are Not Saying the Same Thing
JPMorgan satellite tracking had Hormuz flows at 2.9 million barrels per day over the past six days. In August that number was 700,000. That is a massive jump on paper. Central Command called the past two weeks the strongest for crude, cargo and LNG movements in six months. Independent shipping data counted 12 commodity vessels through Hormuz over the weekend. The previous weekend had 35.
The numbers do not agree and the market is trading the gap between them. Tankers are running with transponders off under military escort. Crude is still $20 above pre-war levels after Monday’s selloff. The East-West pipeline is damaged. Yanbu has taken Houthi strikes on the Red Sea side. Every Saudi export barrel is going through one route and the market is pricing the risk that the route stops working before anything else opens up.
Brent Oil Price Forecast
Every new Brent Oil analysis as it publishes, today's technical signal and key levels, live price — on one page.
See all Brent Oil forecastsNobody Is Signing Anything This Week
President Trump said he would meet Iranian President Pezeshkian at the U.N. General Assembly this week. Iran sent conditions through mediators. The Houthis responded by hitting Riyadh and an Aramco facility near Yanbu on the same weekend those conditions were being discussed. The U.S. and Iran traded threats Sunday.
Oil traders do not need a deal to sell. They need the conflict to stop getting worse for 48 hours. Friday had China pressing Iran to rein in the Houthis. Monday stacked the Saudi export data on top of that and gave sellers the cover to press lower. The headline shifted from escalation to conversation. That was enough. Whether it lasts past the first UNGA session is the question crude is trading right now.
Daily November WTI Crude Oil Technical Analysis
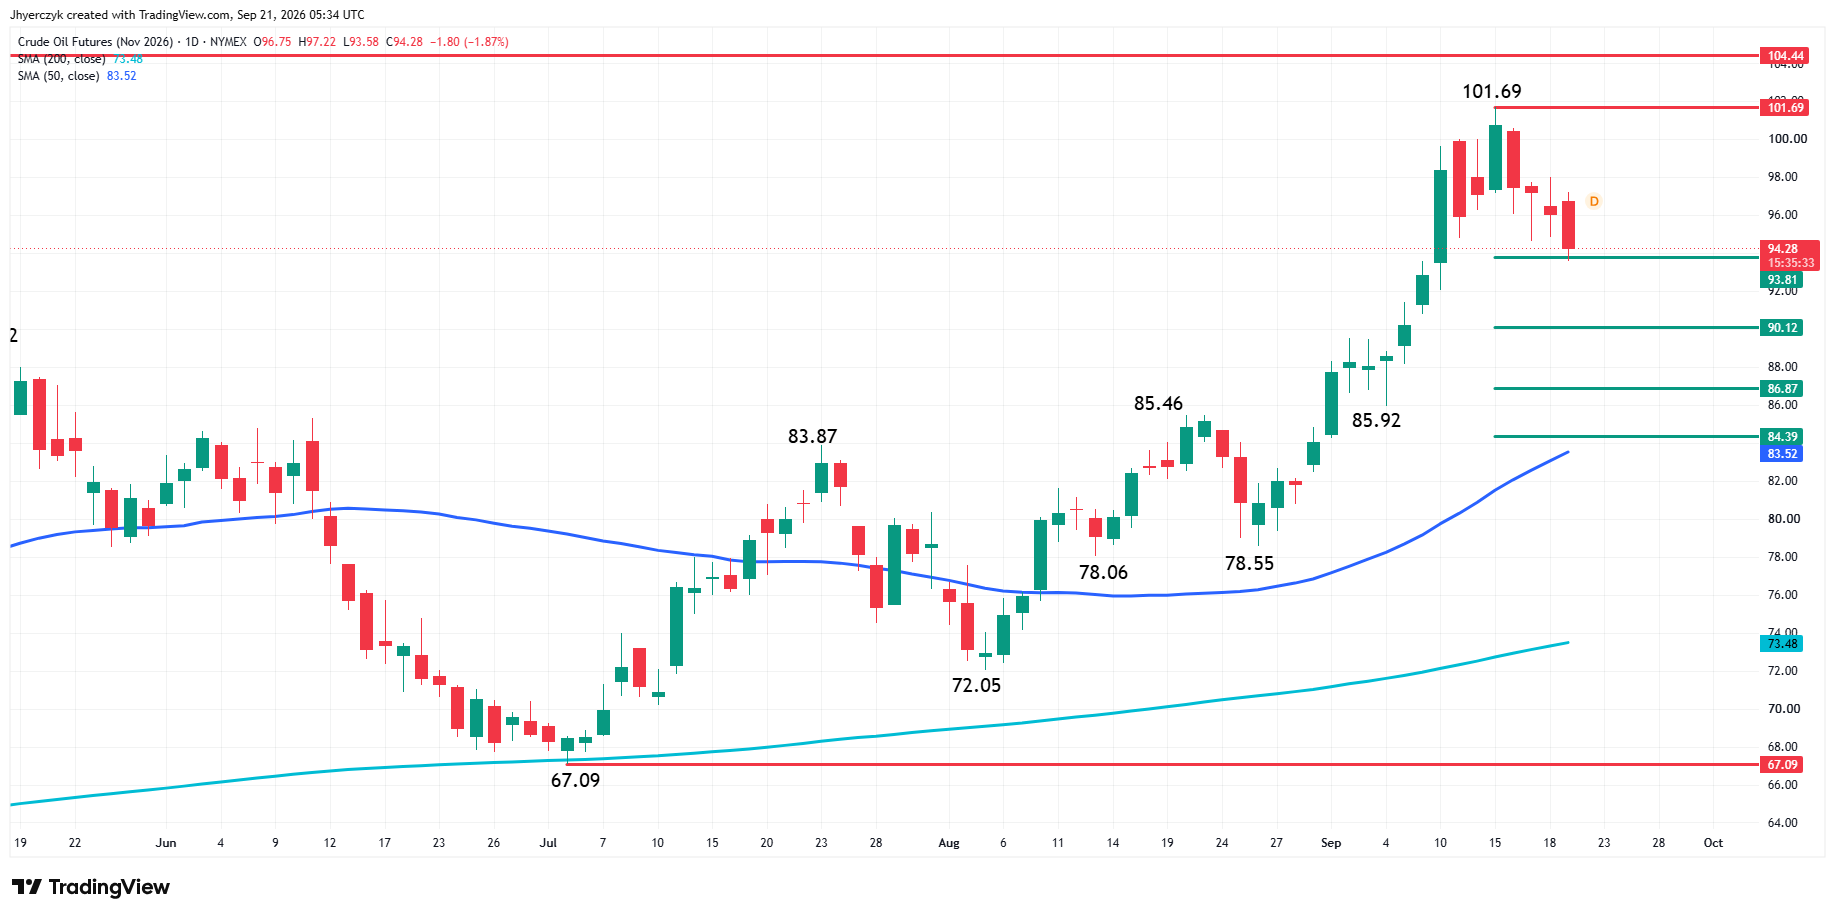
November WTI crude oil futures are testing support at the minor 50% level at $93.81 after retreating from last week’s high at $101.69. The main trend is up according to the daily swing chart.
Support below $93.81 sits at the main 50% level at $90.12, followed by $86.87 and the September 2 main bottom at $85.92. Resistance is today’s high at $97.22, followed by $101.69 and $104.44.
The 50-day moving average at $83.52 and the 200-day moving average at $73.48 remain well below the market.
Daily November Brent Crude Oil Technical Analysis
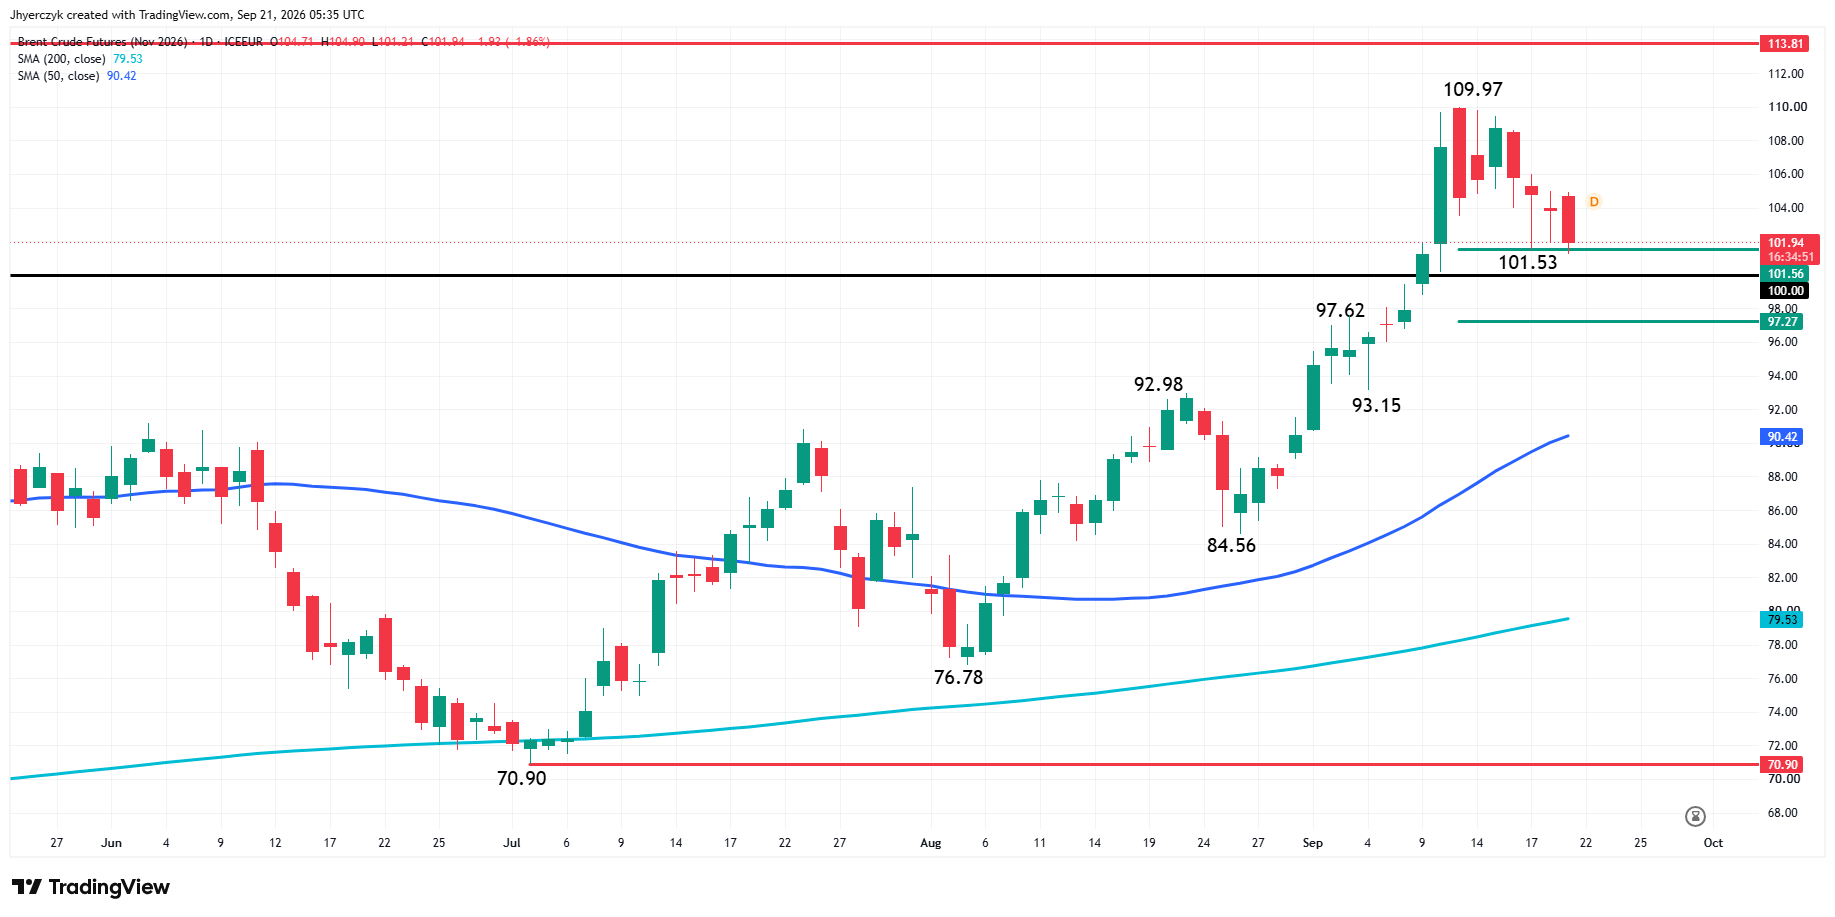
November Brent crude oil futures are testing a support zone at $101.53 to $101.56 after falling from last week’s high at $109.97. The market traded below the zone during the session and recovered above it. The main trend is up according to the daily swing chart.
Support below sits at the main 50% level at $97.27 and the September 3 main bottom at $93.15. Resistance is today’s high at $104.90, followed by $109.97 and $113.81.
The 50-day moving average at $90.42 and the 200-day moving average at $79.53 remain well below the market.
What to Watch
The UNGA sessions start this week with Trump and Pezeshkian both in New York. The Islamabad talks collapsed in June. Nothing since then has produced a deal. Saudi flow data through Friday is more important than anything said at a podium. Kpler had exports above 4 million barrels per day in September. That number either holds or it does not. Crude is trading the answer to that question, not the diplomacy. Diesel is the part of this trade that has not responded to any of the relief headlines. Refining capacity dropping 371,000 barrels per day next week with diesel already at record levels. The product market is setting the floor regardless of what crude does on the Saudi export story.
The main trend is up on both contracts with the 50-day and 200-day moving averages well below the market. WTI is testing the minor 50% at $93.81 and that level decides the near term. Below it, the main 50% at $90.12 and $86.87 open up ahead of the September 2 main bottom at $85.92 where the trend turns down. Reclaiming $97.22 is the first sign the selling has run its course.
Brent traded through the $101.53 zone during the session and fought back above it by the close. That is the line. Below it, $97.27 and the September 3 main bottom at $93.15 are open. Above, sellers have to deal with $104.90 and then $109.97. The main bottoms on both contracts are holding. The uptrend is not in danger yet.
If you’d like to know more about how to trade crude oil, please visit our educational area.