Gold & Silver Outlook: Fed Signals More Tightening as Geopolitical Risks Support Precious Metals
Gold and silver prices are choppy on Tuesday. Improving risk appetite and falling bond yields are providing some support, but higher rates are the consensus view at the Fed. Fed officials are taking a hawkish view on inflation, with President Musalem stating additional rate increases will likely be necessary to bring down inflation. He added that the current policy rate is still accommodative and doing smaller rate hikes along the way will be less disruptive.
The Fed fund rate is priced in by the markets to end the year at 4.75-5.00%. The markets are expecting the Fed to raise rates at least twice more this year with the terminal rate likely to be 5.00-5.25%. Most Fed officials believe core inflation will be above their 2% target for a long time. This situation is keeping a ceiling on the prices of non-yielding assets like gold and silver.
Treasury markets are providing some relief. Higher yields on U.S. debts eased a bit on Tuesday, lessening the near-term cost for investors to hold on to gold. With major U.S. economic data releases light this week, gold investors will focus on the energy markets, and Fed speakers for possible signals on the central bank’s policy for October.
Also, geopolitical tensions are helping to bolster the safe-haven metals. Houthi rebels in Yemen have been fighting to capture more territory. Meanwhile, gold and other safe-haven investments are waiting to see if U.S. and Iran tensions will ease or if there will be further escalations during the U.N. General Assembly. Increased geopolitical tensions are also likely to increase inflation and pressure central banks to further tighten, which may negatively impact the safe-haven metals.
Similar to gold, silver is negatively impacted by a tightening financial condition and increasing rates. Also like gold, it lost support on Wednesday from the Federal Open Market Committee’s policy statement and subsequent press conference.
Until we get more information from the FOMC, or further geopolitical developments, a neutral to bearish outlook on gold and silver is warranted.

Gold Technical Analysis: XAU/USD Breaks $4,334 Support as $4,301 Becomes the Next Downside Test
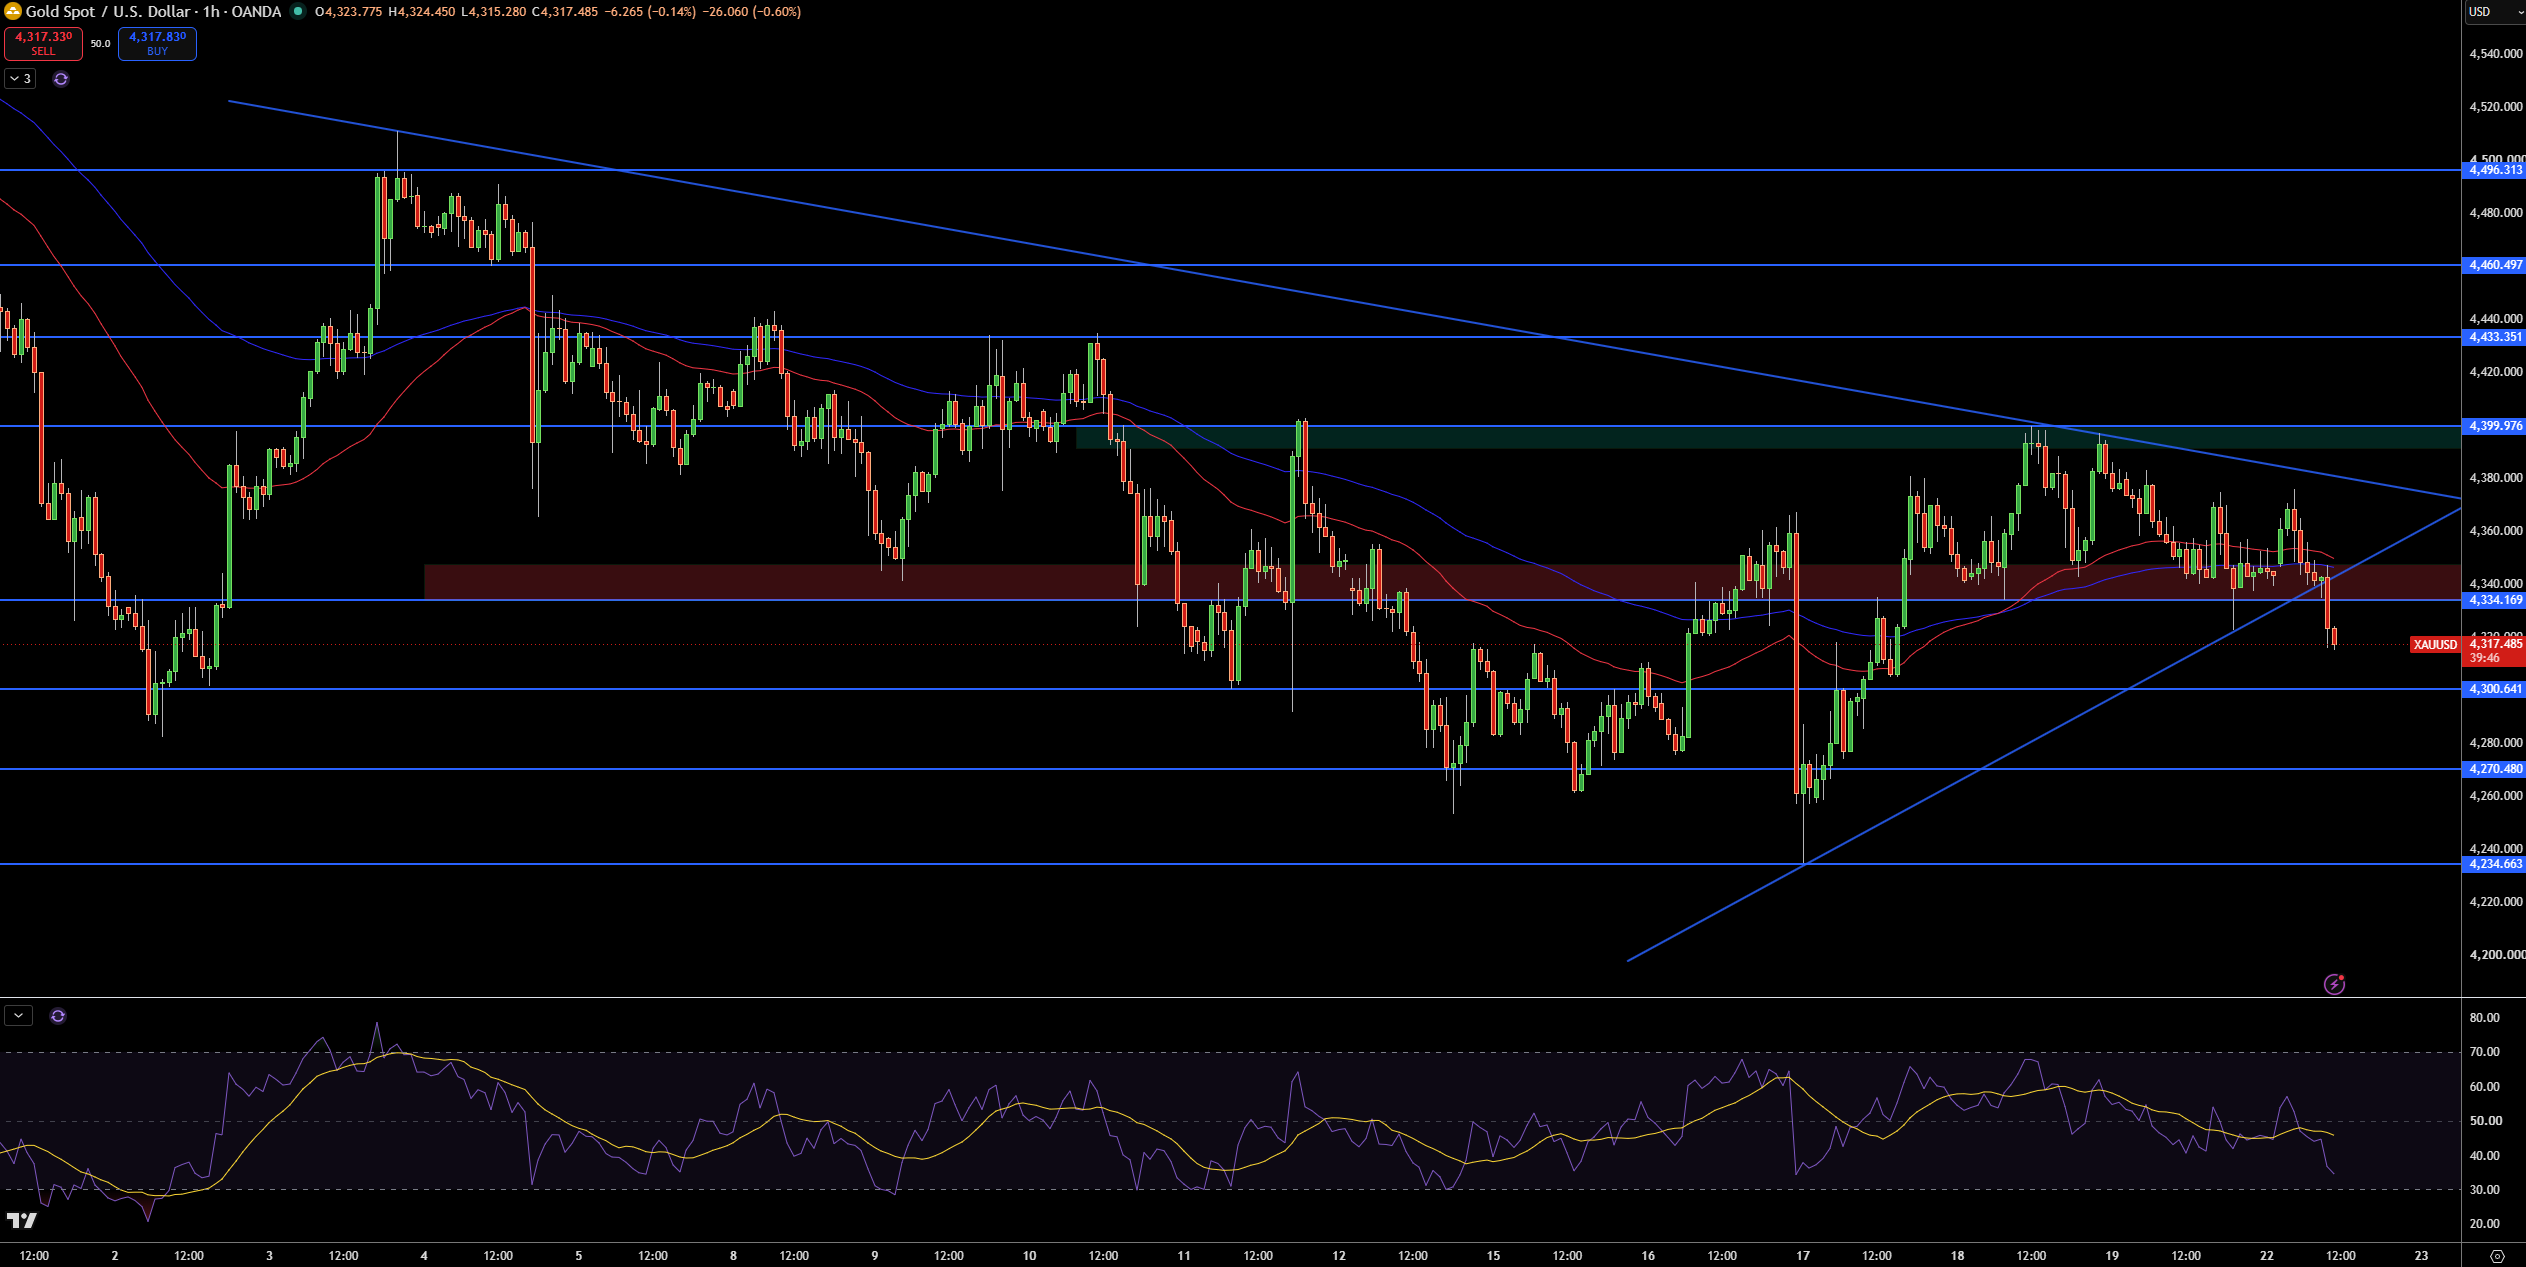
Gold failed to stay above the $4,334 level and is now heading lower. Price is currently at the $4,317 level on the 1 hour chart. We previously saw a number of rejections from the $4,334 level and below the 100 SMA. Price is also trading below the 200 SMA and the bearish trendline.
The first downside target is $4,301 which is also the next support level. A breakdown from here would likely lead to a test of the $4,270 level and possibly lower to the $4,235 area. A recovery in price would have to clear the trendline and $4,334 in order to be considered bearish.
Momentum is also in favor of the bearish view as the RSI is in the oversold territory. We also need to see a recovery above the $4,334 level to negate the bearish outlook and look for a potential upside toward the $4,400 and $4,433 levels. However, a breakdown below $4,301 would show that lower prices are likely and the $4,270 level is the next target.
Gold Price Forecast
Every new Gold analysis as it publishes, today's technical signal and key levels, live price — on one page.
See all Gold forecastsSilver Technical Analysis: XAG/USD Loses $65.64 as $64.44 Support Comes Into Focus
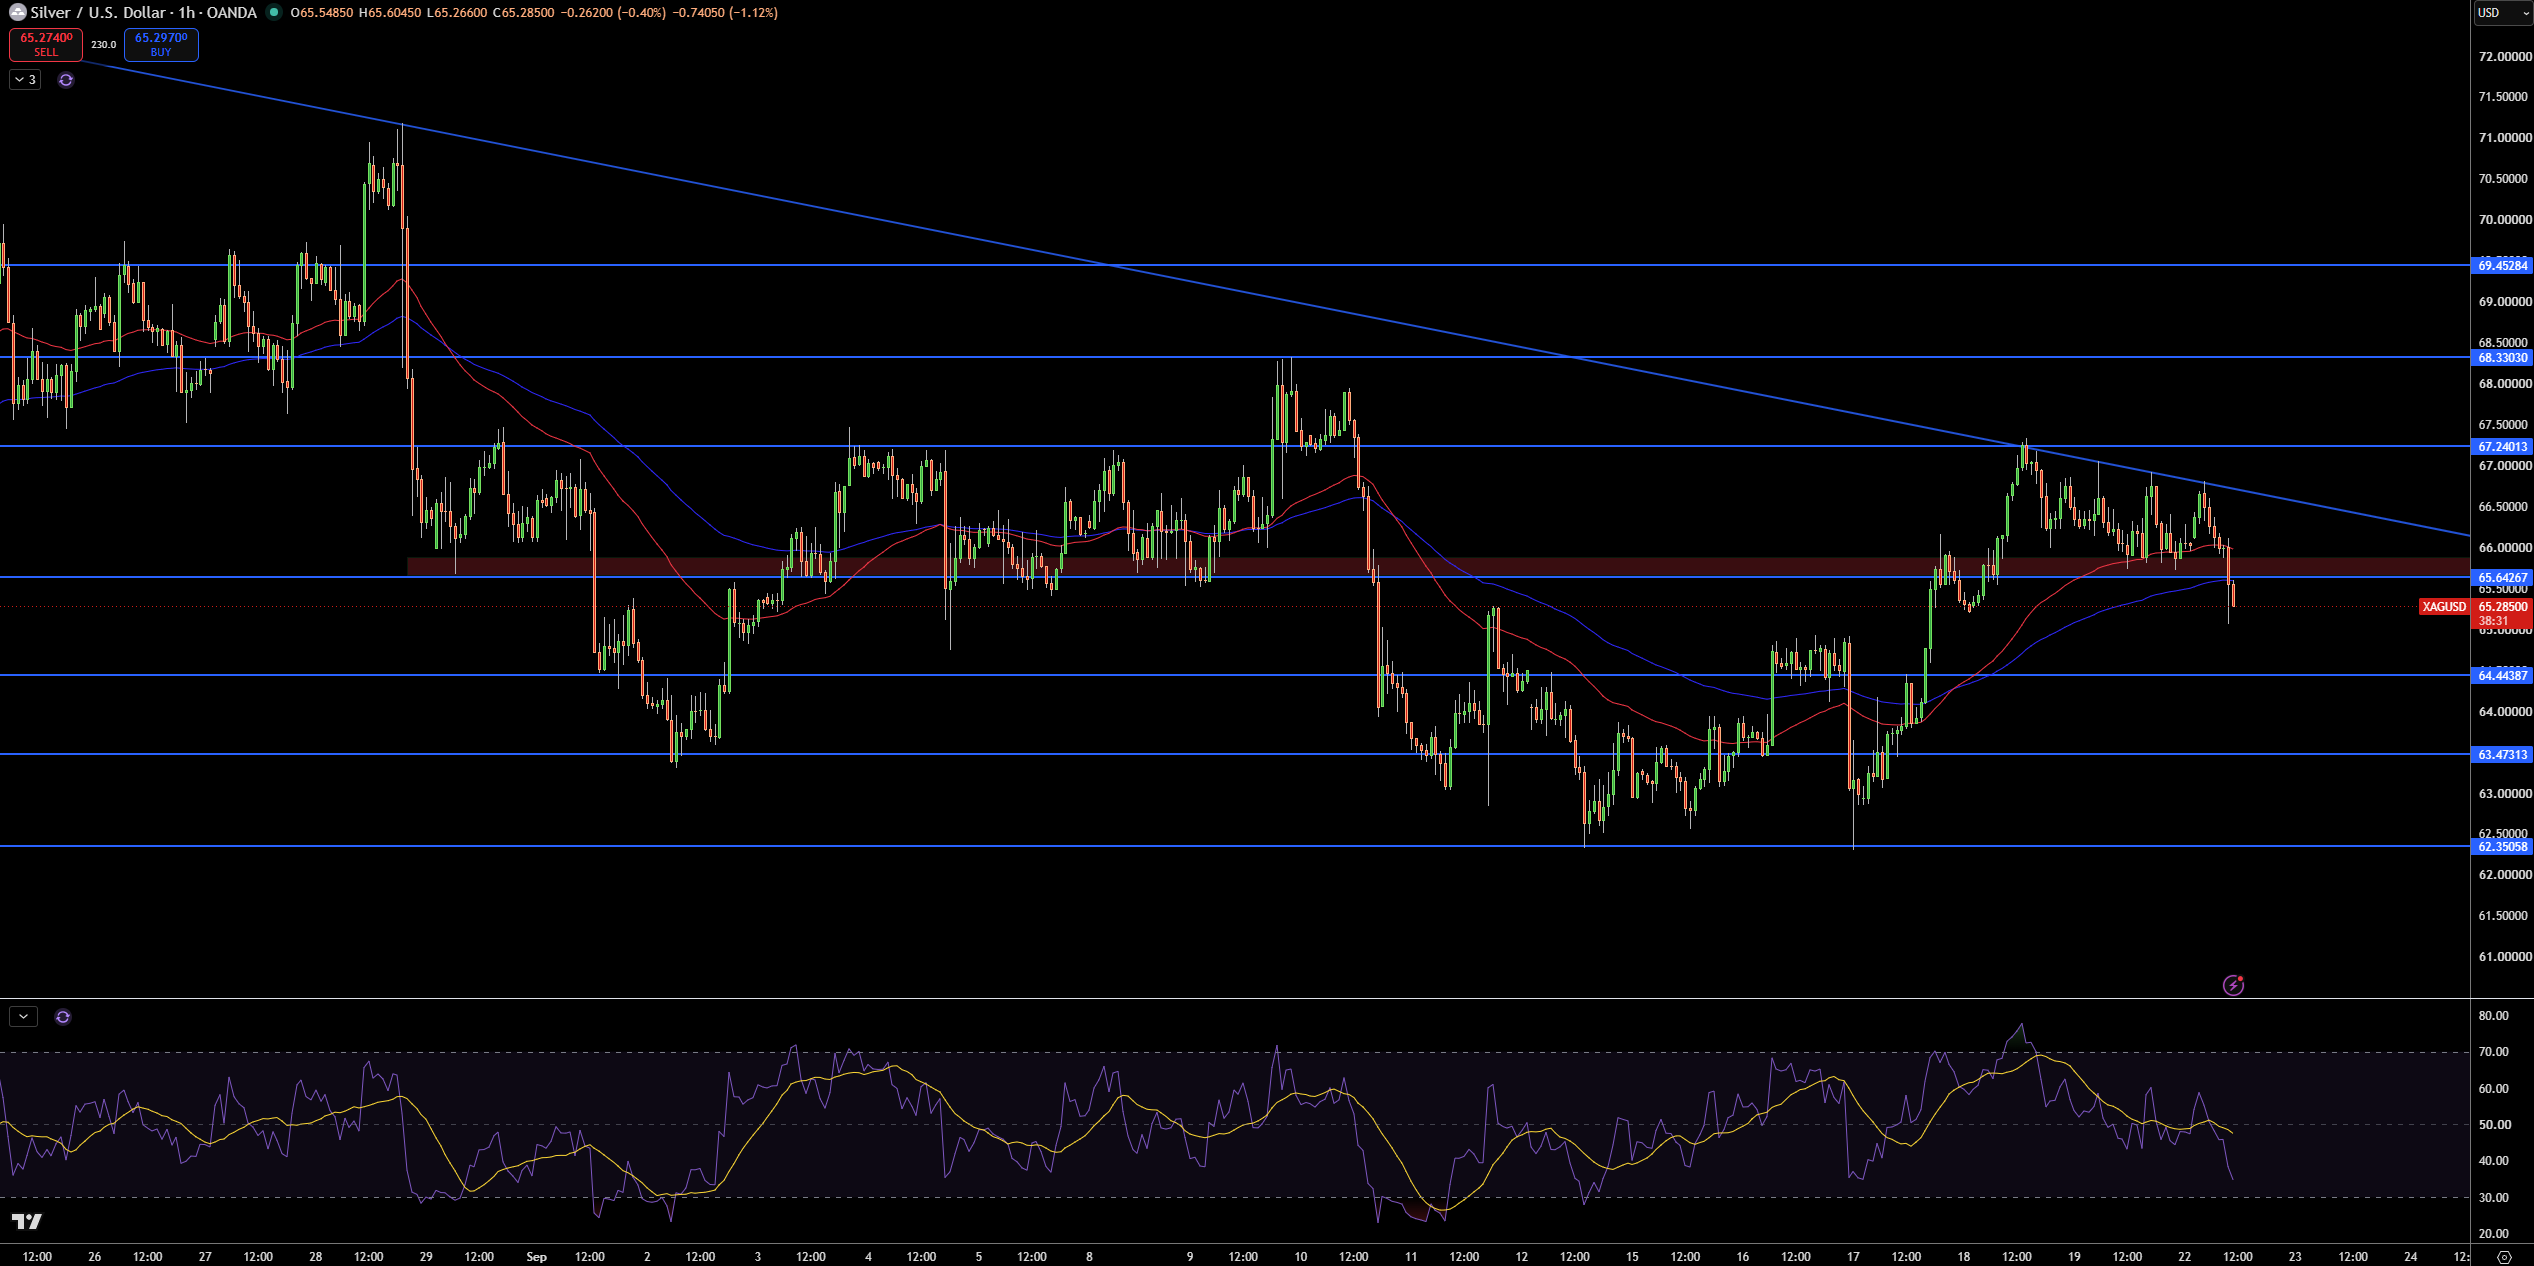
Silver has broken the $65.64 support level and is currently trading at $65.29. We previously saw price rejections at $65.64 and below the 100 SMA. The $65.64 level has also now been lost to the downside along with the 200 SMA and a bearish trendline.
The next support level is at $64.44 and is also the current location of a bearish wedge. A continuation of the wedge would have a price target of $62.36. We need to see a move above the bearish trendline to find a bullish wedge which would have a target price of $73.74.
My first support is at $64.44. If that gets taken out, expect $63.47 and then $62.35. If the market trades higher, expect resistance to come in at $65.64, $67.24, and then $68.33. RSI is falling and if it continues to do so, it would suggest that a larger top is in, and that a larger move to the downside may be seen. I am expecting further downside, especially if it breaks and closes below $65.64. A close above $67.24 would flip my thinking to the upside. Further, a break below $64.44 would confirm the move lower and possibly make a test of $63.47 likely.