
October Natural Gas Defends the 50-Day While the Entire Curve Sells Off
October sat on its 50-day moving average all day Monday. That is a front-month contract defending support ahead of rollover and nothing else. The real story is behind it on the curve. November fell back under $3.00. March 2027 posted a new low at $2.772. Sellers are not just pressing the shoulder-season contract into expiration. They are pressing the heart of winter lower at the same time.
The bullish facts did not go anywhere Monday. Storage builds came in light last week. LNG feedgas is running near 19 bcf per day. European inventories are well below normal and the Strait of Hormuz is still a risk to global gas supply. The curve looked at all of it and kept going lower.
At 14:56 GMT, October natural gas futures are trading $2.849, down $0.063 or -2.16%.

Daily October Natural Gas Technical Analysis
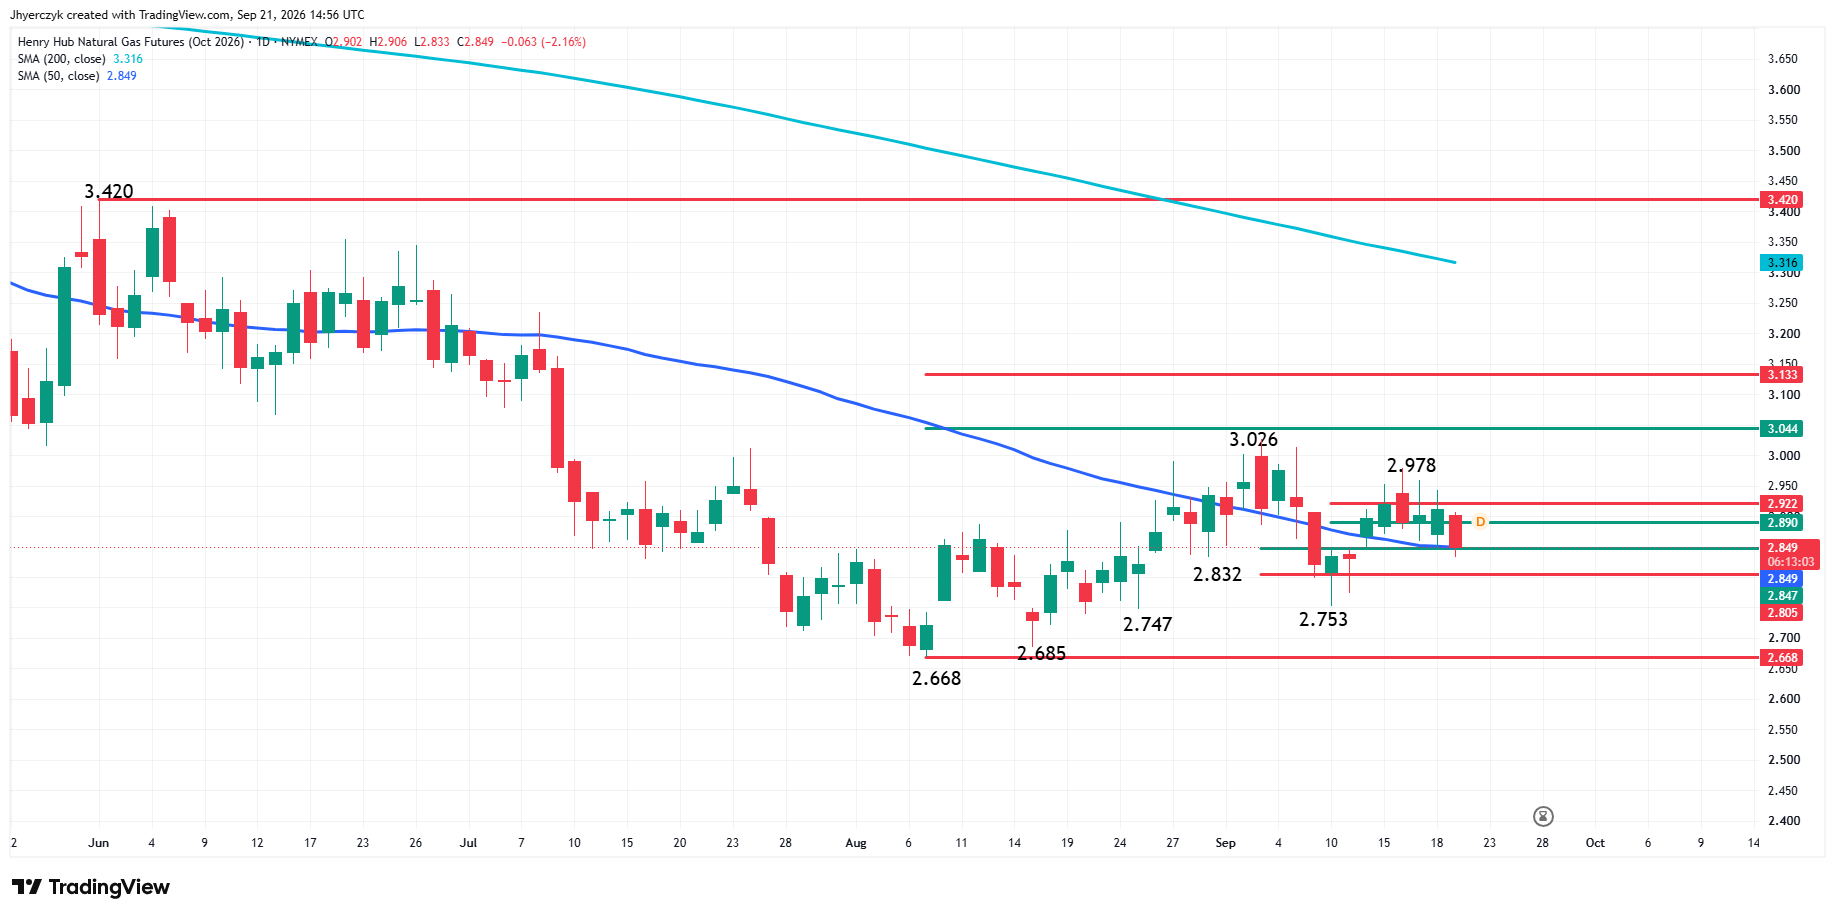
October natural gas is trading at its 50-day moving average at $2.849. The session high was $2.906 and the low was $2.833. The main trend is down on the daily swing chart. A trade through $2.978 will change the main trend to up. A move through $2.668 will signal a resumption of the downtrend.
On the upside, resistance sits at $2.890, $2.922, $2.978, and $3.026. The 200-day moving average at $3.316 remains well above the market.
On the downside, the $2.847 to $2.805 zone is directly below. Below $2.805, $2.668.
November Gave Back $3.00 on the First Day of the Week
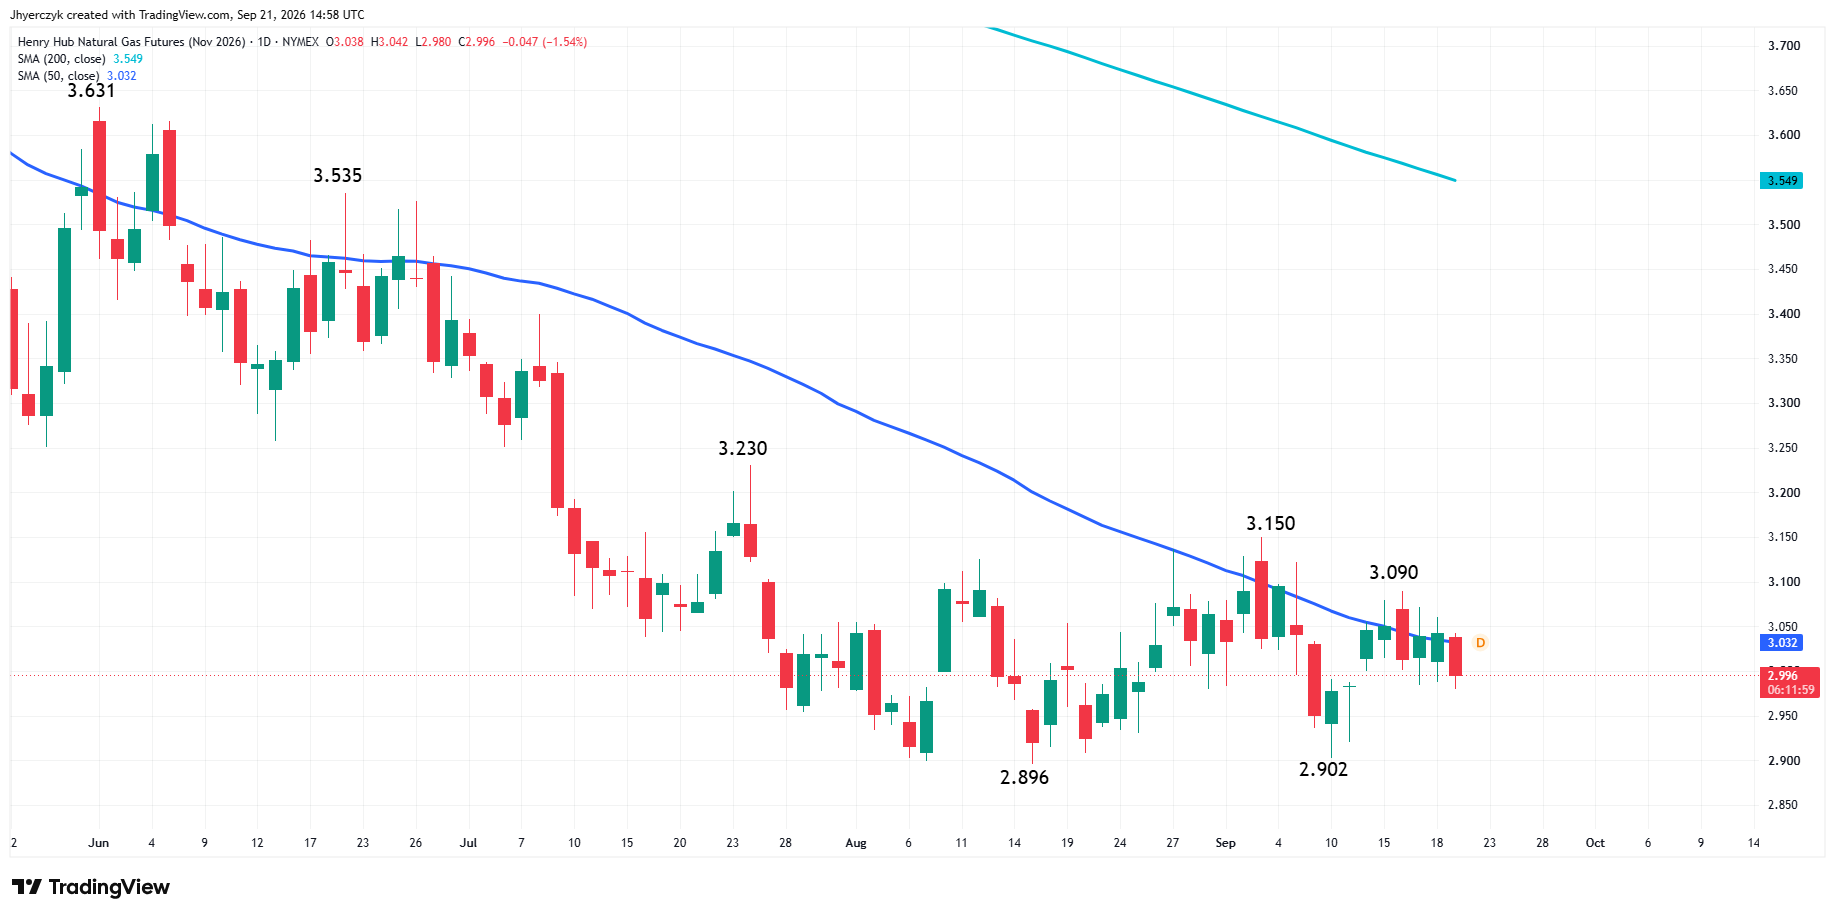
November natural gas is trading $2.996, down $0.047 or -1.54%. The contract opened at $3.038, traded as high as $3.042, and fell to $2.980. Below $3.00 and below the 50-day moving average at $3.032 by the afternoon.
Natural Gas Price Forecast
Every new Natural Gas analysis as it publishes, today's technical signal and key levels, live price — on one page.
See all Natural Gas forecastsThe September 16 rally stopped at $3.090, well short of the main top at $3.150. On the downside, the September 10 low at $2.902 and the August 17 low at $2.896 are the next levels. November is the rollover contract and it is leading the curve lower, not higher. That is not the kind of handoff bulls were looking for heading into October.
March Is Pricing a Mild Winter Before It Arrives
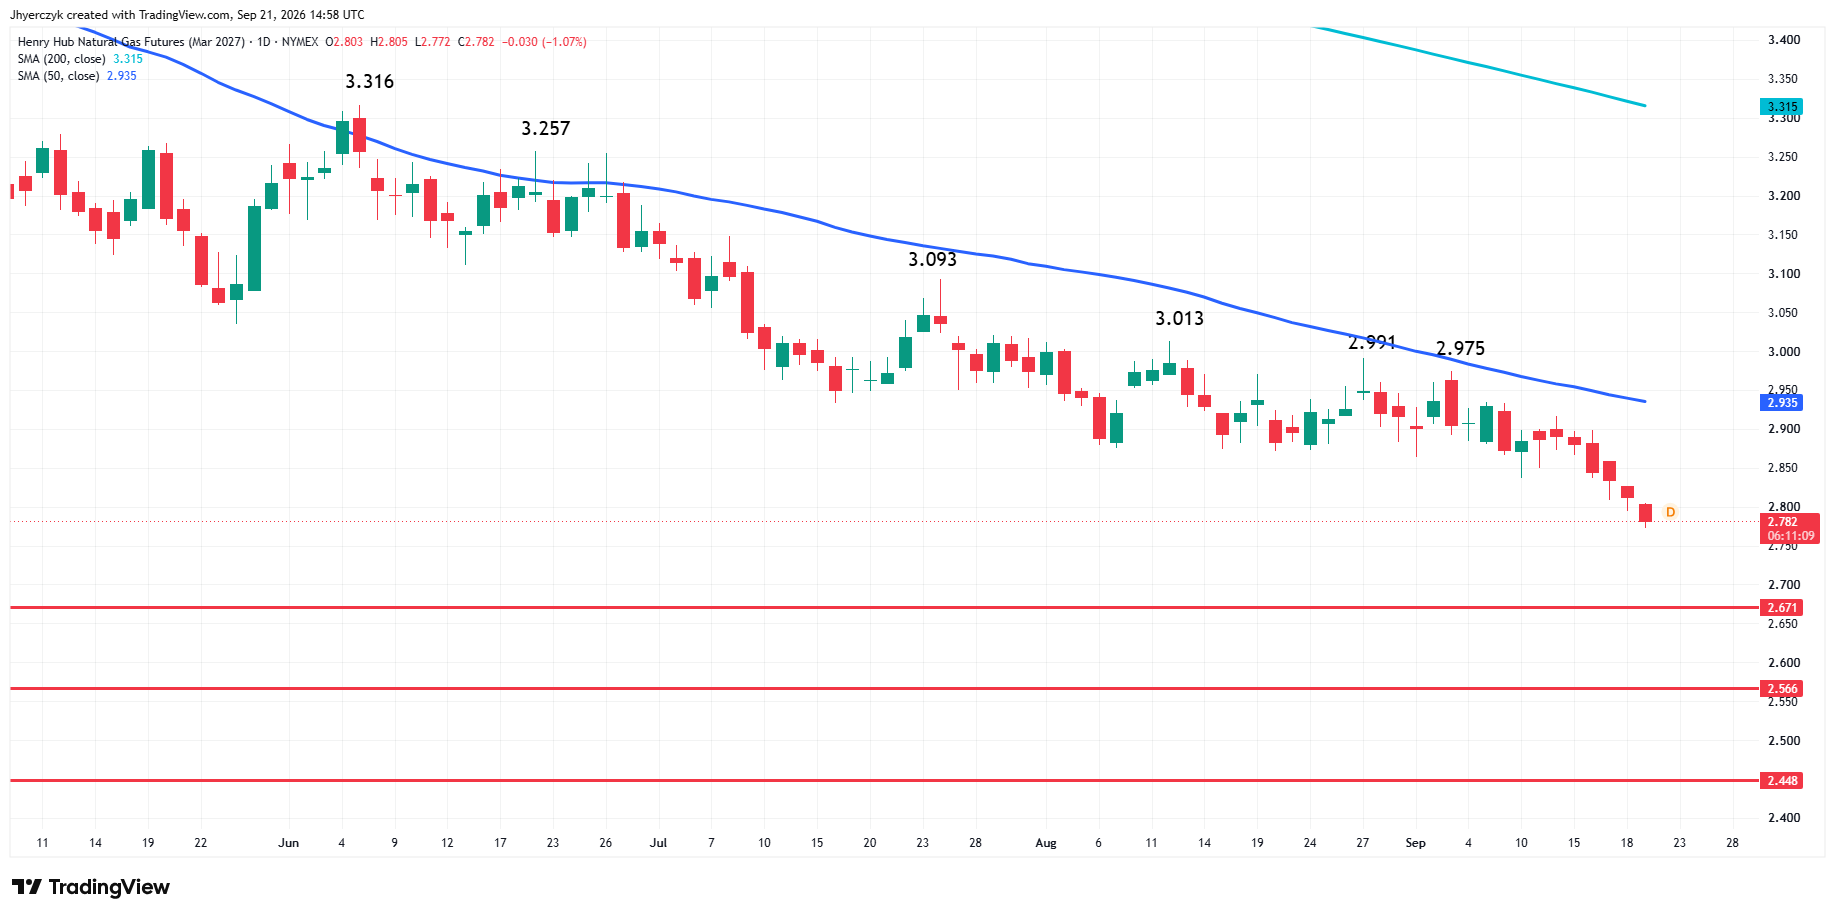
March 2027 natural gas is trading $2.782, down $0.030 or -1.07%. Monday’s low was $2.772. The contract sits below the 50-day moving average at $2.935 and the 200-day at $3.315. Lower highs since the June top at $3.316 and now pressing toward $2.671. Below that, $2.566 and $2.448.
A powerful El Niño is expected to cut heating demand across the Northeast and Midwest this winter. The same pattern could bring a milder European winter, limit gas-fired generation, and reduce LNG demand on that side of the Atlantic. European storage sat at 69% as of September 16 against an 85% five-year average. The Strait of Hormuz is still restricting LNG tanker traffic. March traded to a new low Monday with all of that sitting on the other side of the trade.
Three Days of Heat and Then the Forecast Turns
Most of the southern two-thirds of the country stays warm to hot through midweek. That keeps power burn elevated for a few more sessions. Then the South cools and the Commodity Weather Group already pulled back the area of above-normal heat across the South and Southeast heading into early October. The heat held demand together for two weeks. The forecast says that window is closing.
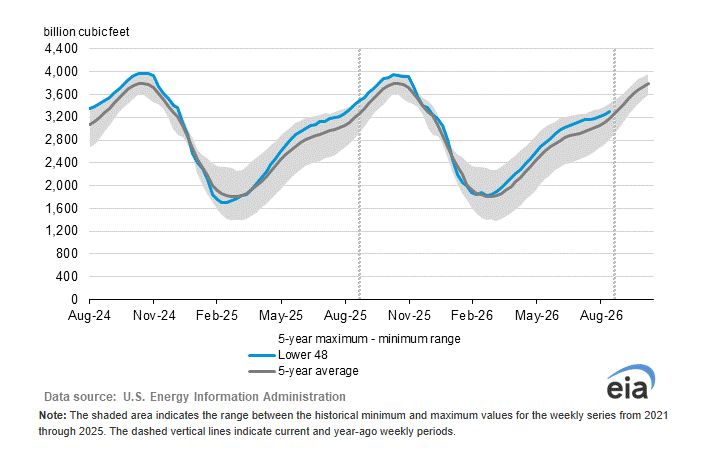
The EIA reported a 44 bcf injection for the week ended September 11, below the 48 bcf estimate and the five-year average build of 74 bcf. Early estimates for this Thursday’s report are near a 55 bcf build, again below the five-year average of 76 bcf. Two consecutive below-normal builds are the best case bulls have right now.
Against that, production was 113.8 bcf per day on Friday, up 4.9% from a year ago according to BNEF. Demand was 75.7 bcf per day, down 0.6%. Baker Hughes had 134 active gas rigs matching the three-year high. Inventories sit 3.7% above the five-year seasonal average and the EIA projects end-of-October storage near 3,985 bcf, the highest in a decade. Two light builds against a balance sheet that heavy are not going to change the math. The builds have to string together and the weather just made the next one less likely.
What to Watch
Thursday’s EIA storage report is the trigger for the week. A build well below 55 bcf or an extended heat forecast could force short covering. A fresh Strait of Hormuz disruption puts Europe back in the driver’s seat. The El Niño forecast is the longer-term weight pressing on the deferred curve and that does not change on a weekly report. March keeps making new lows. Winter has not started. That is the trade.
October is defending the $2.847 to $2.805 zone with the 50-day at $2.849 sitting inside it. Buyers ran to $2.906 Monday and got pushed back. $2.890 and $2.922 have stopped every rally attempt this month. Until those break, the lower main tops at $2.978 and $3.026 are not part of the conversation. Below $2.805, sellers have a clear run to $2.668 and the downtrend resumes.
November fell through the 50-day at $3.032 and lost $3.00. The September 10 low at $2.902 and the August low at $2.896 are where the next stand happens. Buyers need $3.032 and then $3.090 back before the chart improves. Until then the rollover contract is confirming the front-month weakness.
March is the weakest of the three. Below $2.671, the path opens to $2.566 and $2.448. The 50-day at $2.935 and the 200-day at $3.315 are both well above and moving away from the market. Sellers own this contract.
More Information in our Economic Calendar.