
Ethereum’s native token, Ether (ETH), looks poised to rally another 20% in the coming week, extending a rebound that has already lifted its price by roughly 85% since June.

ETH Enters Bull Flag Breakout Stage
As of Monday, Sept. 21, the ETH/USD exchange rate was breaking out of its prevailing bull flag pattern, a setup I highlighted in my previous Ethereum analysis.
For the unversed: A bull flag pattern forms when the price trades inside a parallel, descending channel after undergoing a strong rally. It typically resolves when the price breaks above the upper trendline and jumps by as much as the previous uptrend’s height.
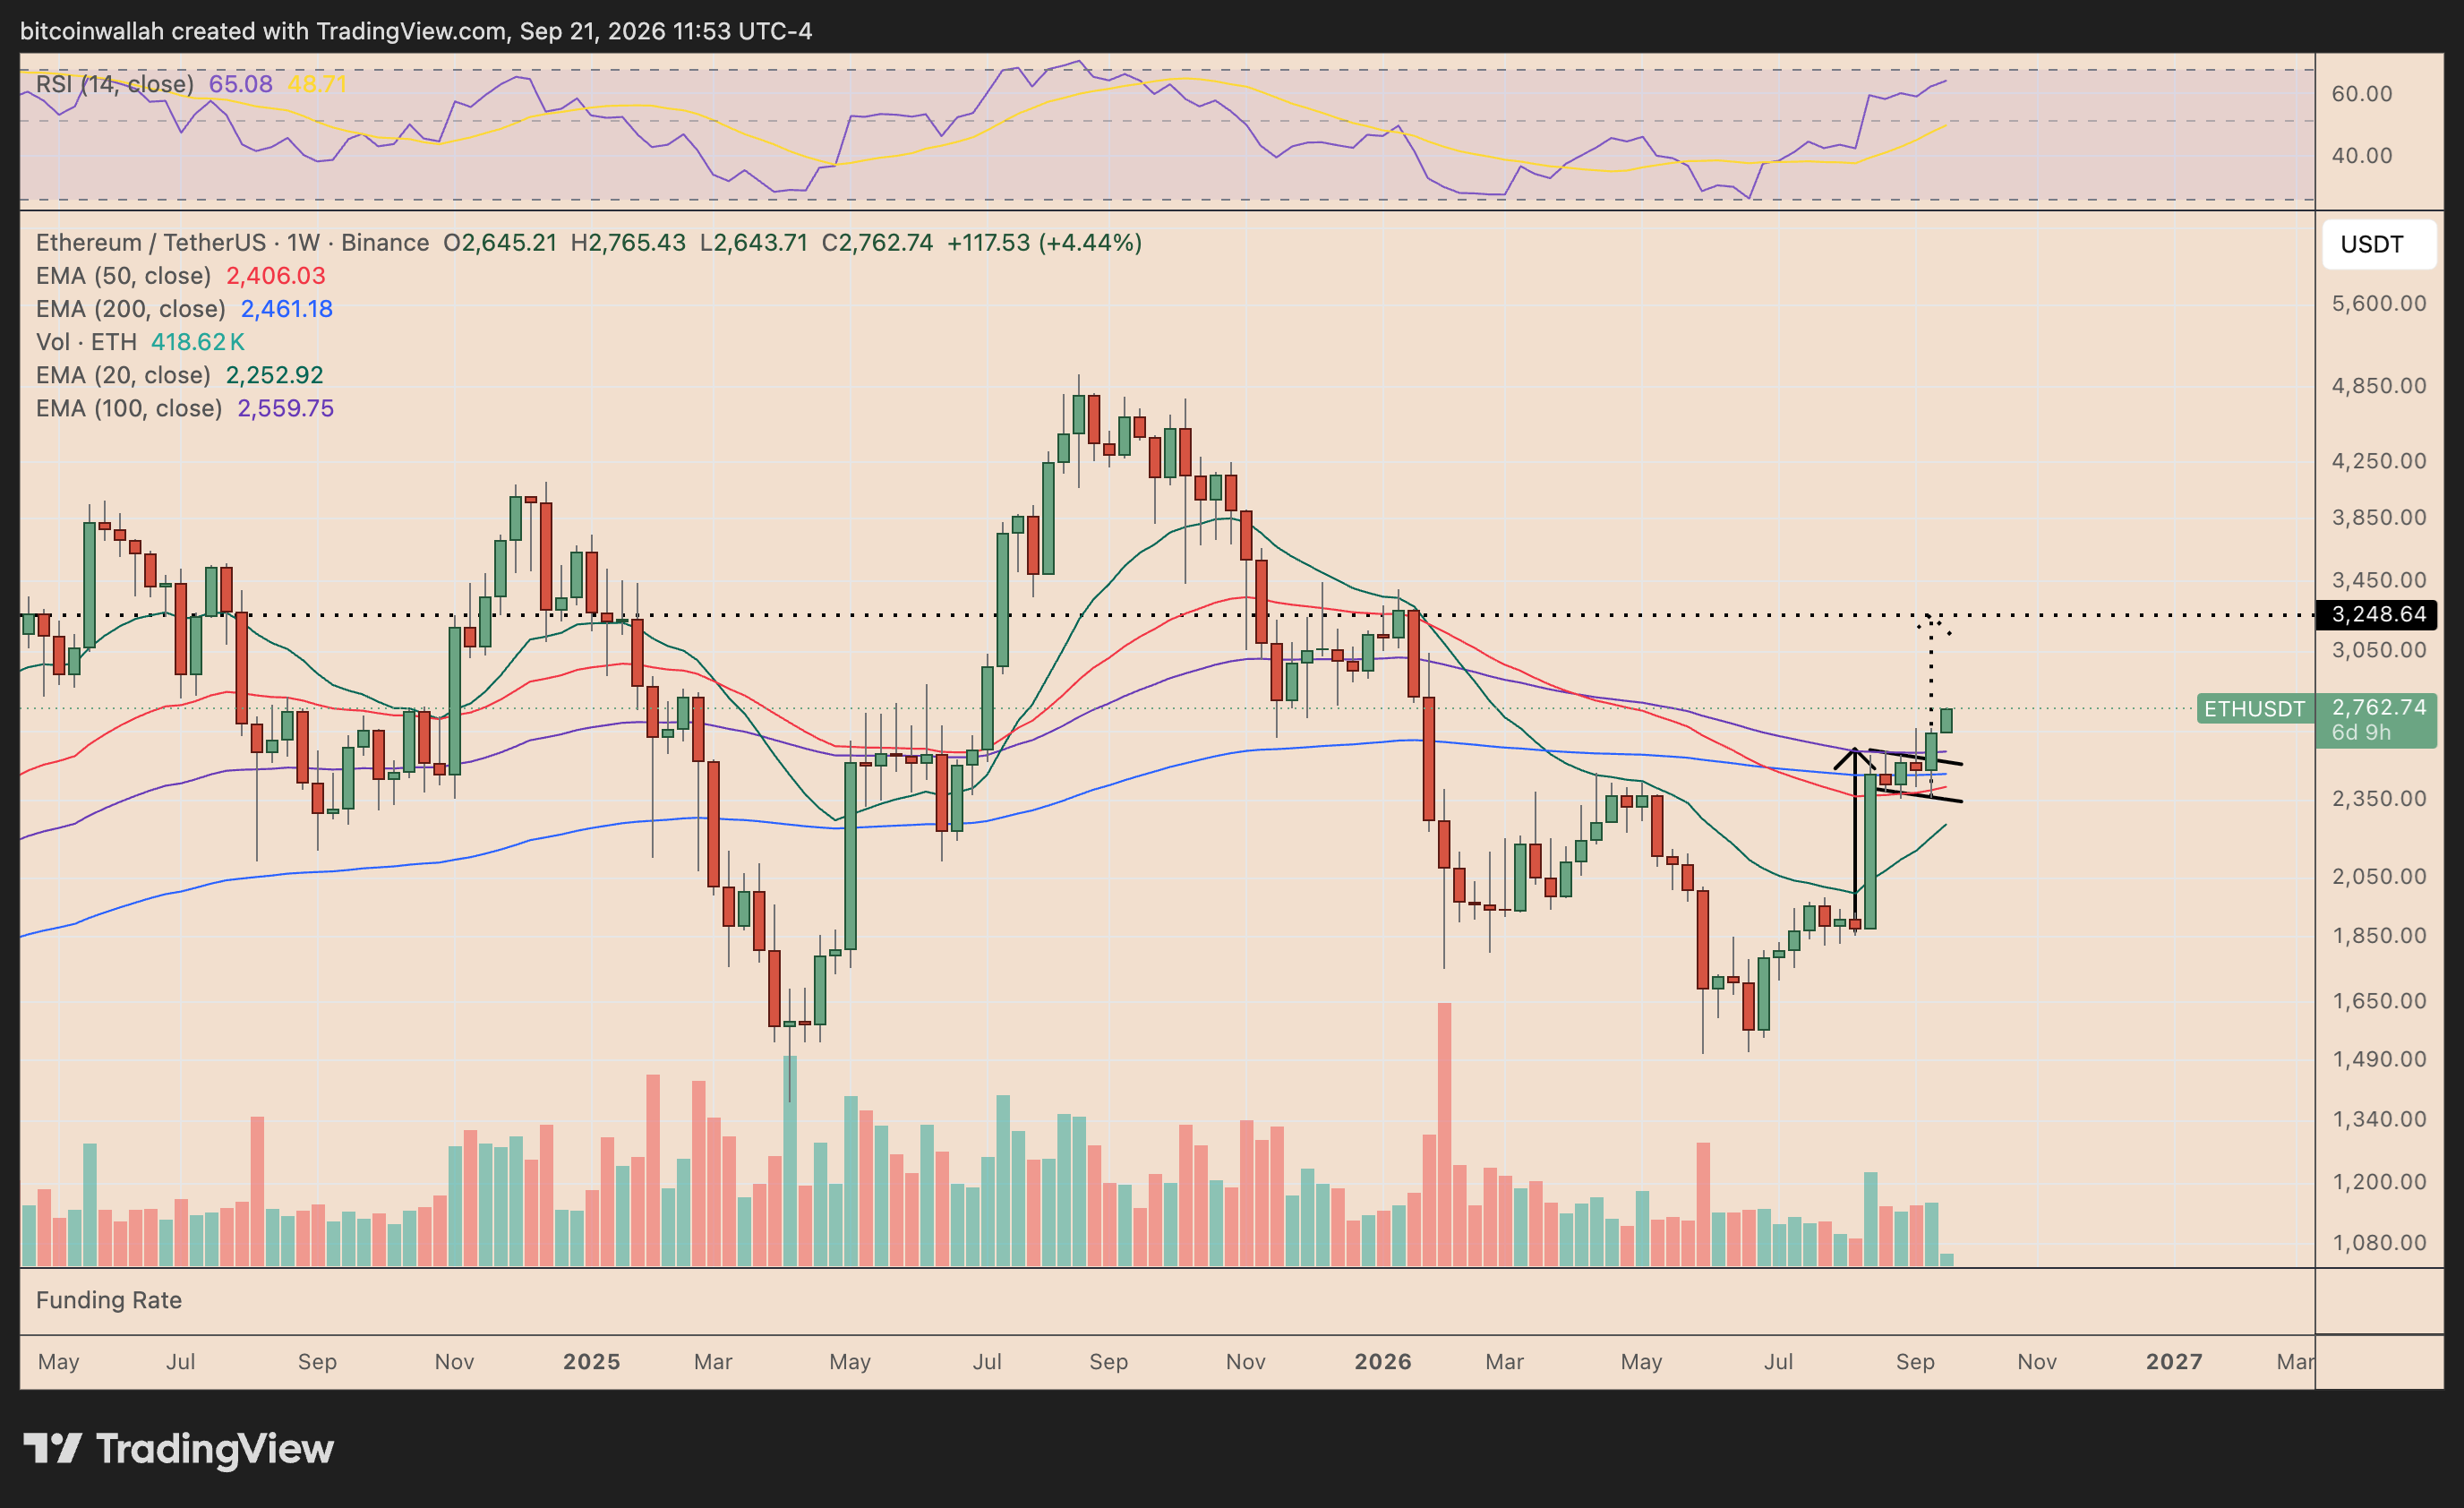
ETH has entered the breakout stage of this pattern after breaking above the upper trendline. Applying the technical thesis brings its potential upside target to around $3,250, a level that served as a strong resistance in January 2026.
Further supporting this upside outlook is ETH’s close above the key exponential moving averages, including the 50-week (red) and 200-week (blue) ones. The only downside is ETH’s weekly relative strength index (RSI), which may rise above the overbought threshold of 70 in the coming days.
An overbought RSI, however, doesn’t always precede price corrections. ETH price may continue its rally toward the bull flag target while undergoing lengthy consolidation periods, which would bring the RSI reading under 70.
Still, a close below the 200-week EMA near $2,640, which also sits around the bull flag’s upper trendline, would risk invalidating the bullish setup.
In that scenario, ETH could slide toward $2,550, where CoinGlass data shows an unusually large concentration of leveraged long positions vulnerable to liquidation.
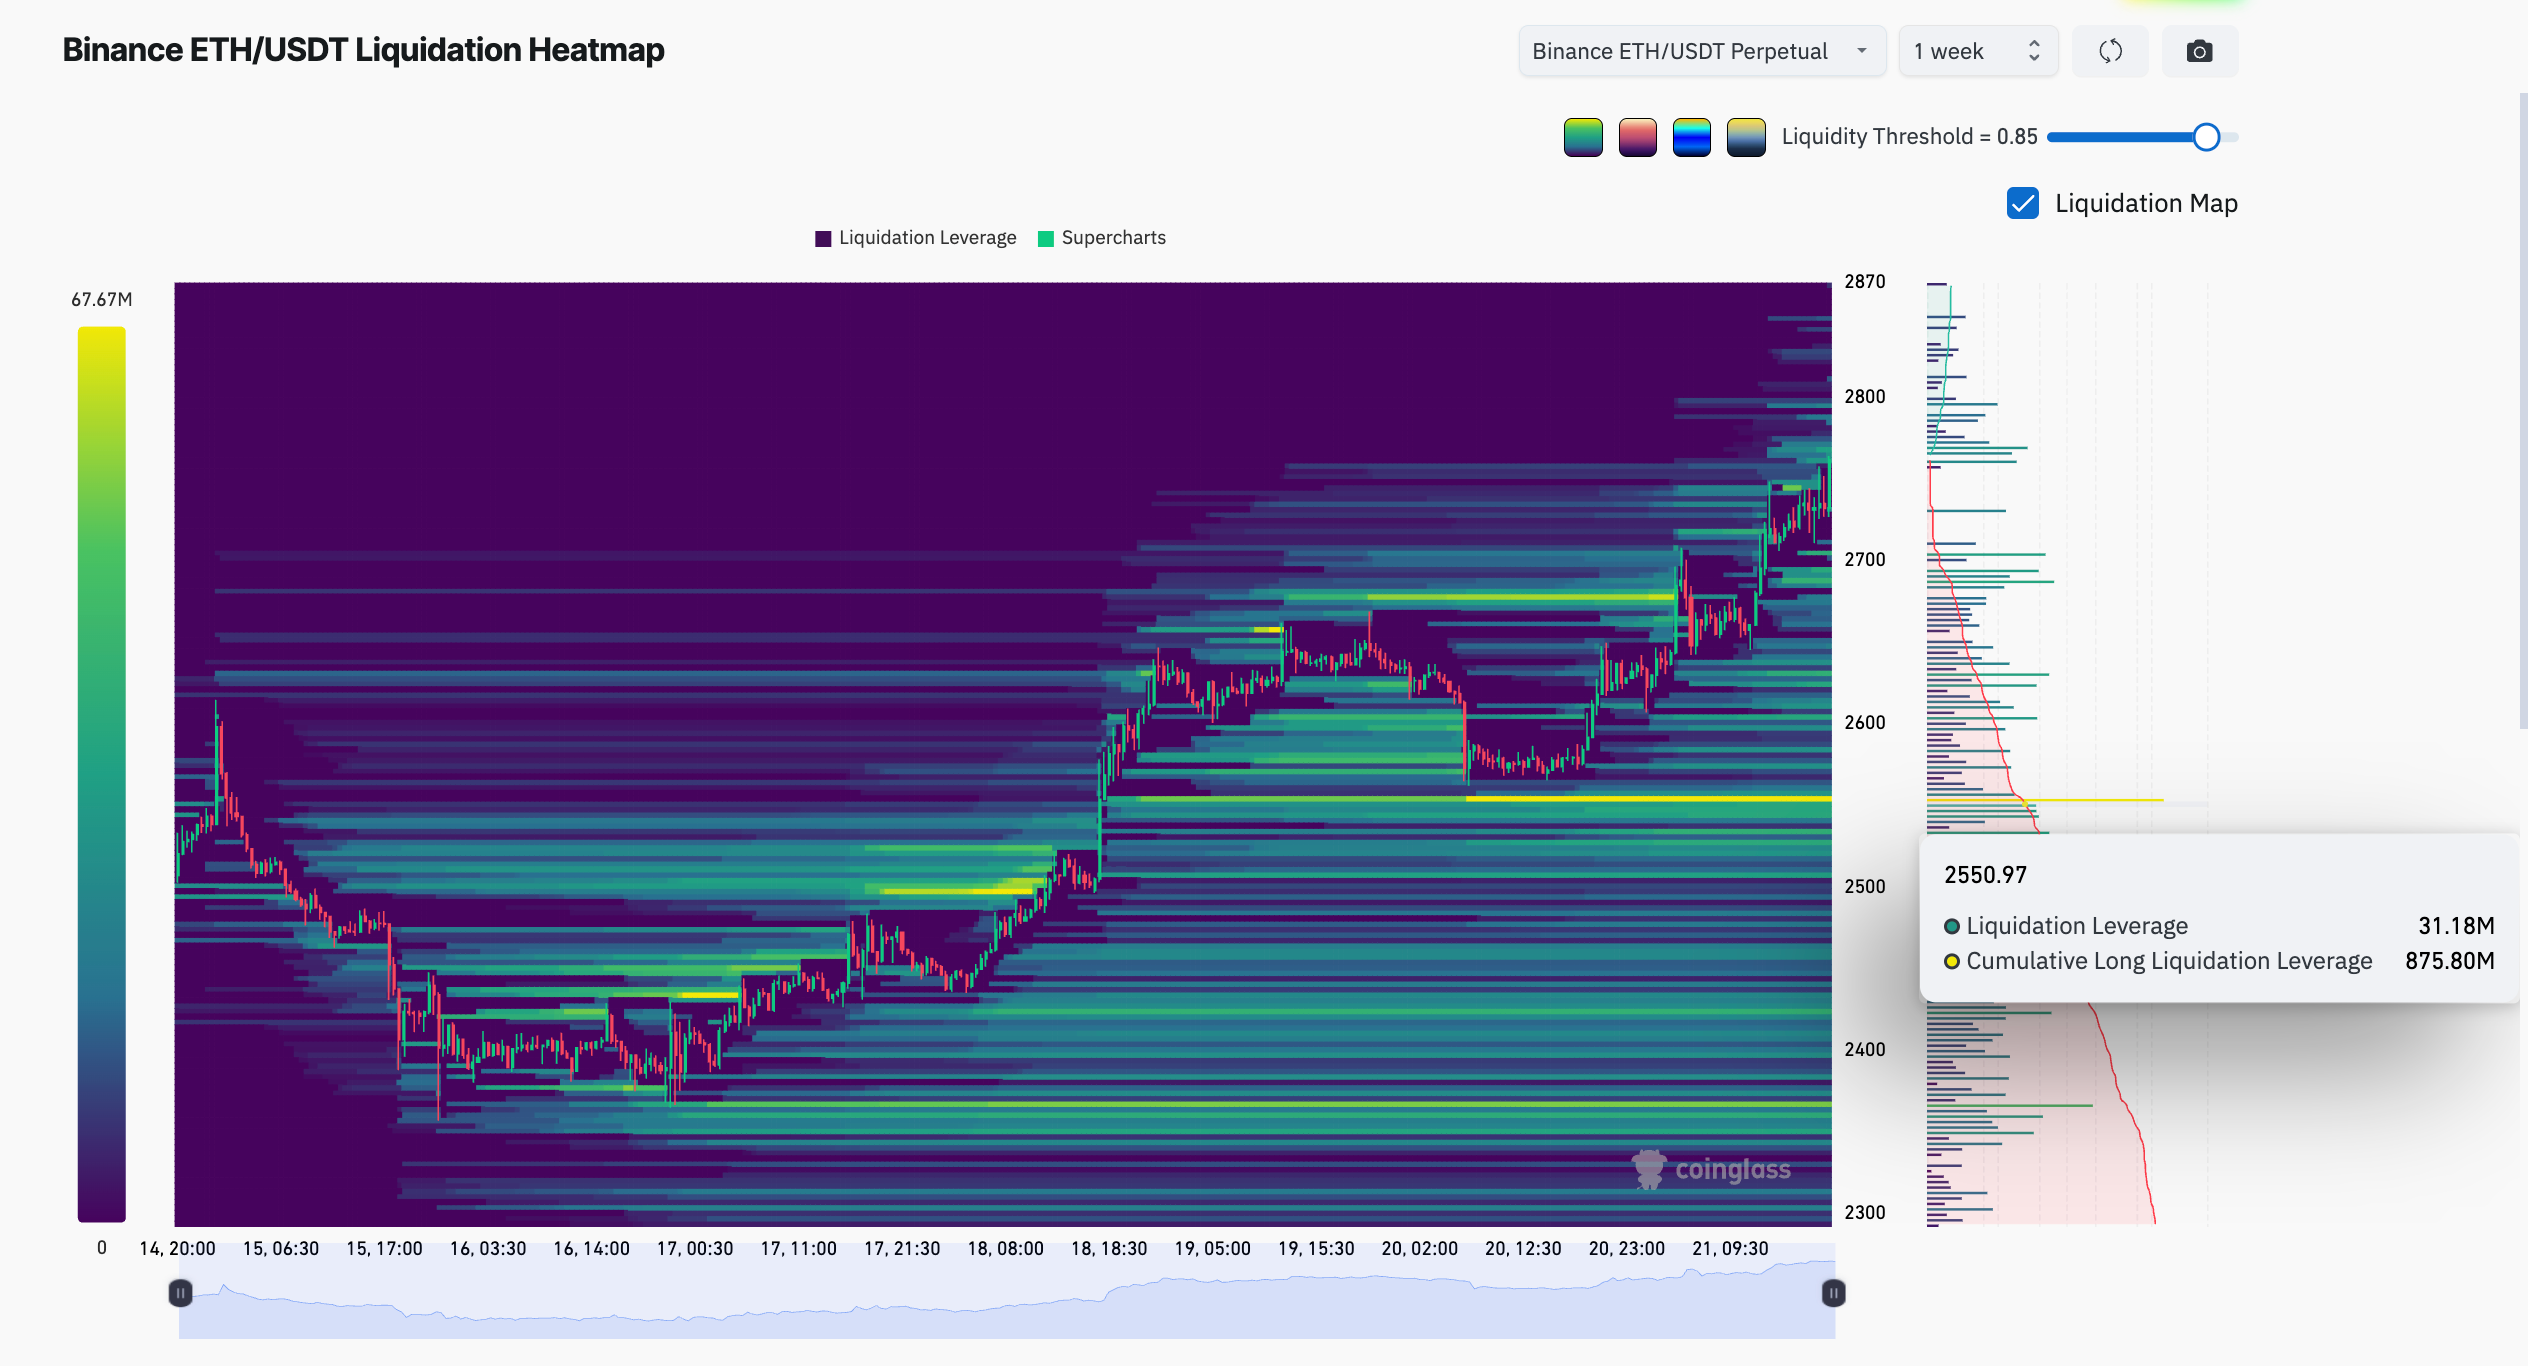
Such zones can act as downside “magnets” because a move into them forces exchanges to close overleveraged long positions, adding market sell orders and potentially accelerating the decline through a liquidation cascade.
Ethereum Price Forecast
Every new Ethereum analysis as it publishes, today's technical signal and key levels, live price — on one page.
See all Ethereum forecastsThe larger the liquidation cluster, the stronger the incentive for price to probe that area when bearish momentum builds, although the level should be viewed as a liquidity target rather than a guaranteed destination.