


Multi-Timeframe Breakout Revives Bullish Trend
Hut 8 Corp. (HUT) operates large-scale power and data center assets for Bitcoin mining, AI training, and cloud hosting. Its long-term pattern remains bullish, with the stock now triggering a trend-continuation signal after testing support at key levels on both the short-term daily and long-term weekly timeframes.
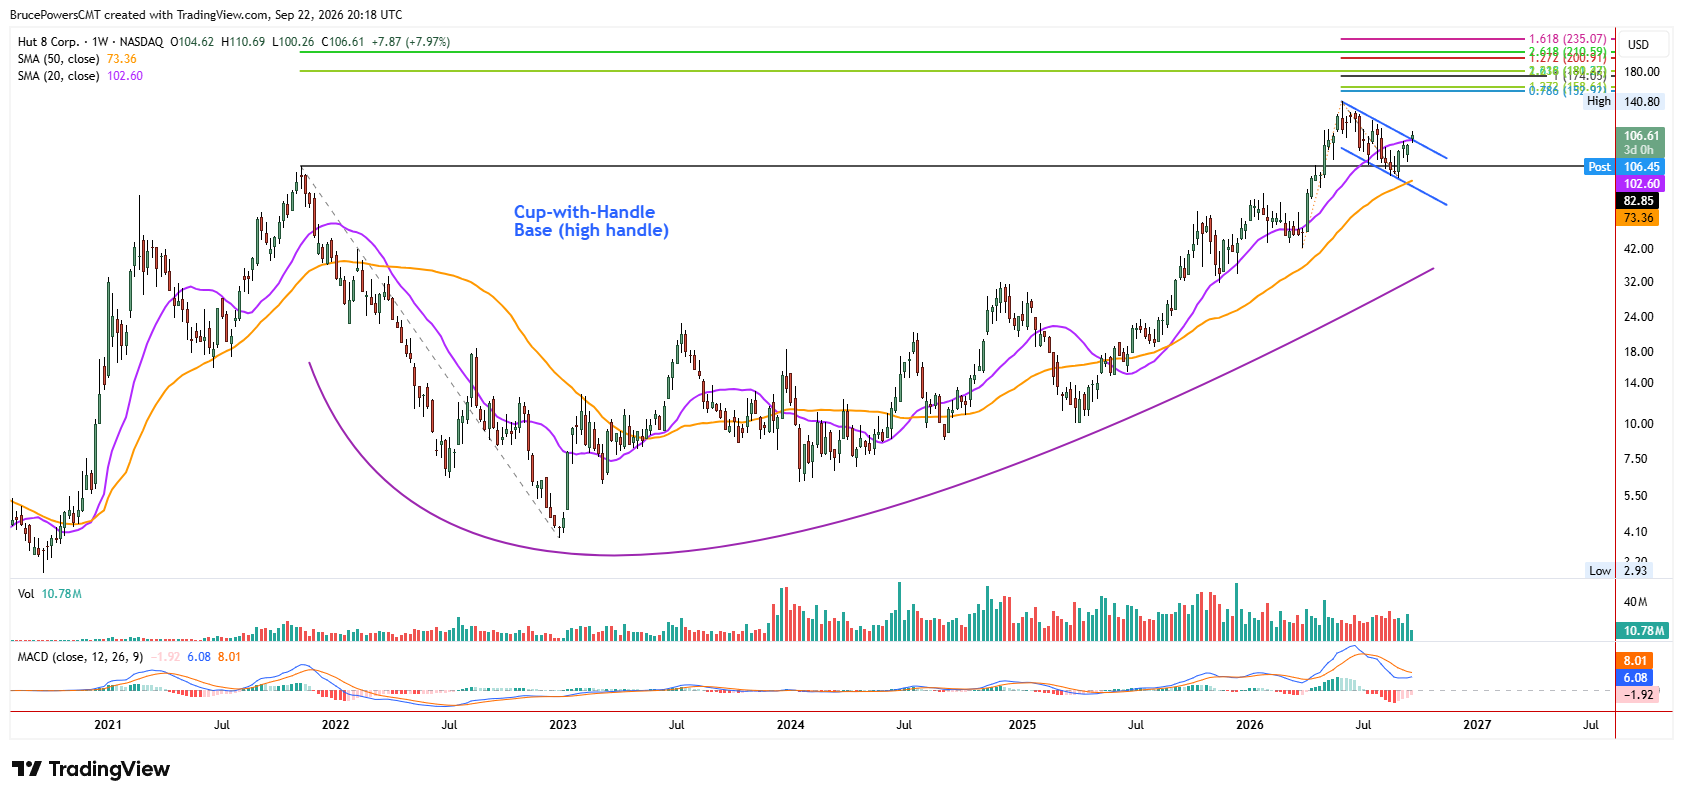
HUT broke out of a large multi-year basing pattern on a decisive move above the 2021 high of $82.85
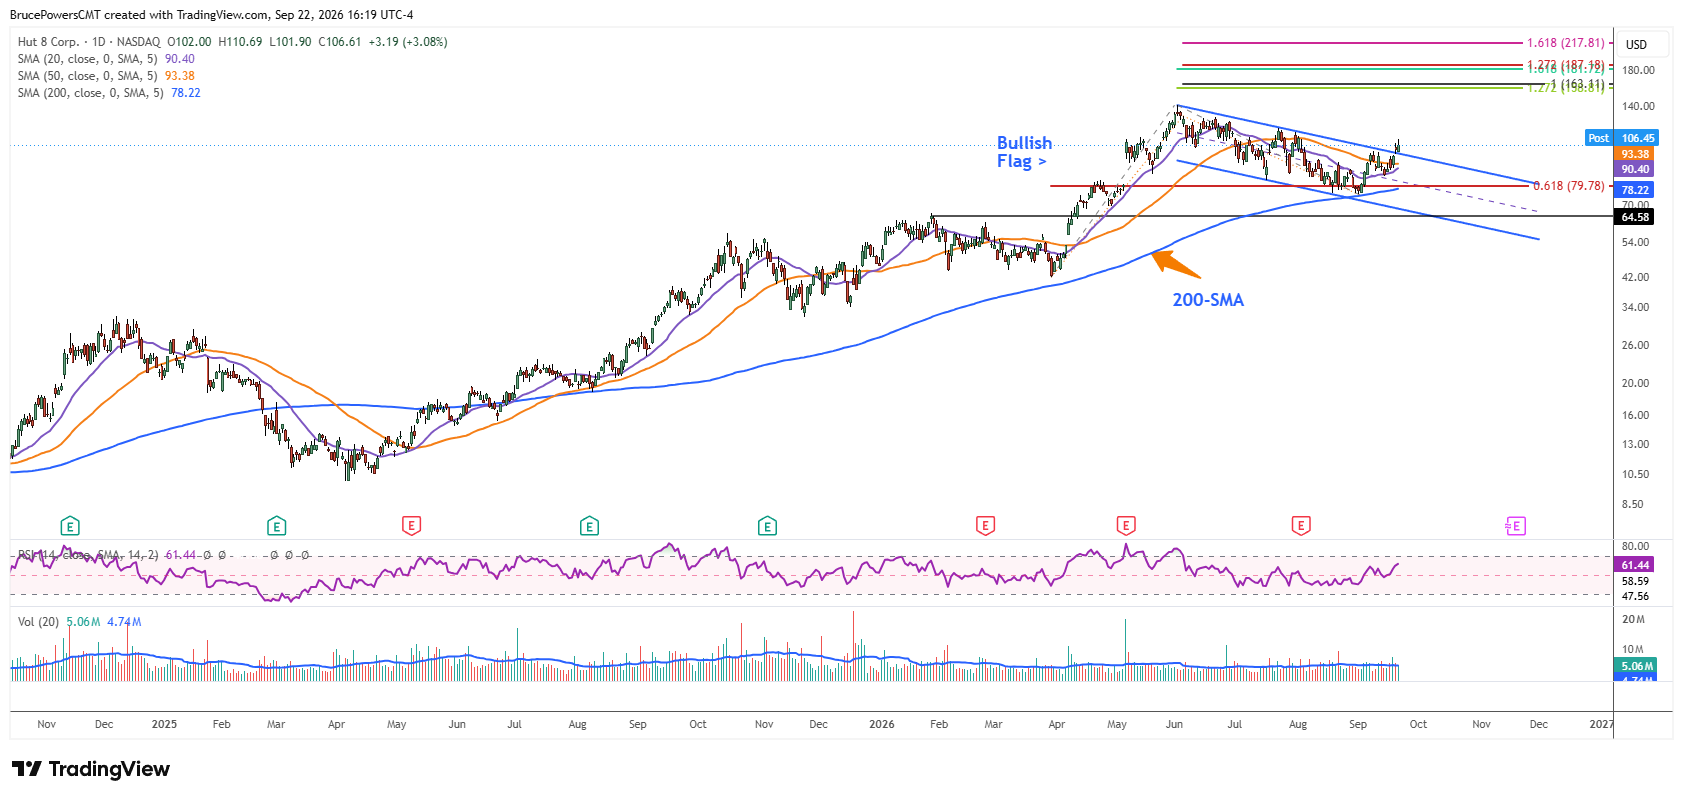
to reach a new record high in May. Subsequently, a new high of $140.80 was reached in June, leading to an approximately 61.8% Fibonacci retracement of the prior advance and the establishment of a higher swing low of $75.31 three weeks ago.

Cup-with-Handle Meets Daily Flag
The retracement took the form of a handle on the weekly chart, thereby establishing a cup-with-handle pattern with a high handle. On the daily chart, the same corrective structure can be considered a bullish flag. An upside breakout of the corrective pattern triggered on Monday with a rally above the recent lower swing high of $101.83 and the downtrend line. On the weekly chart, the breakout also reclaimed the 20-week moving average, providing additional confirmation of improving momentum.
Support Holds Across Timeframes
The alignment of the larger weekly pattern with the shorter-term daily pattern provides a stronger technical signal. The breakout of the large base suggests that another impulse leg up could follow a successful breakout. Moreover, the recent retracement found support at the 200-day moving average on the daily chart and near the 50-week moving average on the weekly chart, indicating that the underlying bullish trends remain intact.
Upside Targets Come Into Focus
The first upside target of note is the current high of $140.80. That is followed by the first confluence resistance zone near $153-$159, with the next resistance zone extending from around $174-$181. If HUT follows through to the upside as the developing patterns indicate that it might, it will be a classic example of a cup-with-handle bullish continuation setup. In that case, Monday’s breakout would mark the next potential impulse leg within the larger bullish trend, connecting the recent support test with the higher potential targets now developing.
If you’d like to know more about technical analysis and how traders use it, please visit our educational area.


