WMT Technical Analysis
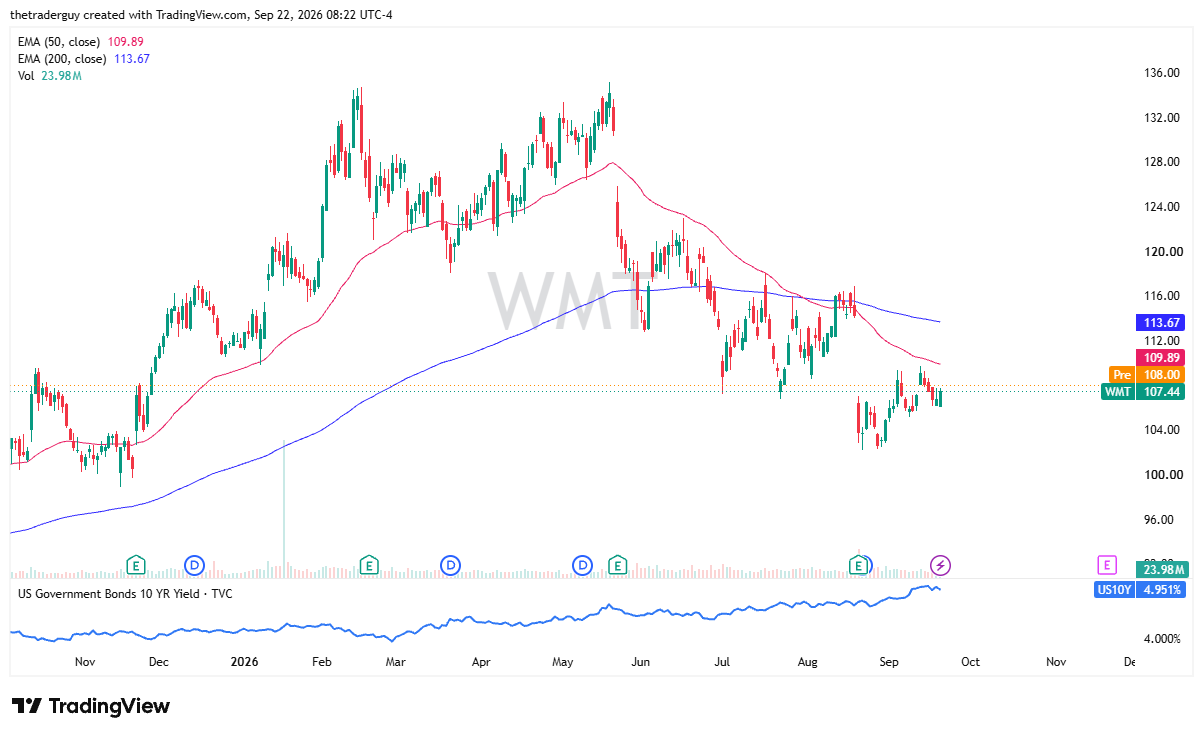
The pre-market for Walmart is somewhat positive, and it does look like the market is trying to turn things around after a pretty ugly drop right around earnings a couple of weeks ago.
Ultimately, this is a theme in the sector. There were some concerns about rising interest rates and damage to the consumer in America. But I can assure you, as somebody who lives in America, people have not stopped buying. Therefore, value hunters have stepped into Walmart to perhaps try to take advantage of its massive consumer base.
There were some concerns about rising interest rates and damage to the consumer in America.
The 50-day EMA at $109.89 is a little bit of a barrier, but there is still a gap that has yet to be filled that goes all the way to the $115 level. Earnings are out of the way, and rates have drifted a little bit lower, so perhaps Walmart could find a bid.

TGT Technical Analysis
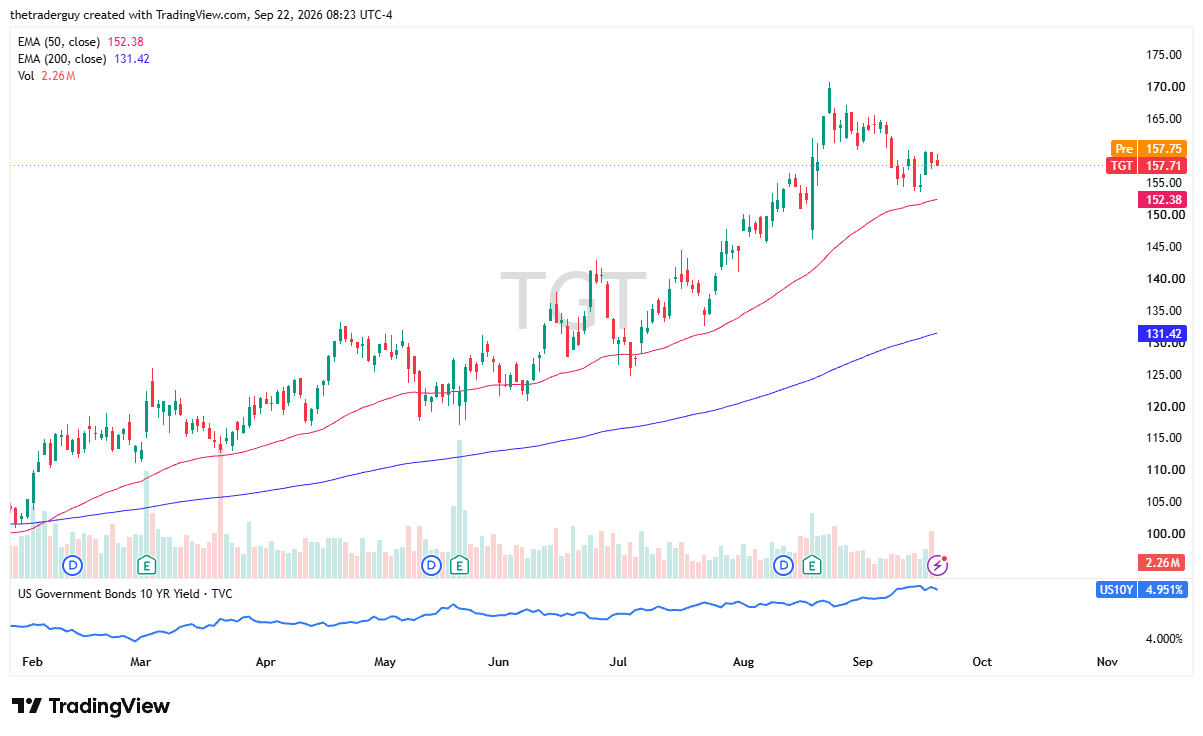
Target looks like it’s going to open up roughly about the same as it closed. That being said, there’s a massive bullish flag on Target that suggests that perhaps, at least from a technical analysis standpoint, the market could go much higher. The only thing missing here, of course, will be momentum.
But it’s worth noting that we’ve been in an uptrend for quite some time, and we do have the 50-day EMA at $152.38 coming into the picture to offer a little bit of support. So that might be worth watching as well.
COST Technical Analysis
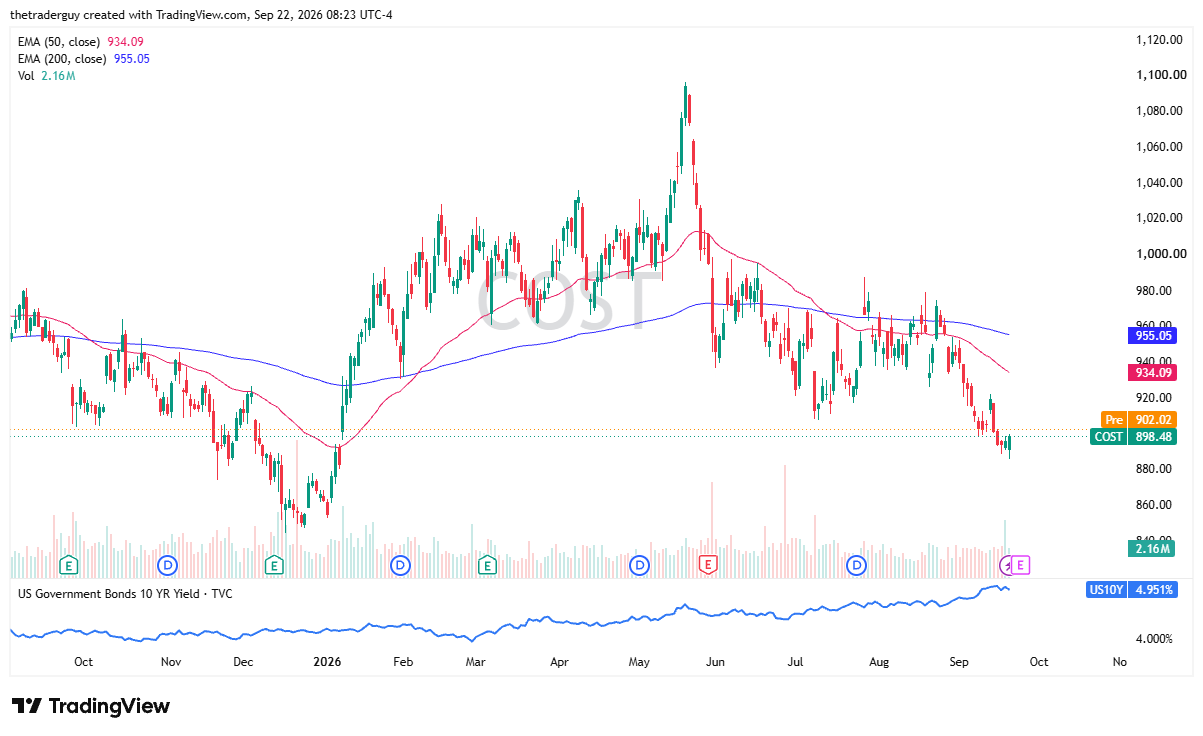
Finally, Costco looks like it’s going to jump a little bit at the open. This is a market that recently had broken structure, but it has an earnings call on Thursday, and that could make this a potential surprise. If the earnings call comes out better than anticipated, those sellers may find themselves in trouble.
It’s Thursday after the bell. Earnings estimates are $6.53 per share, with revenue at $94.86 billion. Keep in mind, though, a lot of attention will probably be paid to forward guidance. There seems to be a lot of concern out there, but if Costco can really beat that earnings call, it could be a solid move.
Between now and then, we could see a little bit of short covering. That might be part of what we’re seeing now.
If you’d like to know more about technical analysis and how traders use it, please visit our educational area.