NASDAQ 100 Technical Analysis
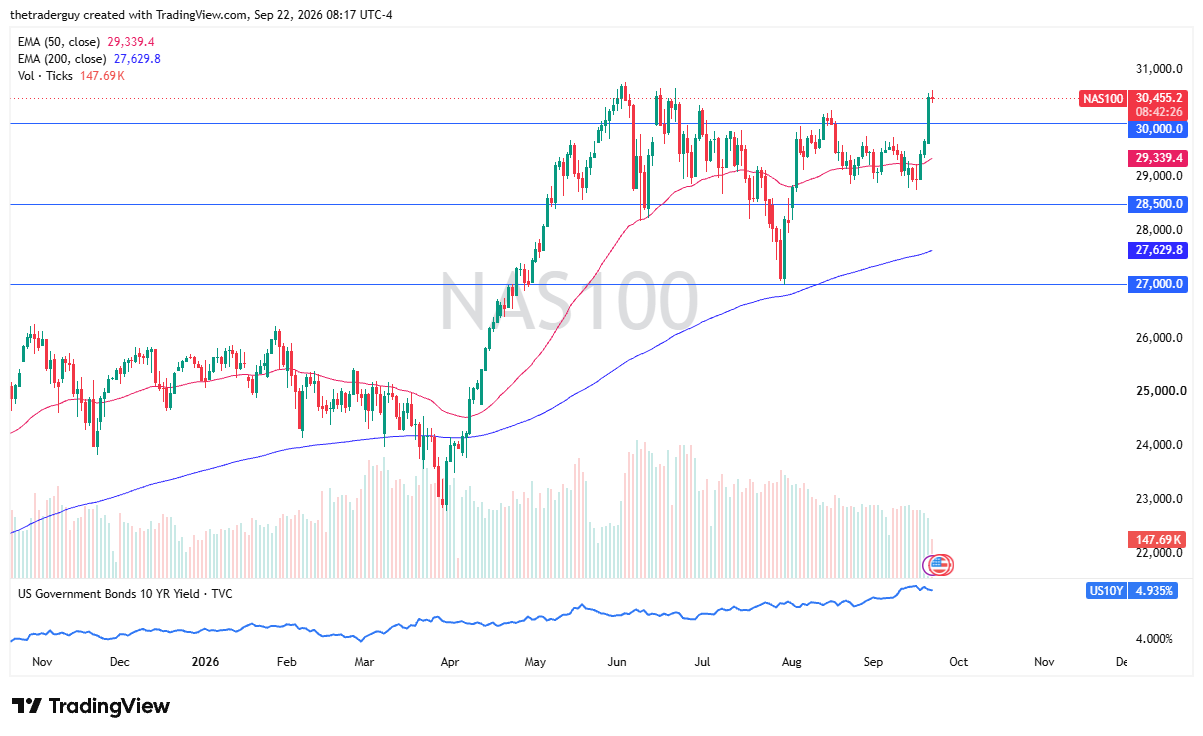
The Nasdaq 100 is showing a little hesitation during the early part of the session. Ultimately, this is a market that has gone straight up in the air for 3 previous sessions. A little bit of a pullback probably would make a certain amount of sense. If we do pull back, one would have to think that the 30,000 level will offer support. If we were to pull back from here and bounce, that opens up the possibility of more traders coming in and taking advantage of an obviously bullish attitude in this market.

Dow Jones 30 Technical Analysis
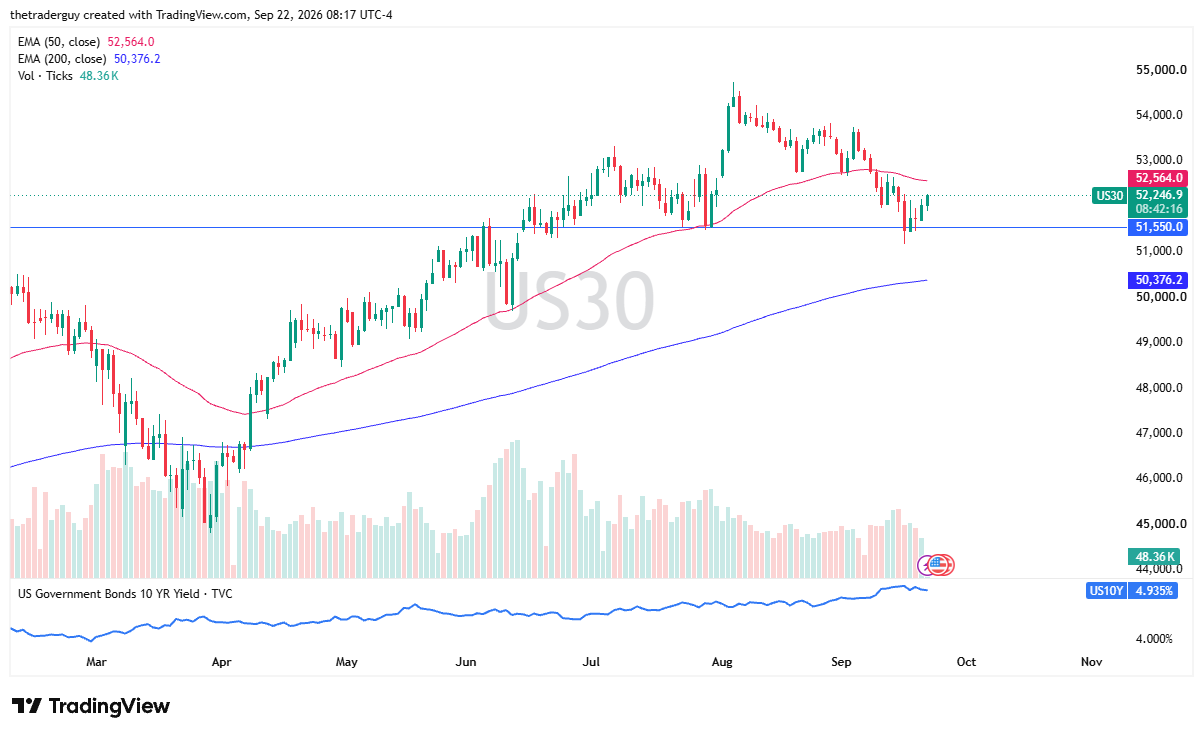
The Dow Jones 30 looks like it is going to continue to try to push to the upside. It has been positive so far during the session after bouncing from that crucial 51,550 level. The 50-day EMA sits just above, and breaking above the 50-day EMA could open up the possibility of a move toward the 54,000 level. Ultimately, this is a market that I think continues to see a little bit of value hunting, and it is possible that we have just formed a massive double bottom.
S&P 500 Technical Analysis
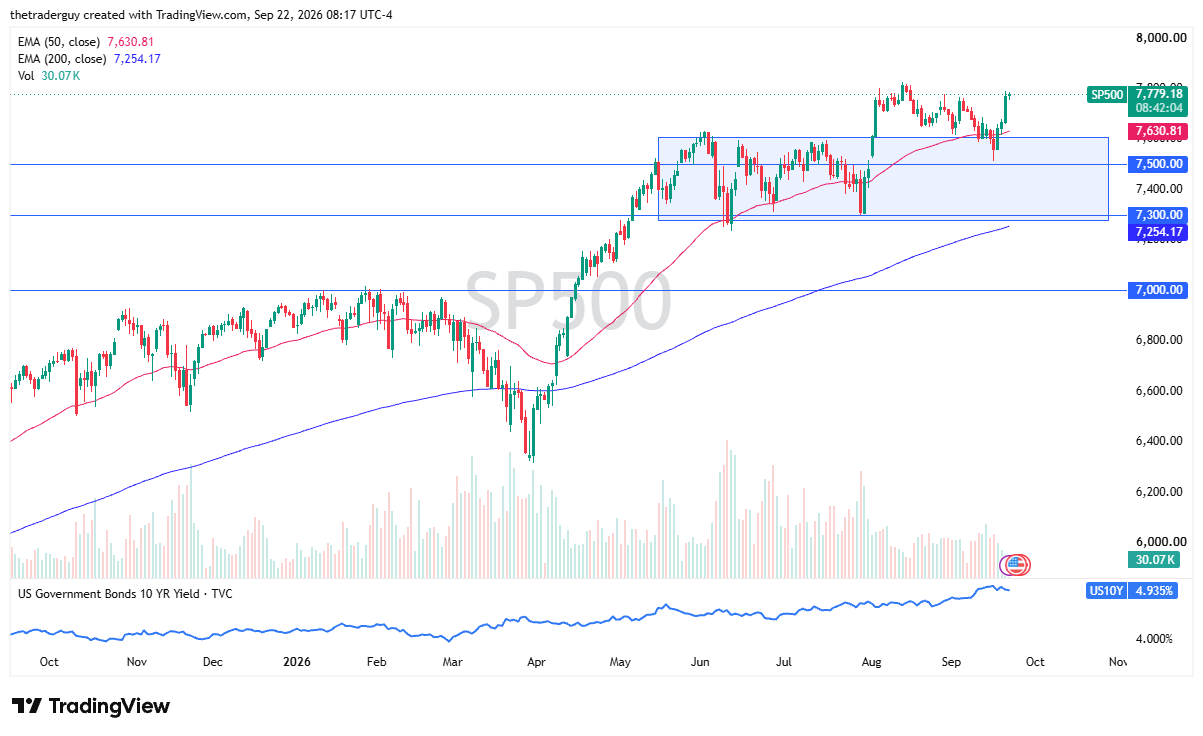
The S&P 500 finds itself grinding a little to the upside as the market is trying to break out to a fresh new high. We will have to see whether or not it can actually happen, but it certainly looks positive. With interest rates dropping, that gives it a little more incentive to perhaps rally.
S&P 500 Price Forecast
Every new S&P 500 analysis as it publishes, today's technical signal and key levels, live price — on one page.
See all S&P 500 forecastsEither way, the S&P 500 looks bullish to me. I have no interest in shorting. Short-term pullbacks, more likely than not, will be thought of as buying opportunities, and a simple momentum play here could be a thing as well.
If you’d like to know more about chart patterns and how to trade them, please visit our educational area.