
Natural Gas Stopped Falling and Nobody Called It a Rally
October natural gas dropped 2.61% Monday and gave back 0.56% of it Tuesday. That is not a reversal. The contract is sitting near Monday’s low at $2.852 while Cove Point maintenance pulls LNG feedgas lower and domestic output dips modestly off last week’s highs. One force took demand away and the other gave a small amount of supply relief. The market treated it as a draw and went flat.
At 13:34 GMT, October natural gas futures are trading $2.852, up $0.016 or 0.56%. The session high is $2.860 and the low is $2.852.

Cove Point Maintenance Took the LNG Bid Away at the Wrong Time
LNG feedgas demand dropped to about 18.2 bcf per day, down 6.8% from a week ago. Cove Point is using less gas during maintenance and that leaves more supply inside the domestic market right when the late-summer cooling load is fading.
The South and Southeast are still warm with highs in the 80s and 90s through the end of the month. Some 100-degree readings are in the forecast. The rest of the country is in the 60s through 80s. Not the kind of heat that moves the needle on power burn. The Northeast has some cooler air but nothing cold enough to start heating demand. Cooling is winding down. Heating has not started. Every bcf that Cove Point is not pulling shows up in a market that has nothing else to absorb it right now.
Production Dipped Off the Highs and Producers Keep Adding Rigs
Lower-48 dry gas production was 112.8 bcf per day Monday, up 4.0% from a year earlier. That is down from recent levels. It is still a big number heading into the period when injections usually slow.
Baker Hughes had 134 active natural gas rigs last week matching the three-year high from February. At $2.85 producers are still adding iron. The EIA raised its 2027 production forecast to 116.0 bcf per day from 115.3 bcf per day in July. The slight dip in daily output is noise against a backdrop where the rig count is at a three-year high and the government just raised next year’s production estimate.
Natural Gas Price Forecast
Every new Natural Gas analysis as it publishes, today's technical signal and key levels, live price — on one page.
See all Natural Gas forecastsDemand came in at 74.1 bcf per day, up 7.9% from a year ago. The number looks strong. It includes a market that still has some cooling load. When the South loses the heat later in October that demand number comes down.
Thursday’s Storage Report Is the Next Trigger
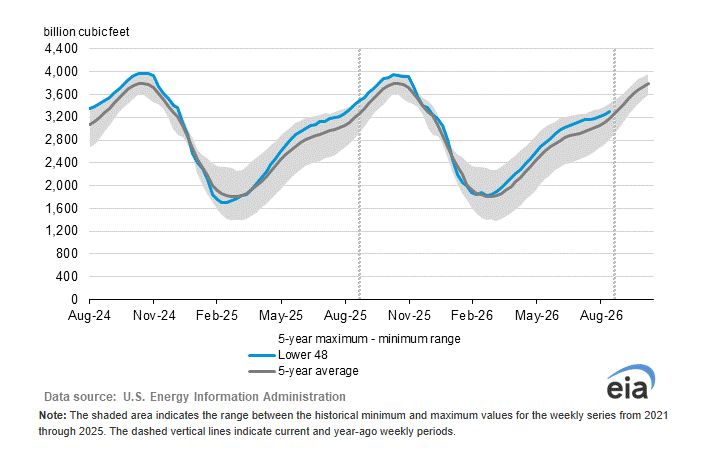
Last week’s 44 bcf injection came in below the 48 bcf estimate and well under the five-year average build of 74 bcf. That gave bulls a reason to push back last week. The support lasted about two days before Monday’s sell-off erased it.
Inventories are 3.7% above the five-year seasonal average. The EIA projects end-of-October storage near 3,985 bcf, the highest in a decade. Thursday’s estimate is for a 55 bcf build. A number below that keeps the “builds are slowing” argument alive. A number above it puts the shoulder-season surplus right back in front of the market.
Europe Broke 7% Monday and the El Niño Forecast Is Hanging Over the Curve
European natural gas prices fell about 7% to a two-week low Monday after reports of possible U.S.-Iran progress reduced the risk premium in global energy. When European gas breaks that hard it takes some of the support out of the global LNG story. U.S. futures did not need help selling off with domestic demand already weakening.
European storage is about 70% full against an 85% five-year average. The deficit is real. Monday showed that a single diplomatic headline can overwhelm the inventory concern for a session.
The Super El Niño forecast is the medium-term risk pressing on the deferred contracts. A warmer Northern Hemisphere fall and winter means heating demand arrives late and runs below normal. That is not why October is trading at $2.85. It is why March 2027 keeps making new lows.
Power Burn Is the One Number That Has Not Cracked
The Edison Electric Institute had lower-48 electricity output up 16.1% from a year earlier at 94,427 gigawatt hours in the week ended September 12. Trailing 52-week generation was up 3.3%. Power demand is the reason the market did not collapse through Monday’s low. It is running better than a year ago and the Gulf Coast heat through the end of September keeps it from falling off immediately.
The Commodity Weather Group has above-average temperatures across the Gulf Coast late this month. That is not a broad national heat event. It prevents the demand picture from going completely one-sided before Thursday’s report.
Daily October Natural Gas Technical Analysis
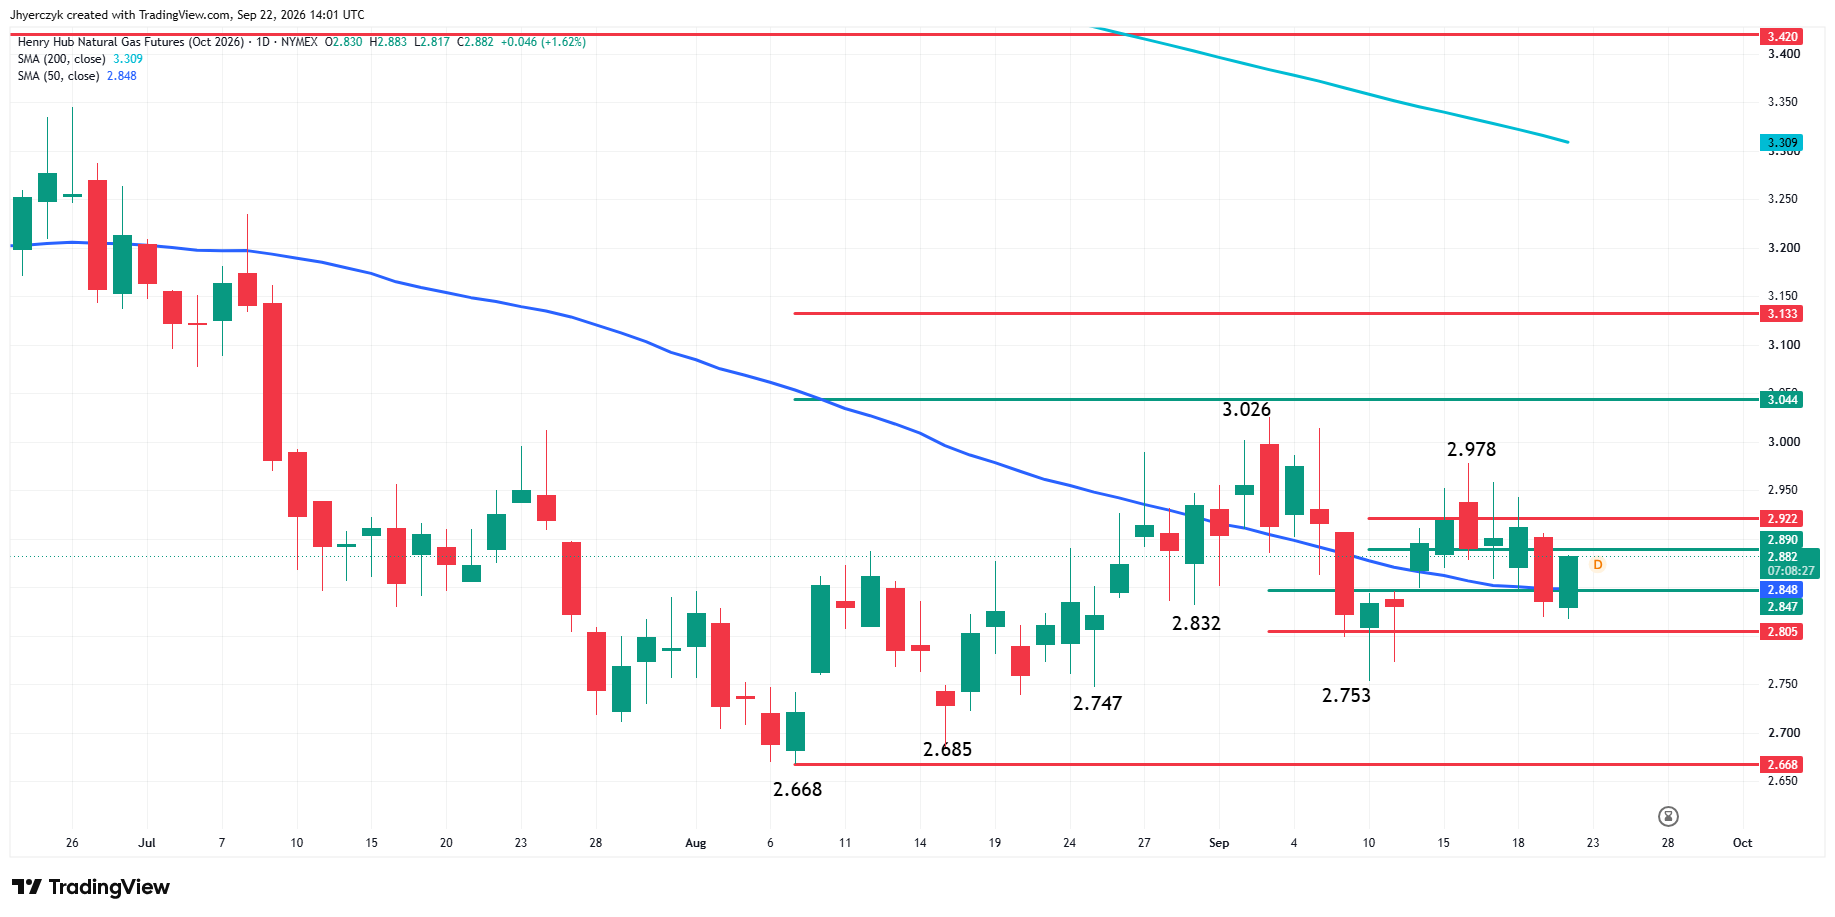
October natural gas futures are edging slightly higher on Tuesday after recovering from an early session setback. The main trend is down according to the daily swing chart. A trade through $2.978 will change the main trend to up. A move through $2.753 will reaffirm the downtrend.
The market is also straddling the 50-day MA at $2.848, which is likely to determine the direction of the trade into the close.
Support is being provided by the minor retracement zone at $2.847 to $2.805. Resistance is the minor retracement zone at $2.890 to $2.922.
My bias is to the downside because the market is under the control of a downtrending swing chart. A sustained move under the 50-day MA is likely to increase the odds of a near-term test of the main bottom at $2.753. Overtaking the 50-day MA will weaken the outlook slightly but natural gas will still face headwinds at $2.890 and $2.922 before threatening the swing tops at $2.978 and $3.026.
What to Watch
Thursday’s storage report and the weather forecast into early October are the two events that settle the near-term trade. A build below 55 bcf with the Gulf Coast heat holding would keep the “injection pace is slowing” case alive. A larger build with Cove Point still offline would tell the market that the LNG demand loss is showing up in storage. Power burn and the Gulf Coast forecast through September 30 decide how fast the cooling load fades. Once it is gone the market is left with production near 113 bcf per day, feedgas near 18 bcf per day, and no weather demand to offset either one.
The 50-day at $2.848 is the pivot into the close. The swing chart is bearish. Sellers own the trade as long as the retracement zone at $2.890 to $2.922 holds as resistance. Below the 50-day, the $2.847 to $2.805 zone is where the next stand happens. A break through $2.805 opens the path to the $2.753 main bottom. Buyers need $2.922 before the chart improves. Tuesday’s bounce has not come close to that.
More Information in our Economic Calendar.