Gold Technical Analysis
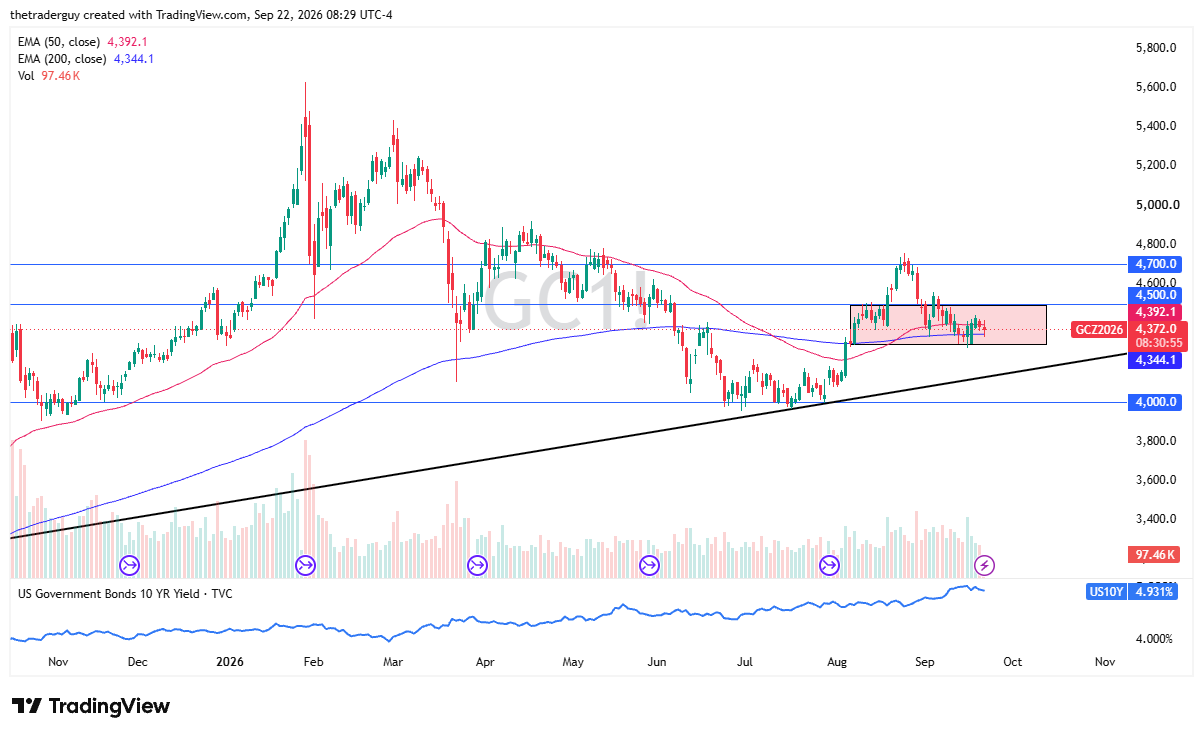
The gold market has chopped back and forth in the early hours here on Tuesday, as we are stuck between the 50-day EMA and the 200-day EMA indicators. That is something worth watching because, quite often, although not always, the market will squeeze out of that area. This market is currently waiting for some kind of reason to form a trend at this point in time.

Gold Is Still in the Middle of a Range Between $4,500 and $4,300
I think ultimately this is a market that will continue to obey those boundaries, at least until we get some type of certainty. Interest rates in America have drifted a little bit lower, so that does somewhat help gold. But ultimately, it’s probably worth noting that there are still a lot of concerns in the world with energy inflation.
That energy inflation, of course, is a major problem and a major contributor to how gold has been behaving. So, with this, I like the idea of buying gold on dips, selling it on rallies, and sticking to short-term charts because, quite frankly, I don’t know that it’s going to be an easy trade anytime soon.
With that being said, I remain fairly neutral on gold, but I do like it longer term, so that’s something that I keep in the back of my mind anytime I am trading this market. The gold market will continue to be moved by headlines, interest rates, and the US dollar. Gold continues to be attractive from a long-term perspective, but we still have many factors at play.
If you’d like to know more about how to trade gold and silver, please visit our educational area.