Constructive Pullback Holds Key Support
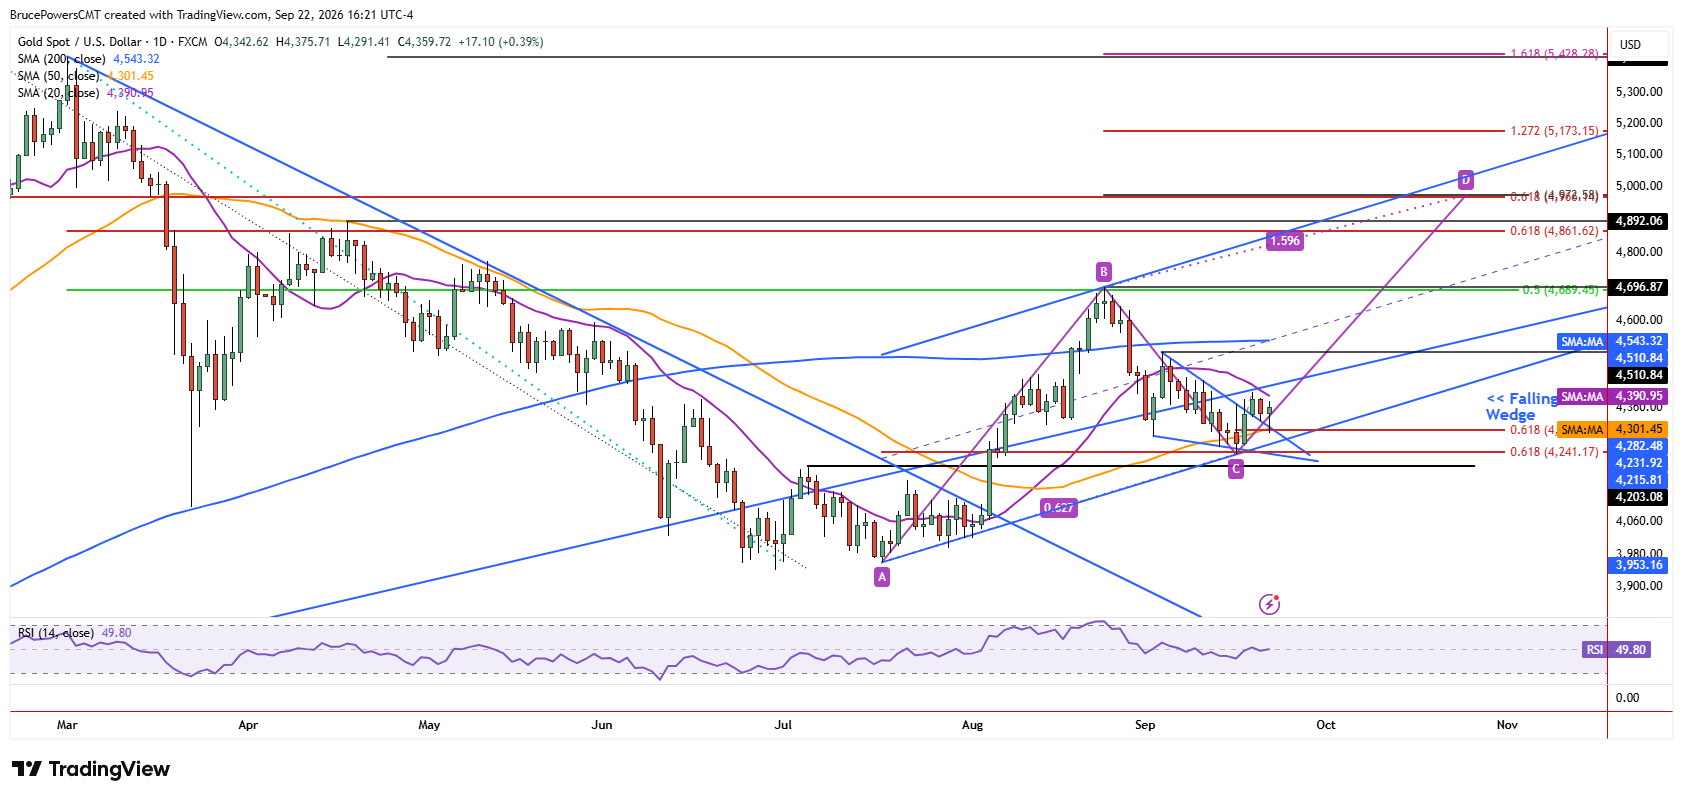
Although continued strengthening in the U.S. dollar kept pressure on gold during Tuesday’s session, the metal continued to show signs of underlying strength. Gold showed constructive digestion of recent gains with a pullback to a three-day low of $4,291, successfully testing support at the confluence of several indicators. A bullish reaction followed, suggesting that a first pullback following an upside breakout of a falling bullish wedge may now be in place.

Confluence Zone Signals a Potential Sentiment Shift
The confluence of indicators marking a potential support zone makes Tuesday’s low particularly significant. Also, the successful test of support at the 50-day moving average plays an important role in signaling a potential shift in intermediate-term sentiment from bearish to bullish. The 50-day moving average represents dynamic intermediate-term support, and its ability to hold suggests that the market is beginning to recognize this level of support. Short-term support was defined by the 61.8% Fibonacci retracement at $4,298, along with the upper boundary of the falling wedge pattern.
Higher Swing Low Strengthens Bullish Case
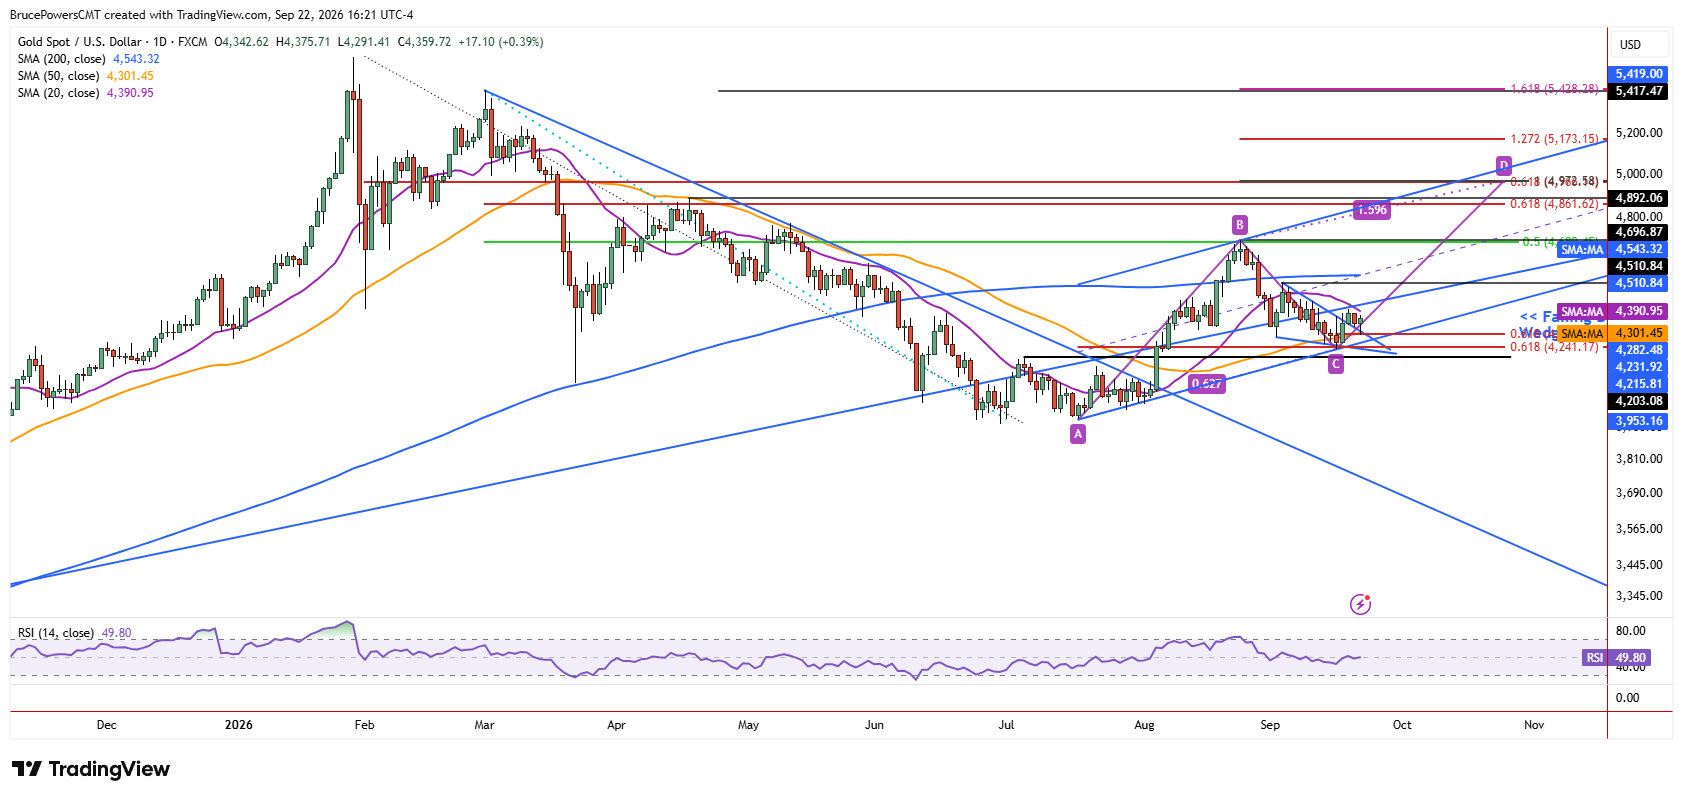
Nonetheless, the higher swing low of $4,235 established last week showed the early stages of an advance that may lead to a second upswing following the July bottom. With Tuesday’s confluence zone now having held as support, the bullish implications of the wedge breakout need to be confirmed by subsequent price action. Short-term support is at Tuesday’s low of $4,291. As long as gold remains above that level, the short-term bias remains to the to the upside.
Bullish Flag Sets Up Next Trigger
A two-day pullback into key trend support has also established a small bullish flag pattern, which would initially trigger on a rally above Tuesday’s high. Strength would then be indicated on a rally above the recent high of $4,399, signaling a continuation of the short-term advance while also reclaiming the 20-day moving average and a declining trendline.
Recovery of these levels would then put gold on track to test resistance near the recent lower swing high of $4,511 and the 200-day moving average near $4,543. Such a move would provide further confirmation that the recent pullback was constructive digestion of gains rather than a reversal of the developing bullish trend.
Gold Price Forecast
Every new Gold analysis as it publishes, today's technical signal and key levels, live price — on one page.
See all Gold forecastsIf you’d like to know more about how to trade gold and silver, please visit our educational area.