Gold Slips as Fed Hike Talk Keeps Sellers Interested
Gold broke through the 50-day moving average early Tuesday and found buying below it before the move could reach the September low. Sellers had the rate trade, the dollar, and yields all pointed their direction. The break lasted two hours. By midday gold was back above the average and the chart looked the same as it did Monday. The daily swing chart is still down. The latest rally still failed before it could take out the prior top. The first real test of the average attracted real buying and that is the only thing that changed Tuesday morning.
At 13:01 GMT, Spot Gold is trading $4,333.94, down $9.61 or -0.22%. The session high is $4,376.01 and the low is $4,291.50.

Daily Spot Gold (XAUUSD) Technical Analysis
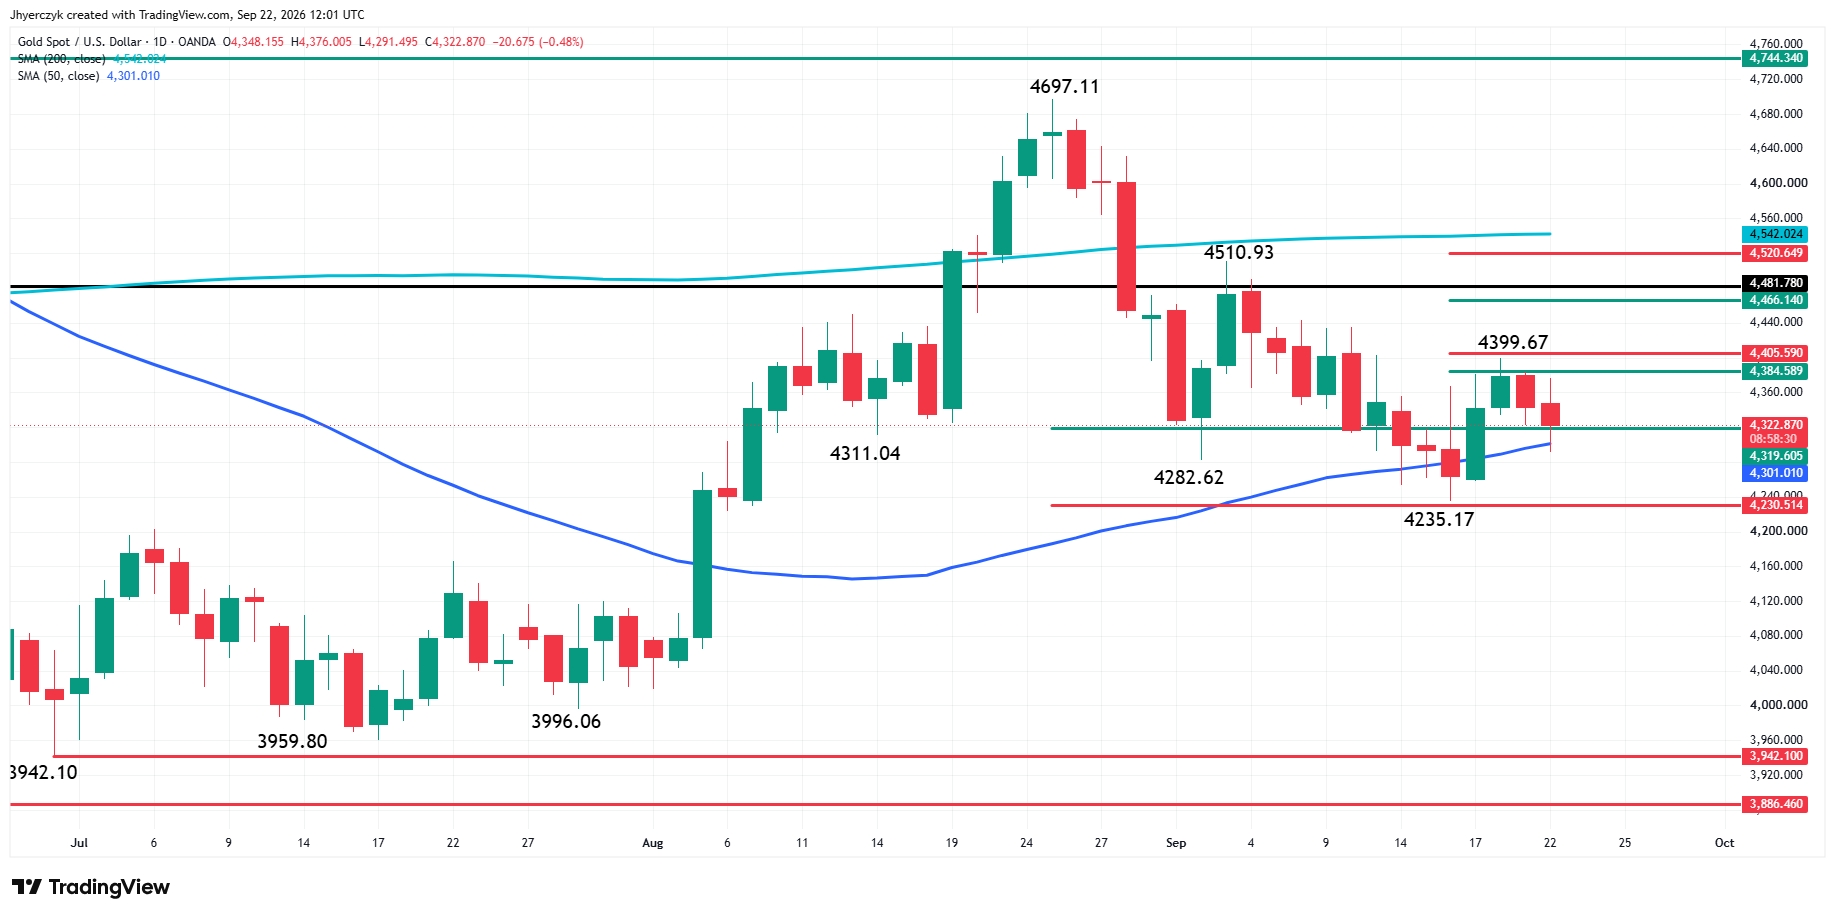
Spot gold is edging lower on Tuesday. The main trend is down according to the daily swing chart. Today’s early weakness made $4,399.67 a new main top. A trade through that level will change the main trend to up. A move through $4,235.17 will reaffirm the downtrend.
Standing in the way of the start of a clean break is a short-term 50% level at $4,319.60 and the 50-day moving average at $4,301.00. A break through the 50-day MA could trigger a sharp break into the support cluster formed by the main bottom at $4,235.17 and the 61.8% level at $4,230.51. The last level is a potential trigger point for an acceleration to the downside.
On the upside, the nearest resistance is a minor retracement zone at $4,384.59 to $4,405.59 and the swing top at $4,399.67.
My bias is to the downside because of the bearish trend indicator. It will strengthen if sellers can take out the 50-day MA.
Gold Price Forecast
Every new Gold analysis as it publishes, today's technical signal and key levels, live price — on one page.
See all Gold forecastsThe Fed Raised Last Week and Two Officials Want Another One
St. Louis Fed President Alberto Musalem said more rate hikes may be needed to bring inflation under control. Chicago Fed President Austan Goolsbee is looking at the demand side. Service-sector inflation and data center construction are on his list. He is asking whether the economy is producing beyond what it can handle and the tone says he thinks the answer is yes.
The Fed moved the policy rate to 3.75%-4.00% last week, the first increase since 2023. Chairman Kevin Warsh said more increases may be needed in the coming months. December hike odds jumped to about 90% from 80% a week ago. That 10-point move tells you rate traders took Warsh at his word and Musalem and Goolsbee spent Tuesday reinforcing the message.
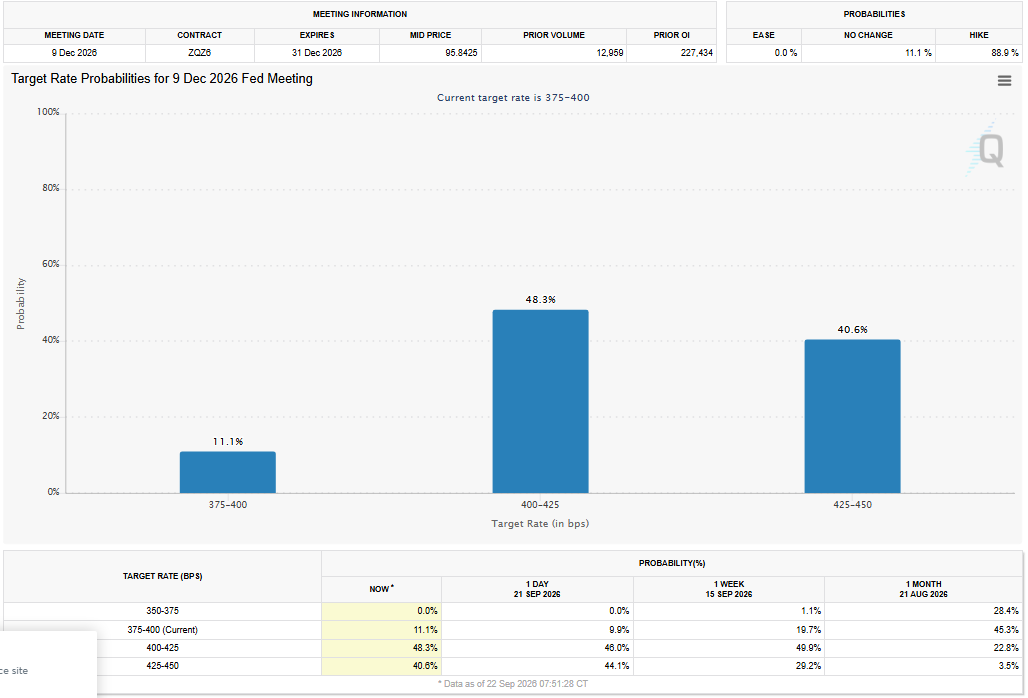
Fresh jobs data and more policymaker comments are ahead this week. If the numbers keep the demand argument alive, rate traders have no reason to back off. Gold trades against December at 90% until the data weakens that number. Nothing Tuesday weakened it. Two officials went out of their way to strengthen it.
The Dollar Ran to a New Recovery High and Gave It Back on the Iran Headline
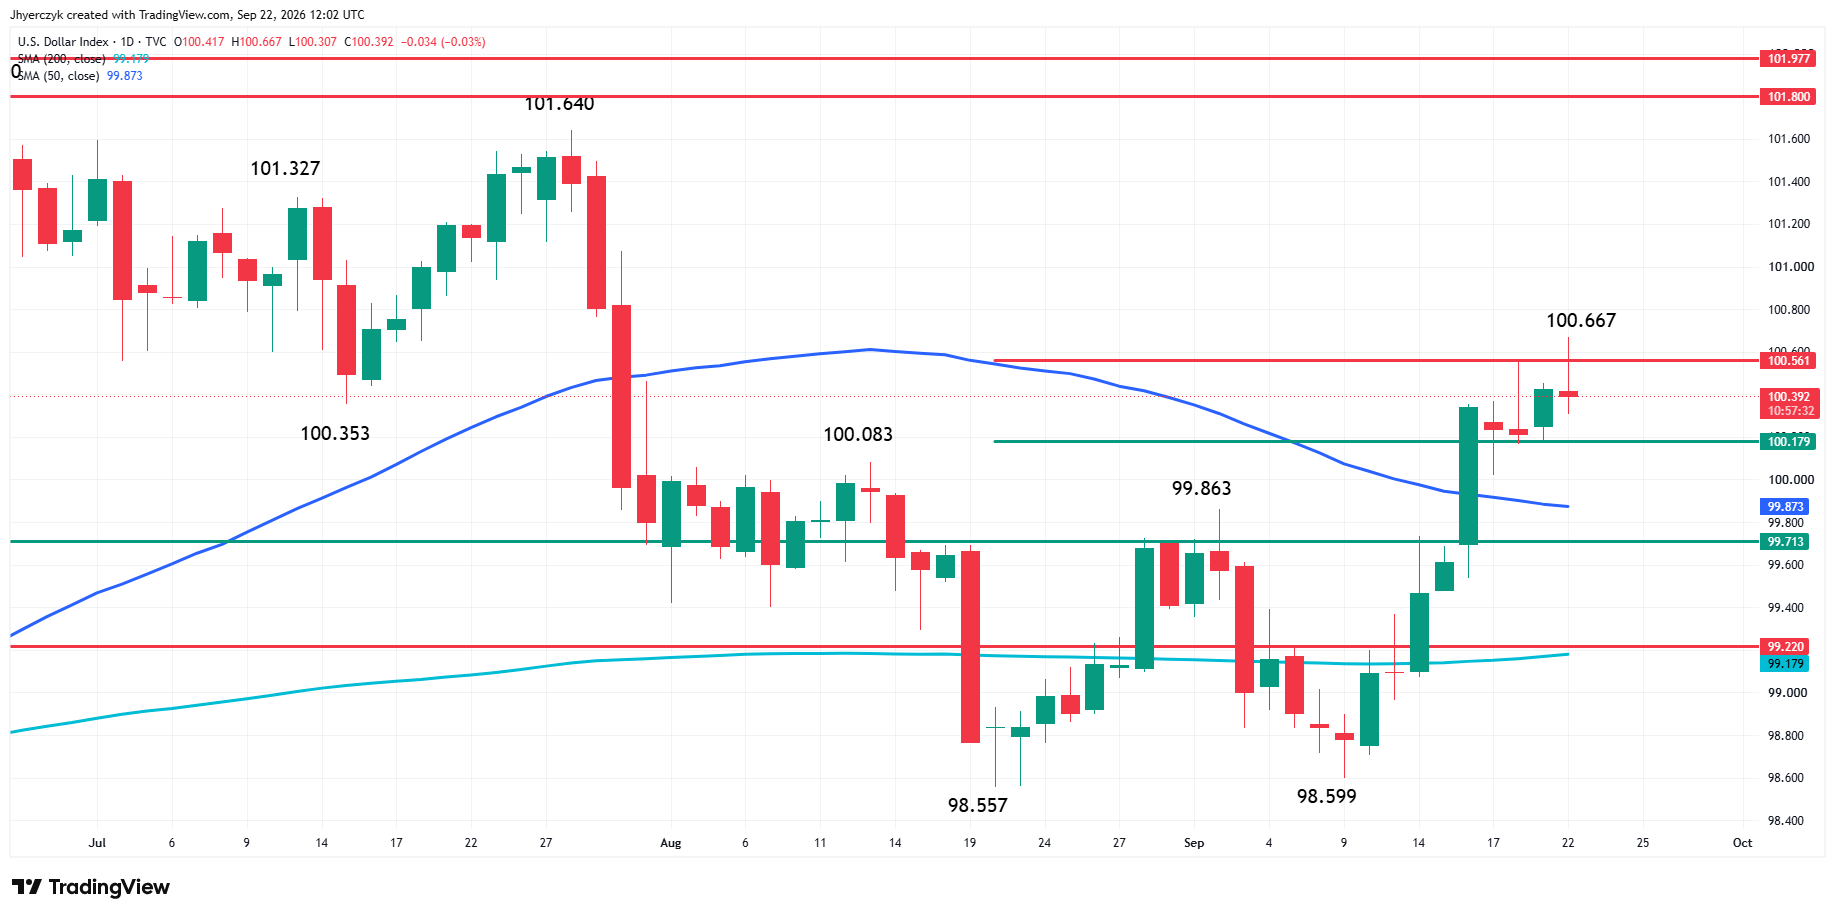
The Dollar Index pushed to 100.667 early Tuesday, through the 100.561 level and into the highest price since the September recovery started. Gold sold off on the move.
Then Kyodo News reported that an unnamed Iranian official said Iran could reopen the Strait of Hormuz within seven days if the United States eases military pressure. The report was not independently verified and Iranian sources denied it later. Crude dropped hard anyway. The dollar came off its high. Gold bounced.
DXY is back below 100.561 with a higher high and a lower close on the day. That is a potential closing price reversal top on the daily chart. The broader recovery is intact above 100.179 and the 50-day at 99.873. Tuesday was the first session since the rally started where the dollar cleared a level and could not hold it. The Iran headline did most of that work.
The United Nations General Assembly is running in New York. President Trump is meeting world leaders. Iranian President Pezeshkian is scheduled to address the assembly. Every headline out of those meetings can move crude, and what moves crude Tuesday morning also moved the dollar and gold in the same session. A denial or a fresh threat reverses the relief. A real diplomatic step extends it. The connections between those markets are running on headlines this week, not agreements.
The 10-Year Found a Floor and Stayed There
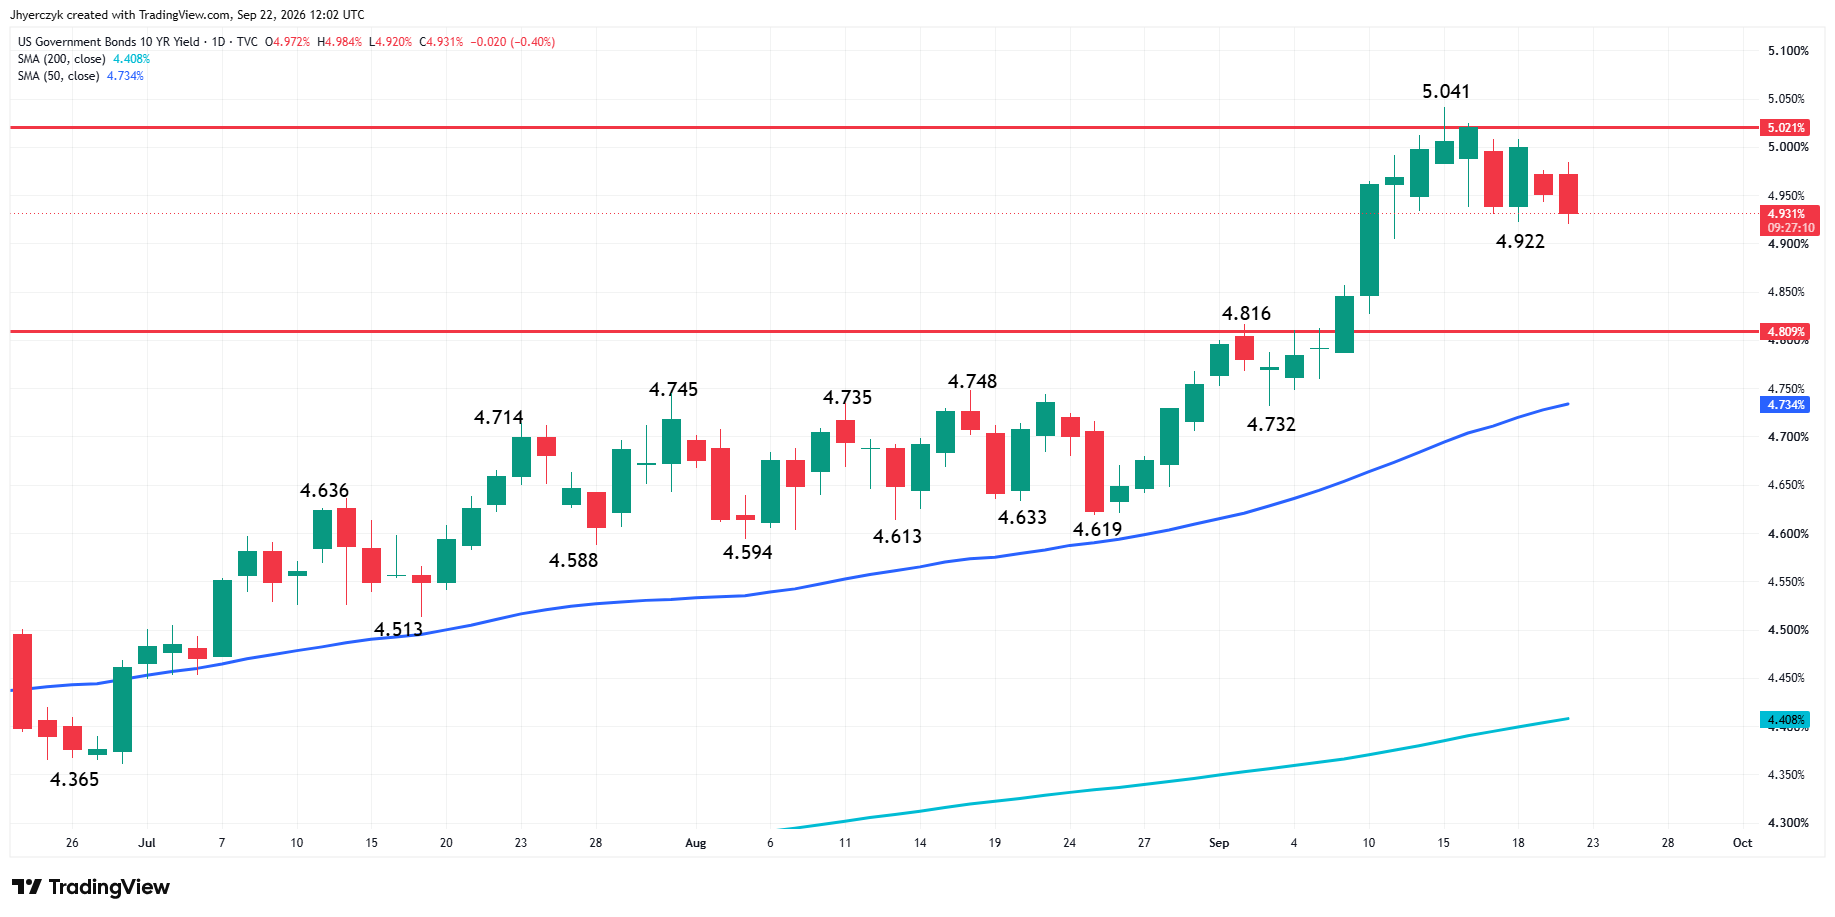
The 10-year yield slipped to 4.931% Tuesday after testing the 4.922% level that held last week. It held again. The 4.809% breakout level is below. The 50-day at 4.734% is well below that.
The yield market stopped pushing higher after reaching 5.041% last week. It has not retreated. The pullback found buyers at 4.922% twice in a row and held both times. Gold is trading against a yield that paused near the highs without giving ground. That is enough to stop a deeper sell-off in the metal. It is not enough to start a rally. Tuesday’s session proved both of those statements by midday.
What to Watch
The jobs data and Fed comments this week are the catalyst. December is priced at 90%. Musalem and Goolsbee spent Tuesday pushing the hike case harder. The data either keeps that number where it is or cracks it. Gold does not need a rate cut. It needs the next round of numbers to give the doves something Musalem and Goolsbee have not given them.
The UNGA sessions are the headline risk. Crude, the dollar, and gold all moved on the same unverified Kyodo report Tuesday morning. That chain runs both directions. The physical questions around Hormuz have not been answered. Tanker traffic, insurance costs, and refined product flows are what changes the supply story. A comment from an unnamed official is not that.
The trend is down with sellers sitting inside the resistance zone at the new main top. The moving average held on the first test and the rate trade is pausing near the highs without reversing. Whether this settles into a range between the average and the resistance or breaks lower depends on whether the data this week gives the December odds a reason to come down. Tuesday said not yet.
If you’d like to know more about how to trade gold, please visit our educational area.