Ethereum (ETH) has surged by nearly 11% in the past 24 hours and, as a result, it has hit our previous forecast of $2,800 for the top altcoin.
As we have been stating for a while, the previous bearish cycle appears to have ended the last time ETH hit $1,550.
Meanwhile, a fresh bullish cycle seems to have started based on on-chain signals and technical indicators, even though the macroeconomic backdrop remains a bit challenging.
Trading volumes for ETH remain high at $20 billion, accounting for nearly 6% of the asset’s circulating market cap, as buying pressure has been rising lately.
Yesterday, short liquidations rose to their highest level since August, reaching $924 million as most crypto assets broke past key resistances on Monday.

Net Inflows to Ethereum ETFs Remain Weak… For Now
Ethereum alone accounted for a fifth of that total, as the top altcoin broke a bullish flag pattern that we identified weeks ago. Now, the stage looks set for a move toward the token’s next target at around $3,400.
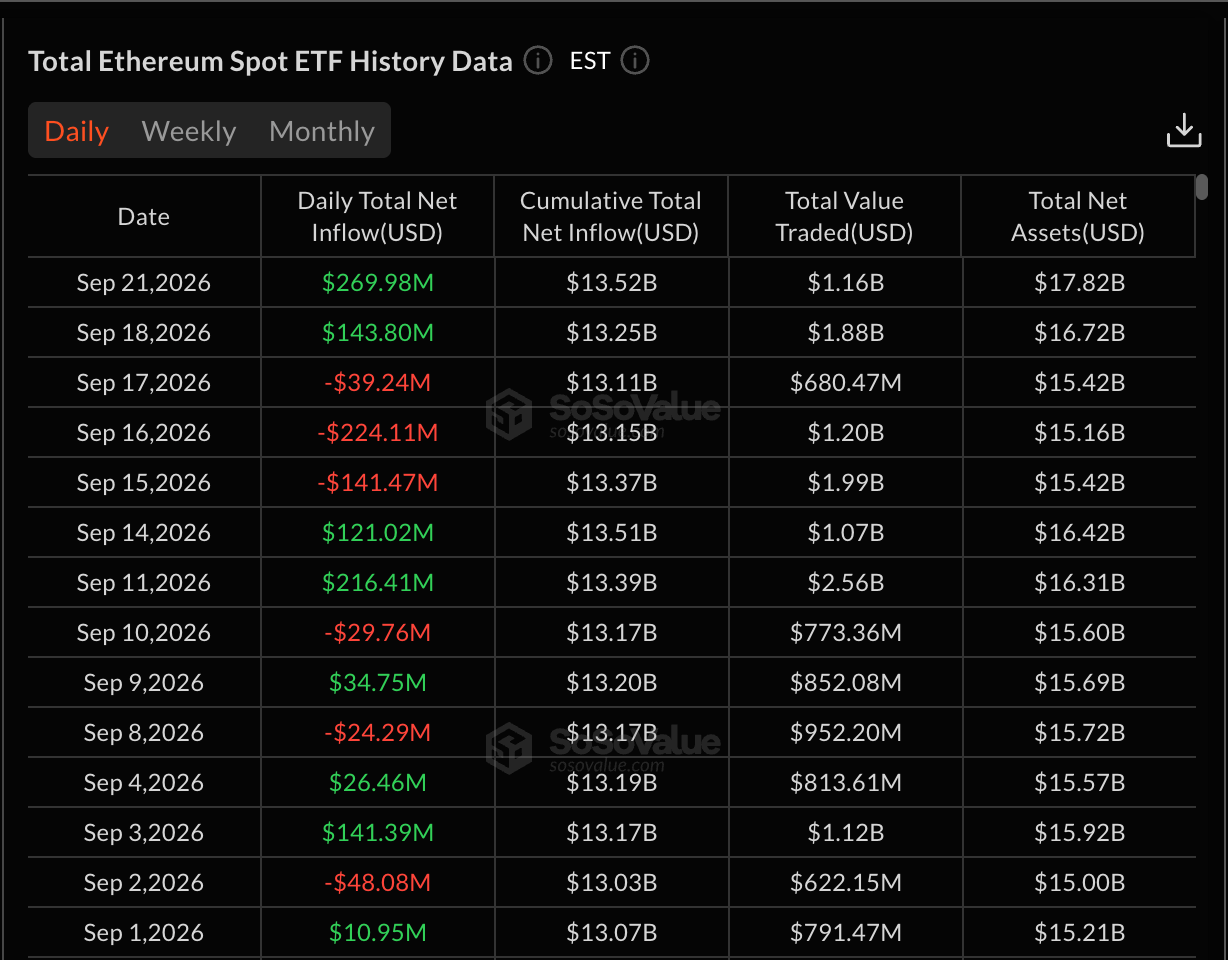
Data from SoSoValue shows that net inflows to exchange-traded funds (ETFs) also started the week with a positive tone, as investors poured $270 million into these vehicles as a result of yesterday’s rally.
However, inflows have been relatively weak in September compared to last month, as ETH-linked funds have received $458 million during the first 21 days, resulting in a simple run rate of around $655 million.
If the total figure ends at that level, that would represent a 65% drop compared to August. That said, this could change dramatically if the rally continues throughout the rest of the week.
Ethereum Price Forecast
Every new Ethereum analysis as it publishes, today's technical signal and key levels, live price — on one page.
See all Ethereum forecastsKey On-Chain Metric Flashes Historical Buy Signal
Turning to on-chain data, we just got a massive buy signal in a key metric called the MVRV Ratio. This is a data point that tracks the relationship between the market value of all ETH tokens and the total value of these tokens at the price at which they were bought.
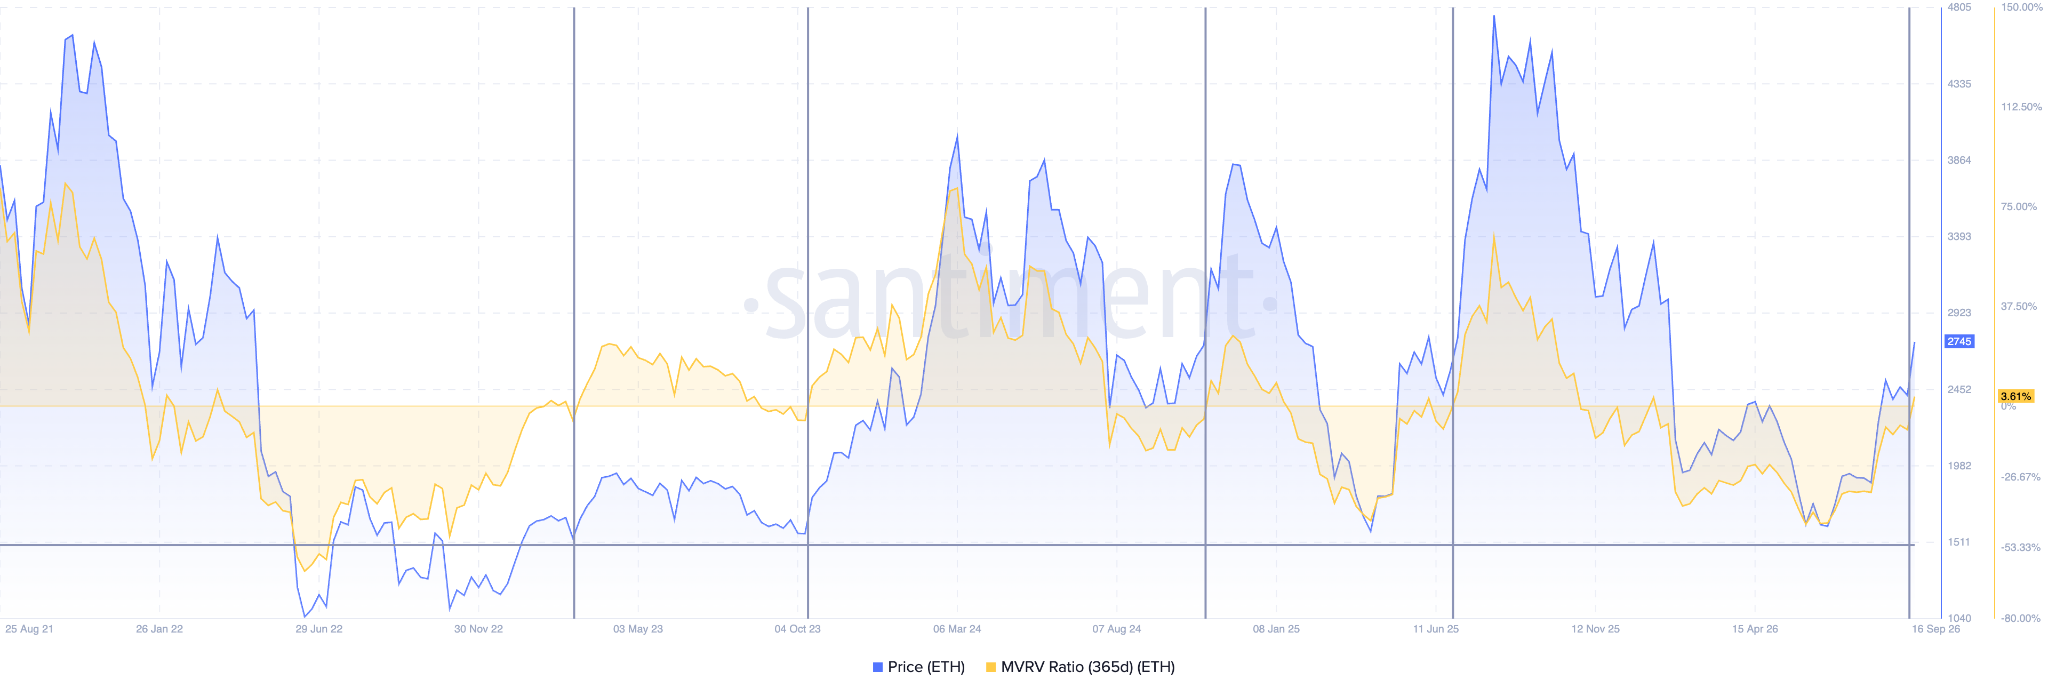
According to data from Santiment, the last four times that this metric has risen above the zero line after a pronounced bear market, that has resulted in ETH advancing toward the $4,000 level or so.
Guess what? At the time of writing, this ratio is sitting at 3.6% for the first time since October 2025. In addition to ETH’s price action and technical indicators, on-chain data is also supporting the idea that a fresh bullish cycle could have started.
ETH Could Deliver a 21% Gain If It Breaks Past the $2.8K Resistance
Now, heading to the charts, we can see how ETH broke out of its flag pattern — a continuation setup that indicated a temporary pause by the market after August’s strong rally.
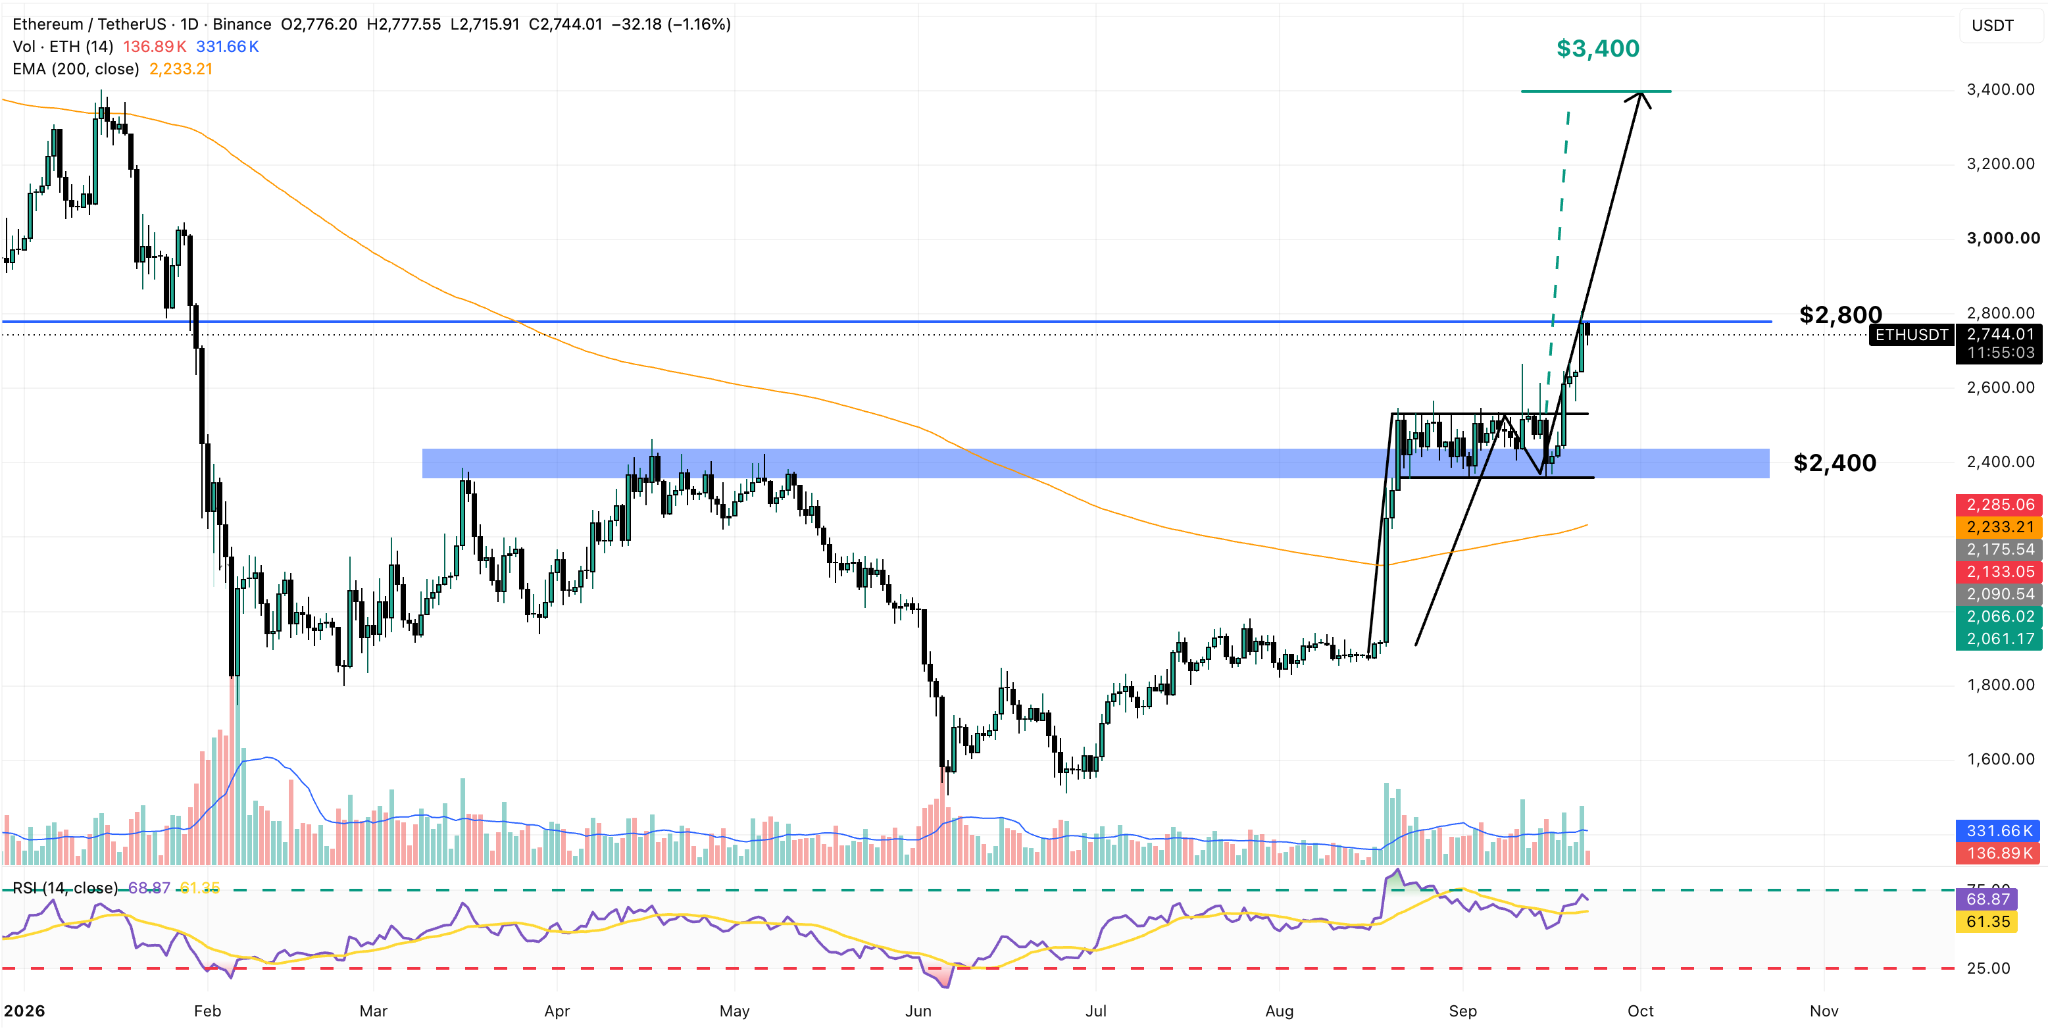
A bullish breakout is setting the stage for a much stronger push toward $3,400. This target is the result of using the flag’s pole size as a reference to project how high the price could go during the next leg up.
ETH still needs to break past the $2,800 barrier to get things going. If it does, that would imply an upside potential of 21.4% in the near term.
Positive momentum has been accelerating, as indicated by the Relative Strength Index (RSI). This oscillator just broke above its signal line, and it is now standing at 69, further confirming that bulls are in control of the price action.