Cardano (ADA) is testing a major resistance zone near $0.25, where a rejection could validate a months-long bear flag and put a drop toward $0.12 back on the table.

ADA Bear Flag Targets $0.118
ADA was trading near $0.246 on Sept. 22, extending its recovery from the June low of roughly $0.14.
However, the rebound has developed inside a rising parallel channel, resembling the consolidation phase of a classic bear flag. These structures typically appear after a steep decline and resolve when the price breaks below the channel’s lower trendline.
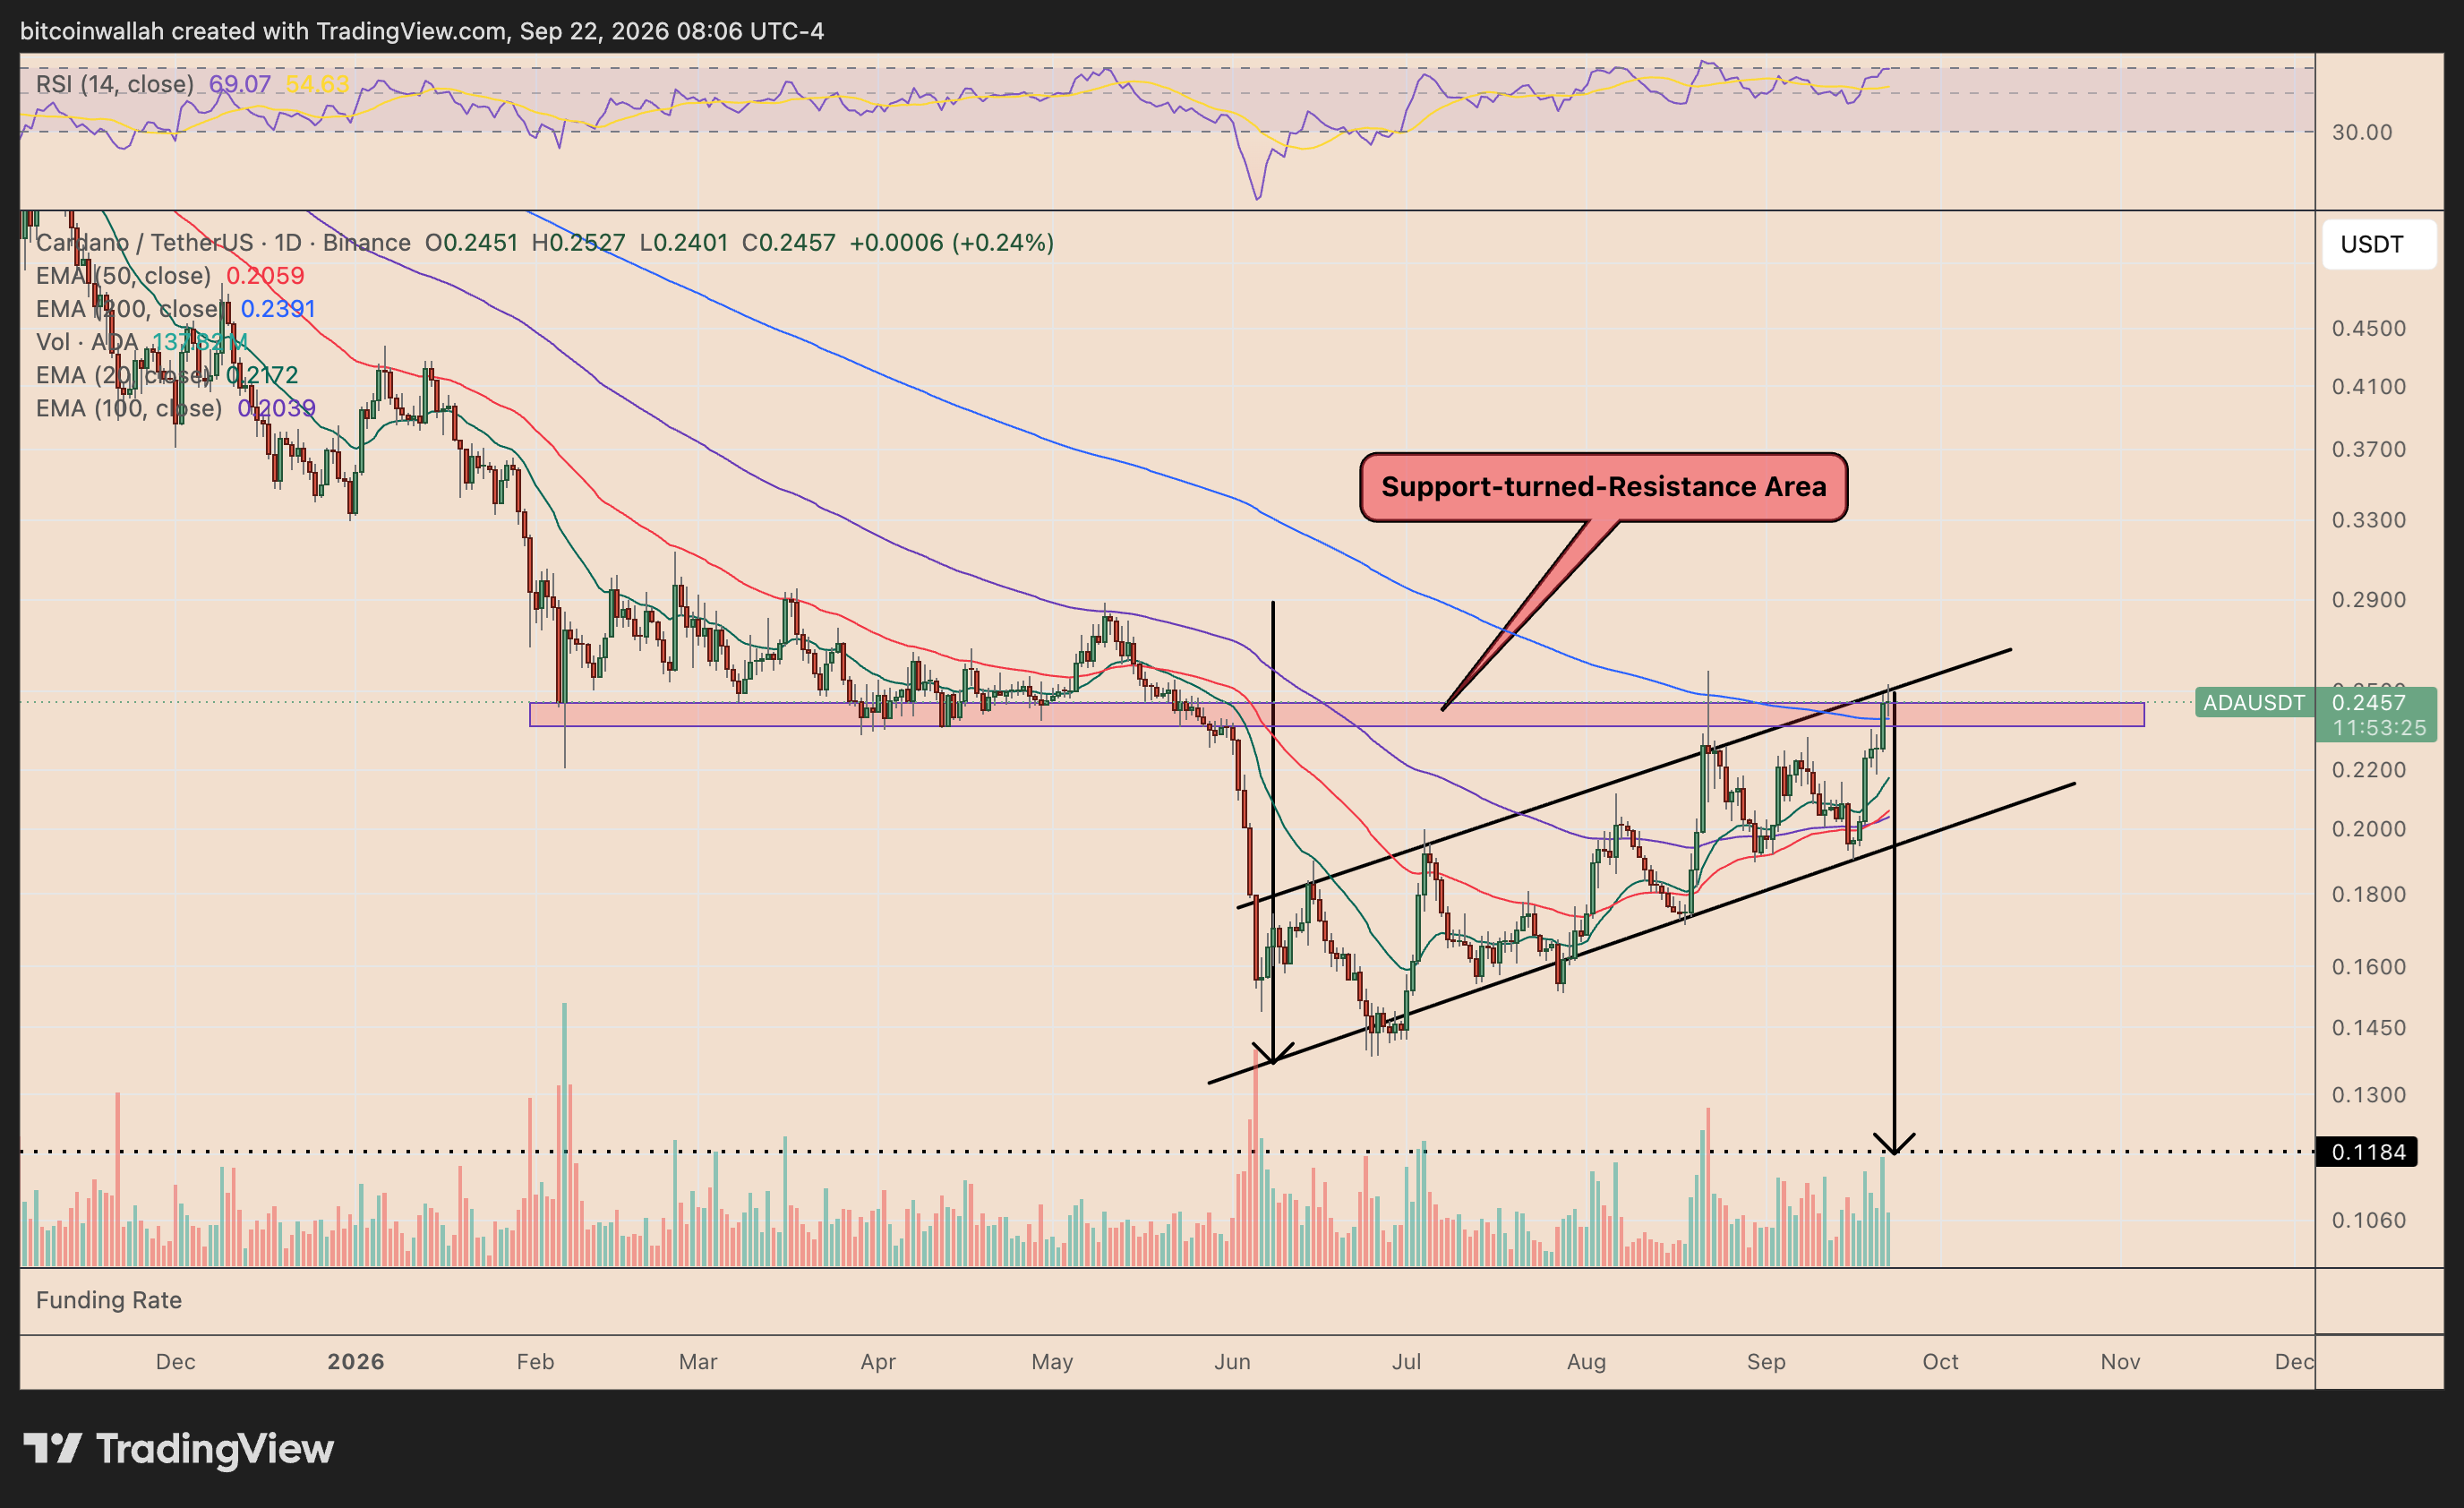
More importantly, Cardano’s rally has brought it directly into the $0.235-$0.25 area, which served as support between February and May before breaking down in June. The same zone is now acting as potential resistance.
ADA is simultaneously testing its 200-day exponential moving average (EMA) near $0.239, adding another technical hurdle around current levels.
Meanwhile, the daily relative strength index has climbed to around 69, just below the traditional overbought threshold of 70. That suggests bullish momentum remains strong but is becoming increasingly stretched.
A rejection from the $0.24-$0.25 resistance zone could send ADA back toward the bear flag’s lower boundary, currently approaching the $0.20 area.
A decisive close below that trendline would confirm the bearish continuation setup.
Based on the height of the preceding decline, the breakdown could eventually pull Cardano toward approximately $0.118, representing a decline of more than 50% from current prices.
Conversely, a sustained breakout above $0.25 and the flag’s upper trendline would weaken the bearish setup and increase the chances of a broader trend reversal.
ADA Liquidation Magnet Sits Near $0.217
Cardano’s liquidation heatmap adds another layer of downside risk, showing a dense pocket of leveraged long positions clustered around $0.217.
The $0.2173 level carries roughly $247,000 in liquidation leverage, while cumulative long liquidations could reach around $18.03 million if ADA drops into that zone, according to the CoinGlass chart.
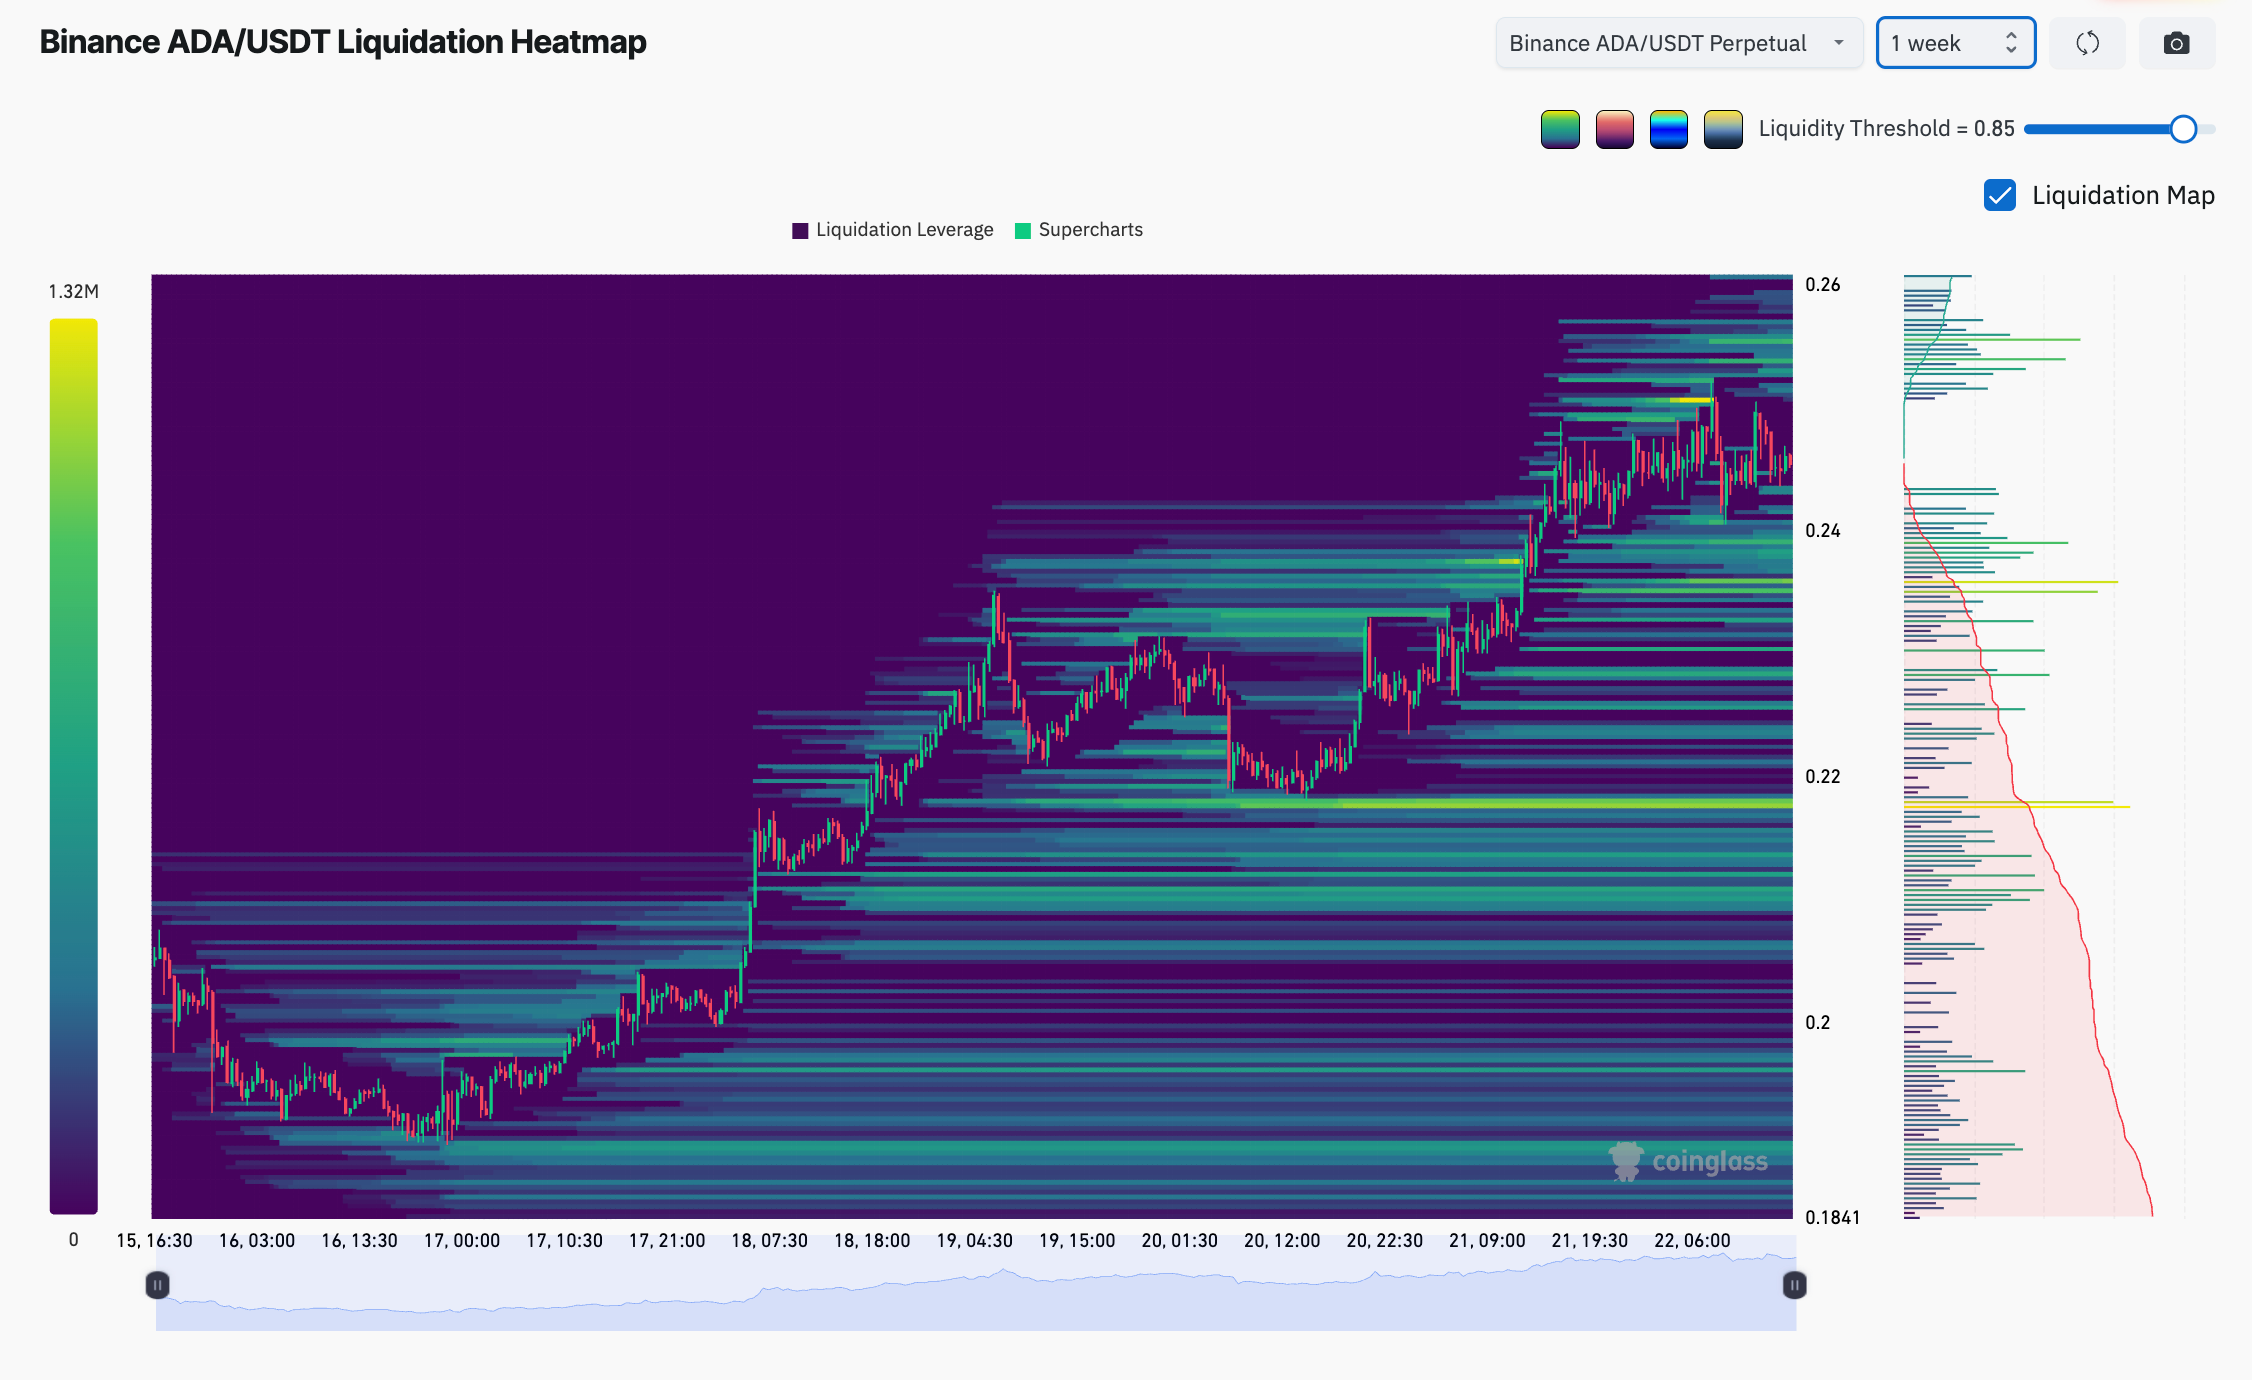
That makes the area a potential liquidity magnet, particularly if ADA fails to break decisively above the $0.24-$0.25 resistance region. In leveraged markets, price often gravitates toward zones where large liquidation pools are concentrated because forced position closures can amplify an existing move.
A decline toward $0.217 would also fit the broader bear-flag structure, bringing ADA closer to the lower half of its rising channel.