
Gold (XAU) trades near $4,340 an ounce and silver (XAG) near $67 on Wednesday as traders follow the latest U.S.-Iran talks. Iran has set conditions for reopening the Strait of Hormuz. At the same time, Saudi Arabia is working to restore the exports of oil through the East-West pipeline. Brent oil dropped below $100 a barrel as hopes for more supply of oil grew. The drop in oil prices can ease inflation fears and reduce pressure for another rate hike by the Federal Reserve.
Silver also consolidated around $67 on Wednesday, but both metals remain under pressure as the US dollar and US Treasury yields remain elevated. Traders still expect the Fed to consider another hike so the outlook depends on whether oil continues to drop and the talks make progress. If oil rebounds or expectations of a rate increase rise, both metals could come under pressure again.

Gold Price Forecast: $4,300 Support Faces a Test
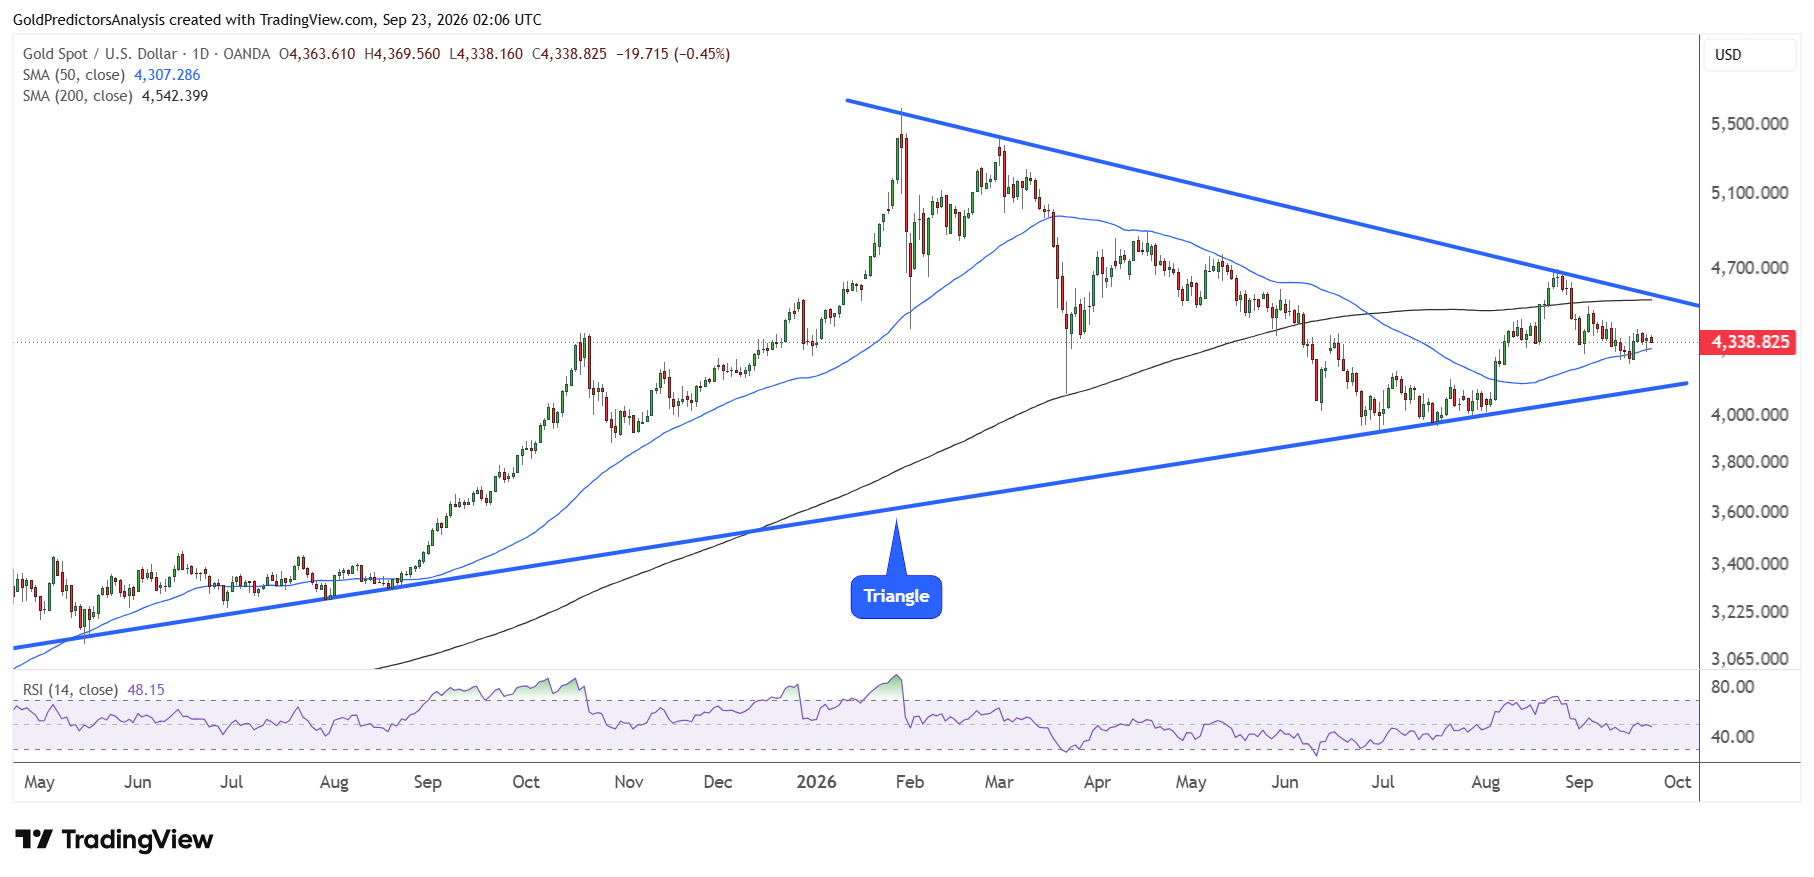
Gold Daily Chart: Triangle Holds Between $4,150 and $4,550
The daily chart for spot gold shows that the price has been consolidating between the 50-day and 200-day SMAs, between $4,300 and $4,530. The price has been consolidating within the triangle pattern. A break of this triangle is required to determine the next direction.
The support of the triangle now remains around $4,150 on the downside, while resistance is around $4,550 on the upside. Therefore, a break of either level will likely define the next move in the gold market. But the RSI remains below the midline, which shows negative price action in the short term. A confirmed break below $4,150 is required to push prices toward the $4,000 area.
Gold 4-Hour Chart: Head-and-Shoulders Pattern Puts $4,300 at Risk
The 4-hour chart for spot gold also shows negative price action in August and September. The formation of head and shoulders pattern suggests further weakness. A break below $4,300 will likely define the next move in the gold market. But a break above $4,550 will likely push prices further to the upside.
Gold Price Forecast
Every new Gold analysis as it publishes, today's technical signal and key levels, live price — on one page.
See all Gold forecasts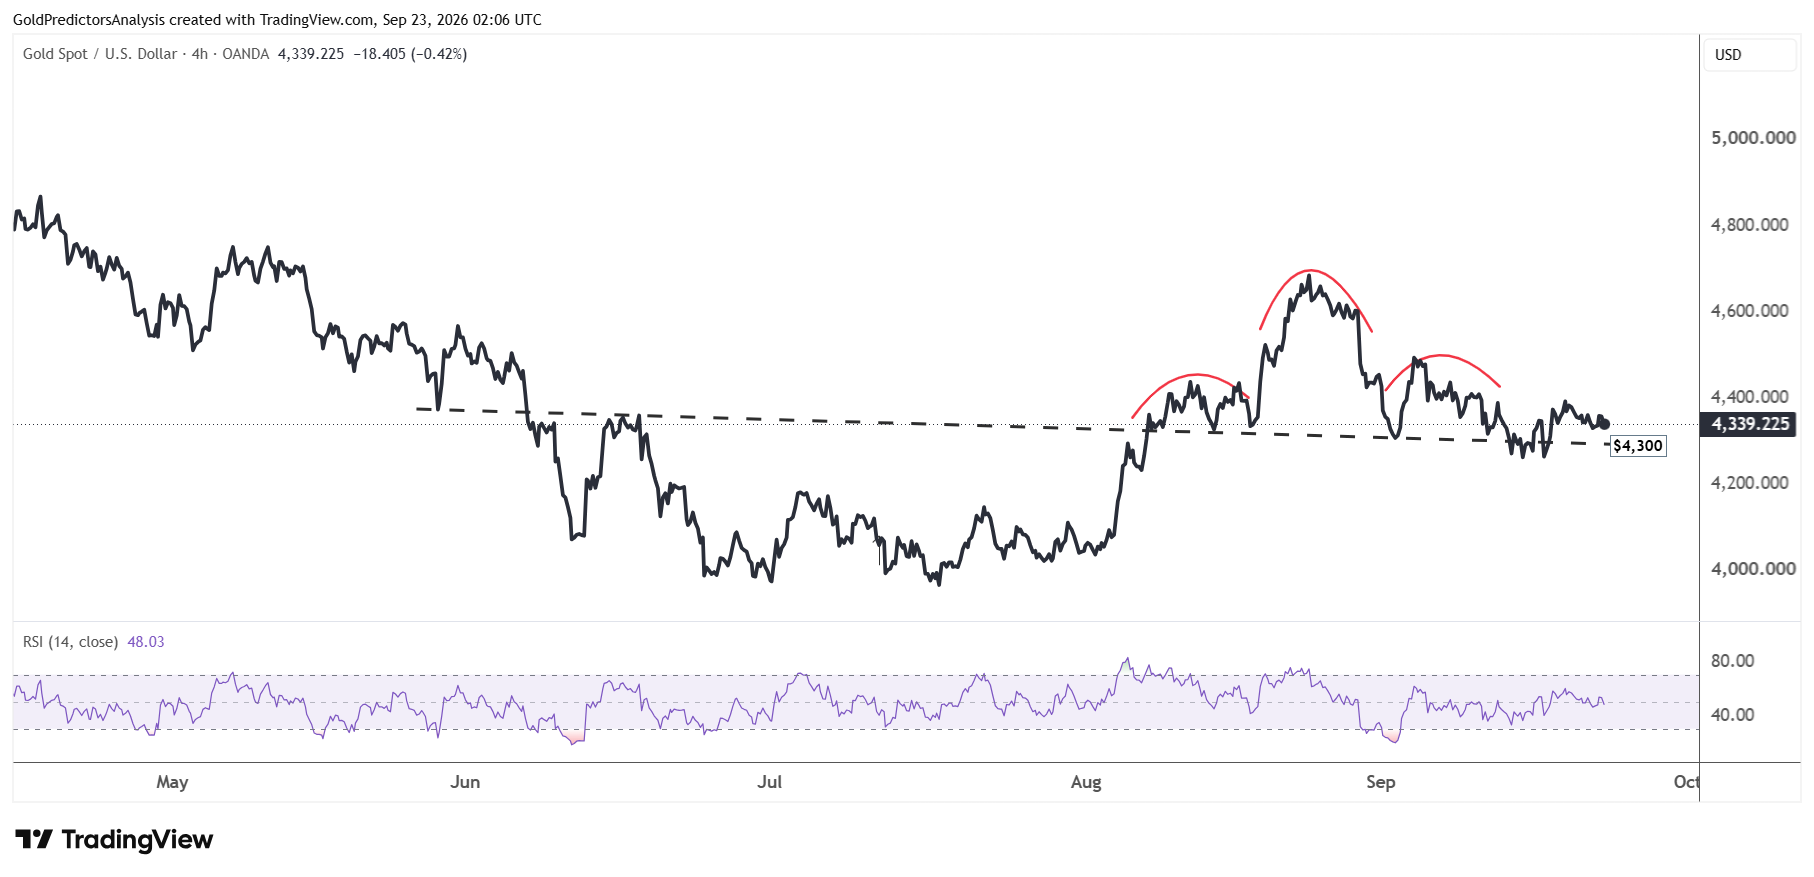
Silver Price Forecast: Break Above $72–$73 Could Target $90
Silver Daily Chart: $63 Support and $72–$73 Resistance
The daily chart for spot silver also shows that the price has been consolidating between the 50-day and 200-day SMAs. These SMAs lie around $64 and $72 as seen in the chart below. However, the RSI remains above the midline, which suggests positive momentum in the silver market.
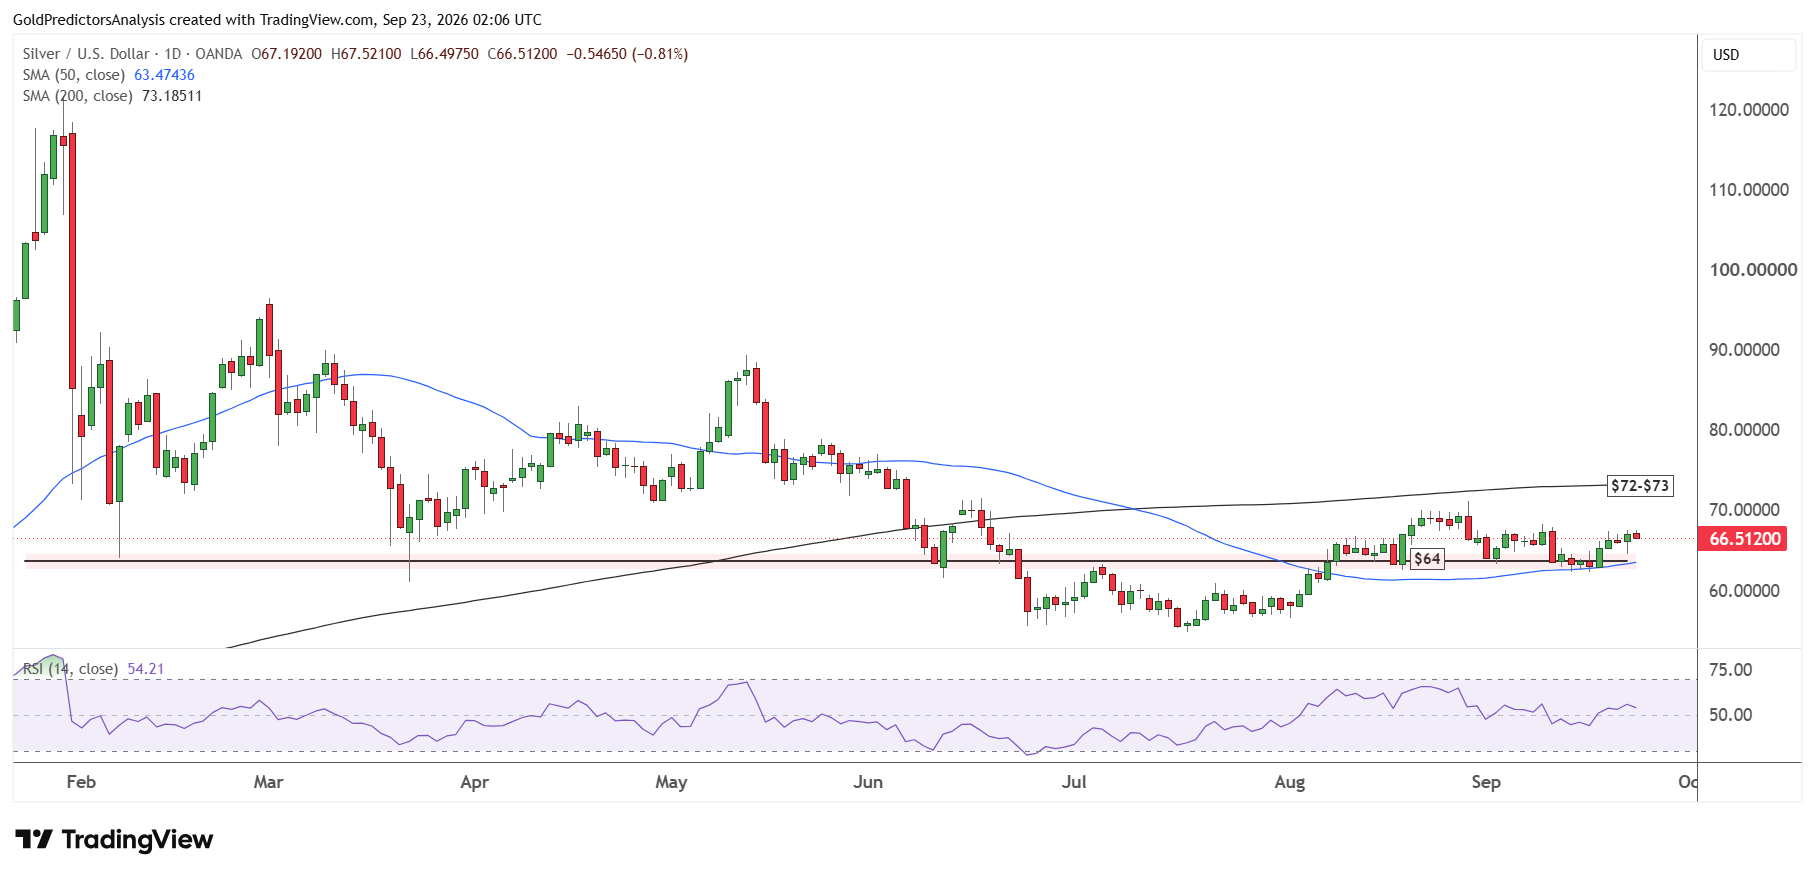
The price must break above the 200-day SMA in the $72-$73 region to initiate the next upside move in the silver market. A break above $72 will likely open the way to the $90 area. On the other hand, a confirmed break below $63 will likely push prices toward the $60 area. A break below $60 will likely open the way for a strong drop toward the $55 region.
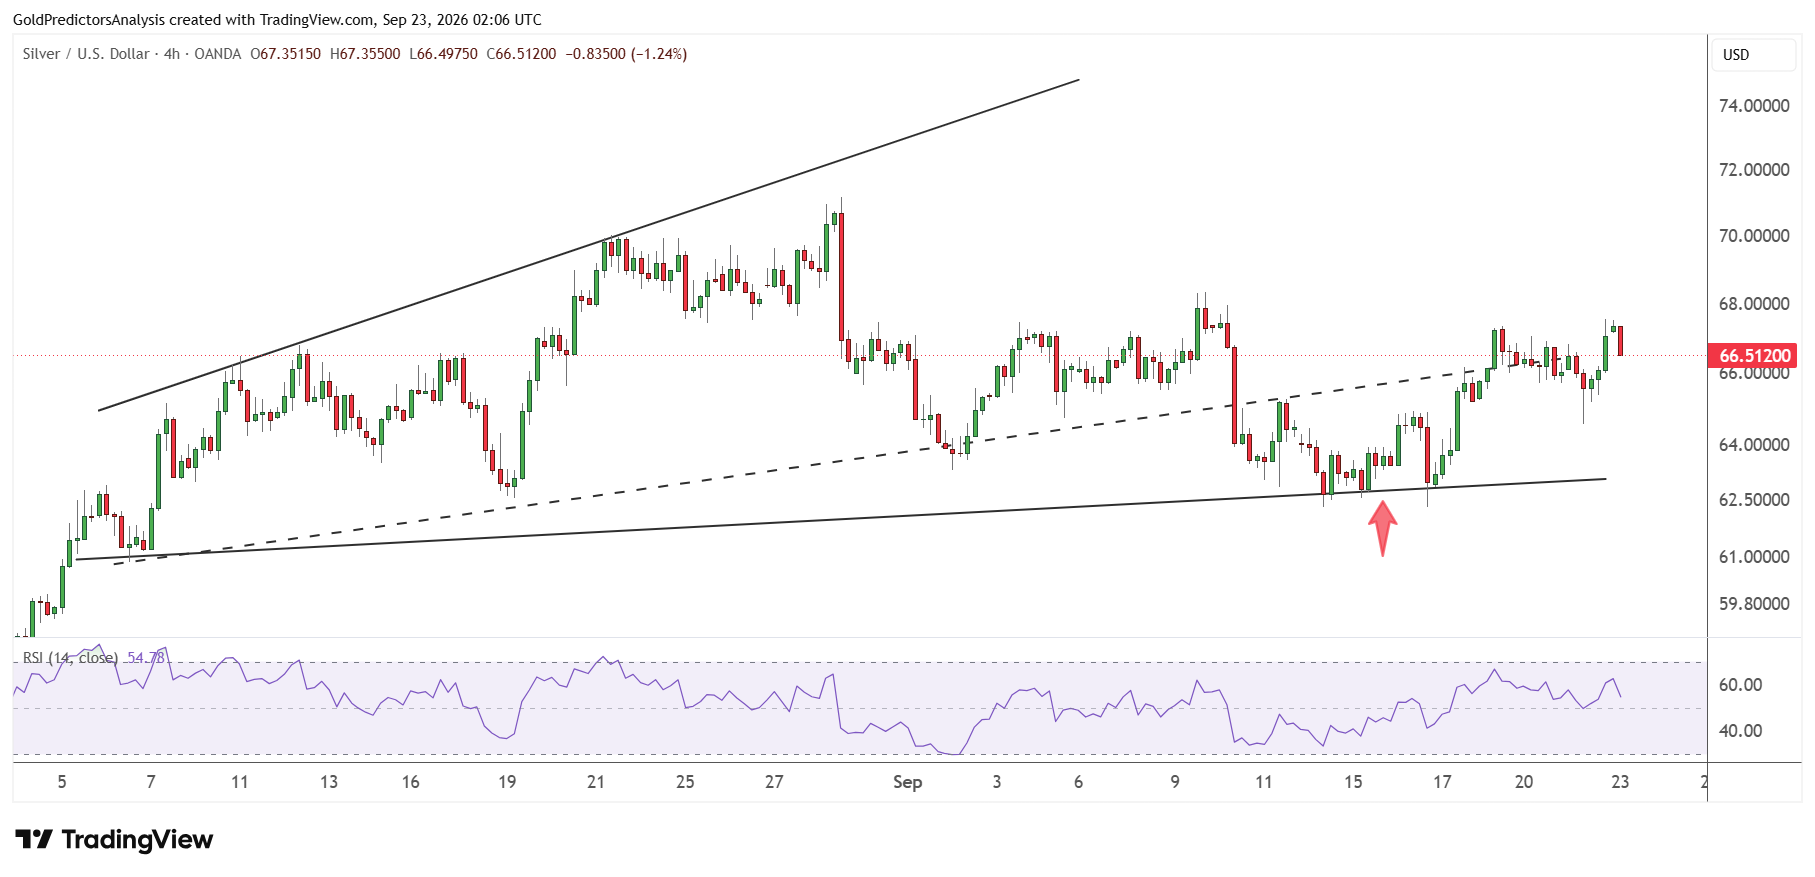
Silver 4-Hour Chart: Broadening Wedge Puts $63 in Focus
The 4-hour chart for spot silver also shows strong uncertainty in the short term, as the price has been trading within an ascending broadening wedge pattern. Prices are consolidating around the lower boundary of support, in the $64-$66 area.
A break below $63 will likely break the ascending broadening wedge pattern and open the way for a strong drop. The silver price has been consolidating between $62 and $70 for a long time. Therefore, a confirmed break of either level may suggest a strong move.
What to Watch Next for Gold and Silver Prices
Gold and silver remain sensitive to the talks between the U.S. and Iran because oil prices could change expectations for the next rate hike by the Fed. The drop in oil prices may help both metals recover but a strong dollar and high Treasury yields still limit gains. Gold needs to break above $4,550 to regain momentum. A drop below $4,300 would increase the risk of a drop to $4,150.
Silver needs to clear $72-$73 to open a path toward $90 while a break below $63 could push it toward $60. Until those levels break, both metals may continue to trade without a clear direction.