



USOIL, UKOil & Natural Gas Outlook: Saudi Pipeline Restart Eases Crude Supply Risk as LNG Shortage Persists
Oil market conditions eased on Wednesday with the resumption of operations on Saudi Arabia’s East-West pipeline. The pipeline provides an land route to bypass the Strait of Hormuz. It had been shut down since September 11 after drone attacks damaged three of the pipeline’s pumping stations. Saudi Aramco has begun reducing the pipeline flow to evaluate how to increase it back to the 4 million barrels a day it carried prior to the attacks. A full increase in pipeline flow is expected to take 6 to 8 weeks. In the interim, the port of Yanbu has begun increasing shipments of crude oil.
The attacks and subsequent disruption of pipeline flow through Hormuz increased the cost of transporting oil. Benchmark tanker rates between the Persian Gulf and China exceeded $30 a barrel. Saudi Arabia increased Gulf exports to make up the difference. The added shipments, along with ship-to-ship transfers near Oman, added to Hormuz’s overall exports.
The resumption of operations on the East-West pipeline removes a short-term supply restriction for Saudi Arabia. It is expected that Saudi Arabia will reduce ship-to-ship transfers near Oman.
Hormuz still faces threats. On Monday, just two ships carried commodity trade across the strait, compared to ten the day prior. Despite being attacked, a crude tanker and an LPG carrier continued to operate.
Natural gas supply is even more disrupted. QatarEnergy stated that the recent attacks on Ras Laffan have wiped out 17% of Qatar’s LNG output, and that the two affected plants would take three years to repair. Additionally, the disruptions to Hormuz are likely to impact the next phase of Qatar’s LNG expansion.
Moving crude is much easier and less constrained than moving natural gas.
Fundamentally biased neutral to moderately bullish for Brent and WTI; moderately bullish for natural gas.

Natural Gas Technical Analysis: NG Breaks Above $3.00 as $3.05 Becomes the Next Upside Test
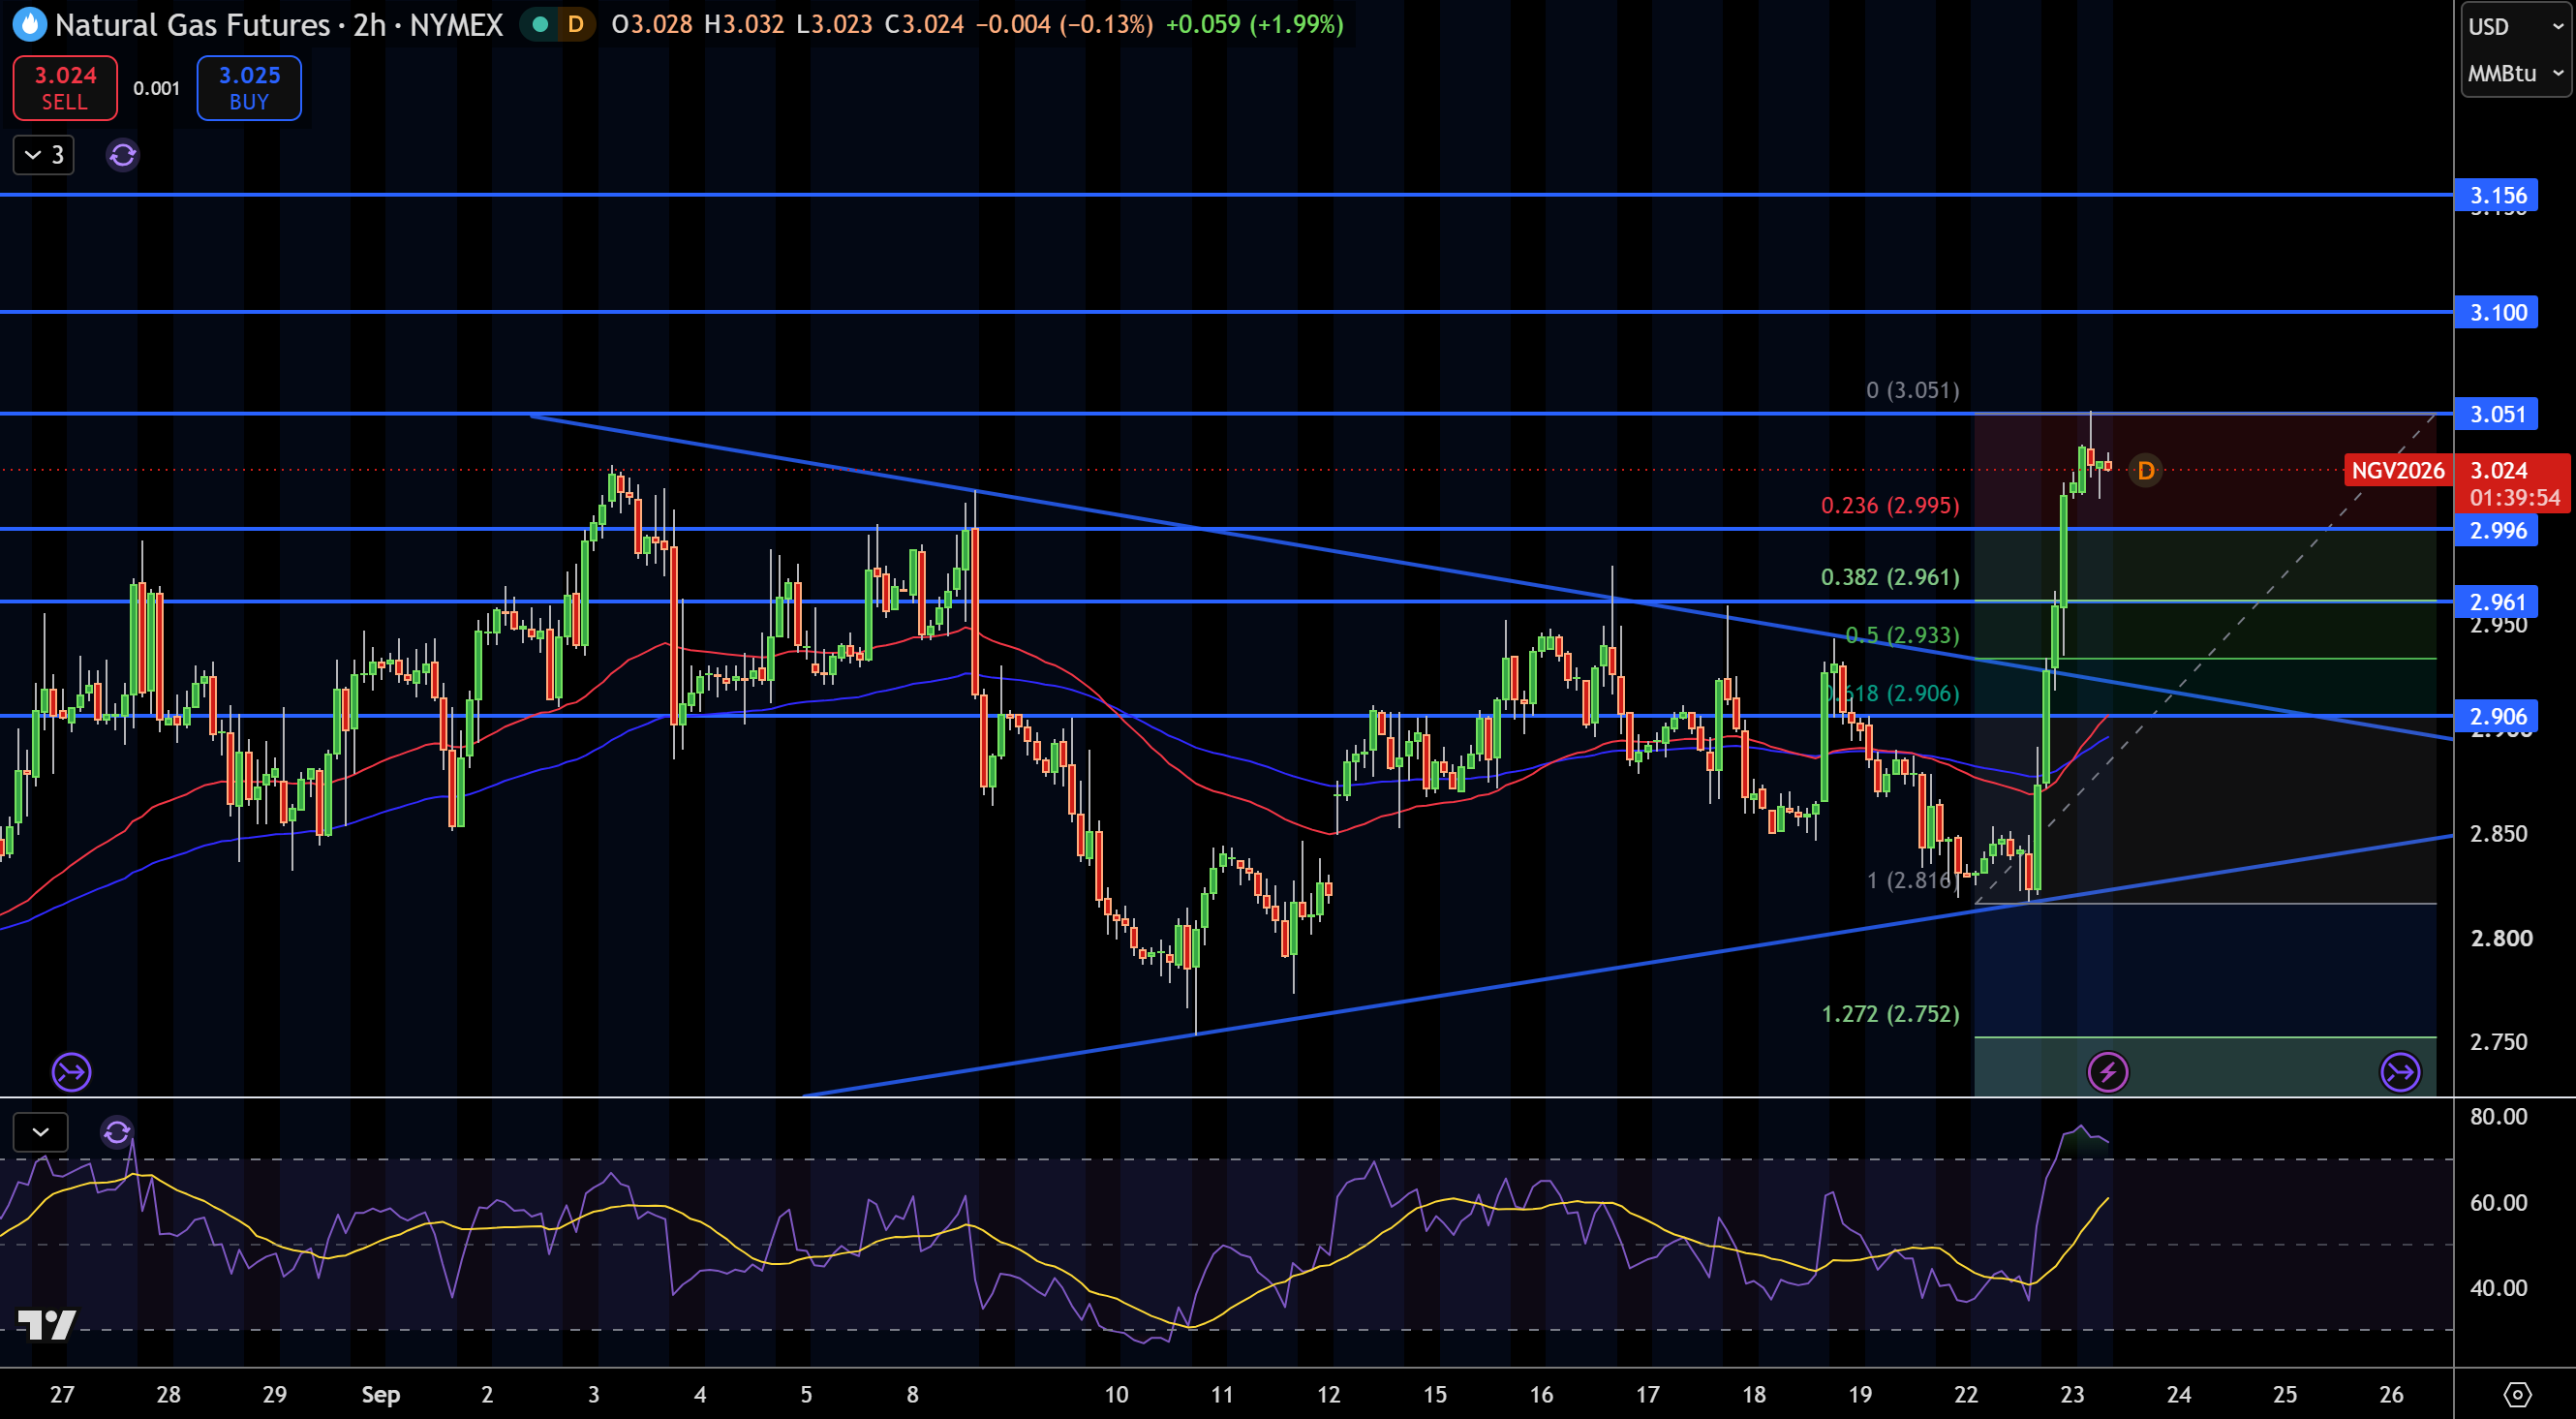
NatGas recently broke out above our bearish trendline and the $2.996 resistance area, and is currently trading at $3.02. From a short-term perspective, $2.996 and the 100 & 200 hour MA’s have been major barriers for NatGas, but given the bullish breakout above those barriers, they are now major areas of support.
The next major upside target for NatGas is the $3.05 area. Beyond that, the next major areas of resistance rest at $3.10 and $3.16. If the breakout begins to reverse, the $2.996 area will be the first area of support, followed by the $2.96 and $2.93 areas.
RSI is currently in overbought territory, so a short-term pullback may be expected. If NatGas is able to trade and close below the $2.996 area, this analysis would also change in a major bearish way. On the other side, a break above $3.05 would open the $3.10 and $3.16 areas.
Natural Gas Price Forecast
Every new Natural Gas analysis as it publishes, today's technical signal and key levels, live price — on one page.
See all Natural Gas forecastsWTI Crude Oil Technical Analysis: USOIL Tests $88.68 Support as Descending Channel Keeps Pressure Intact
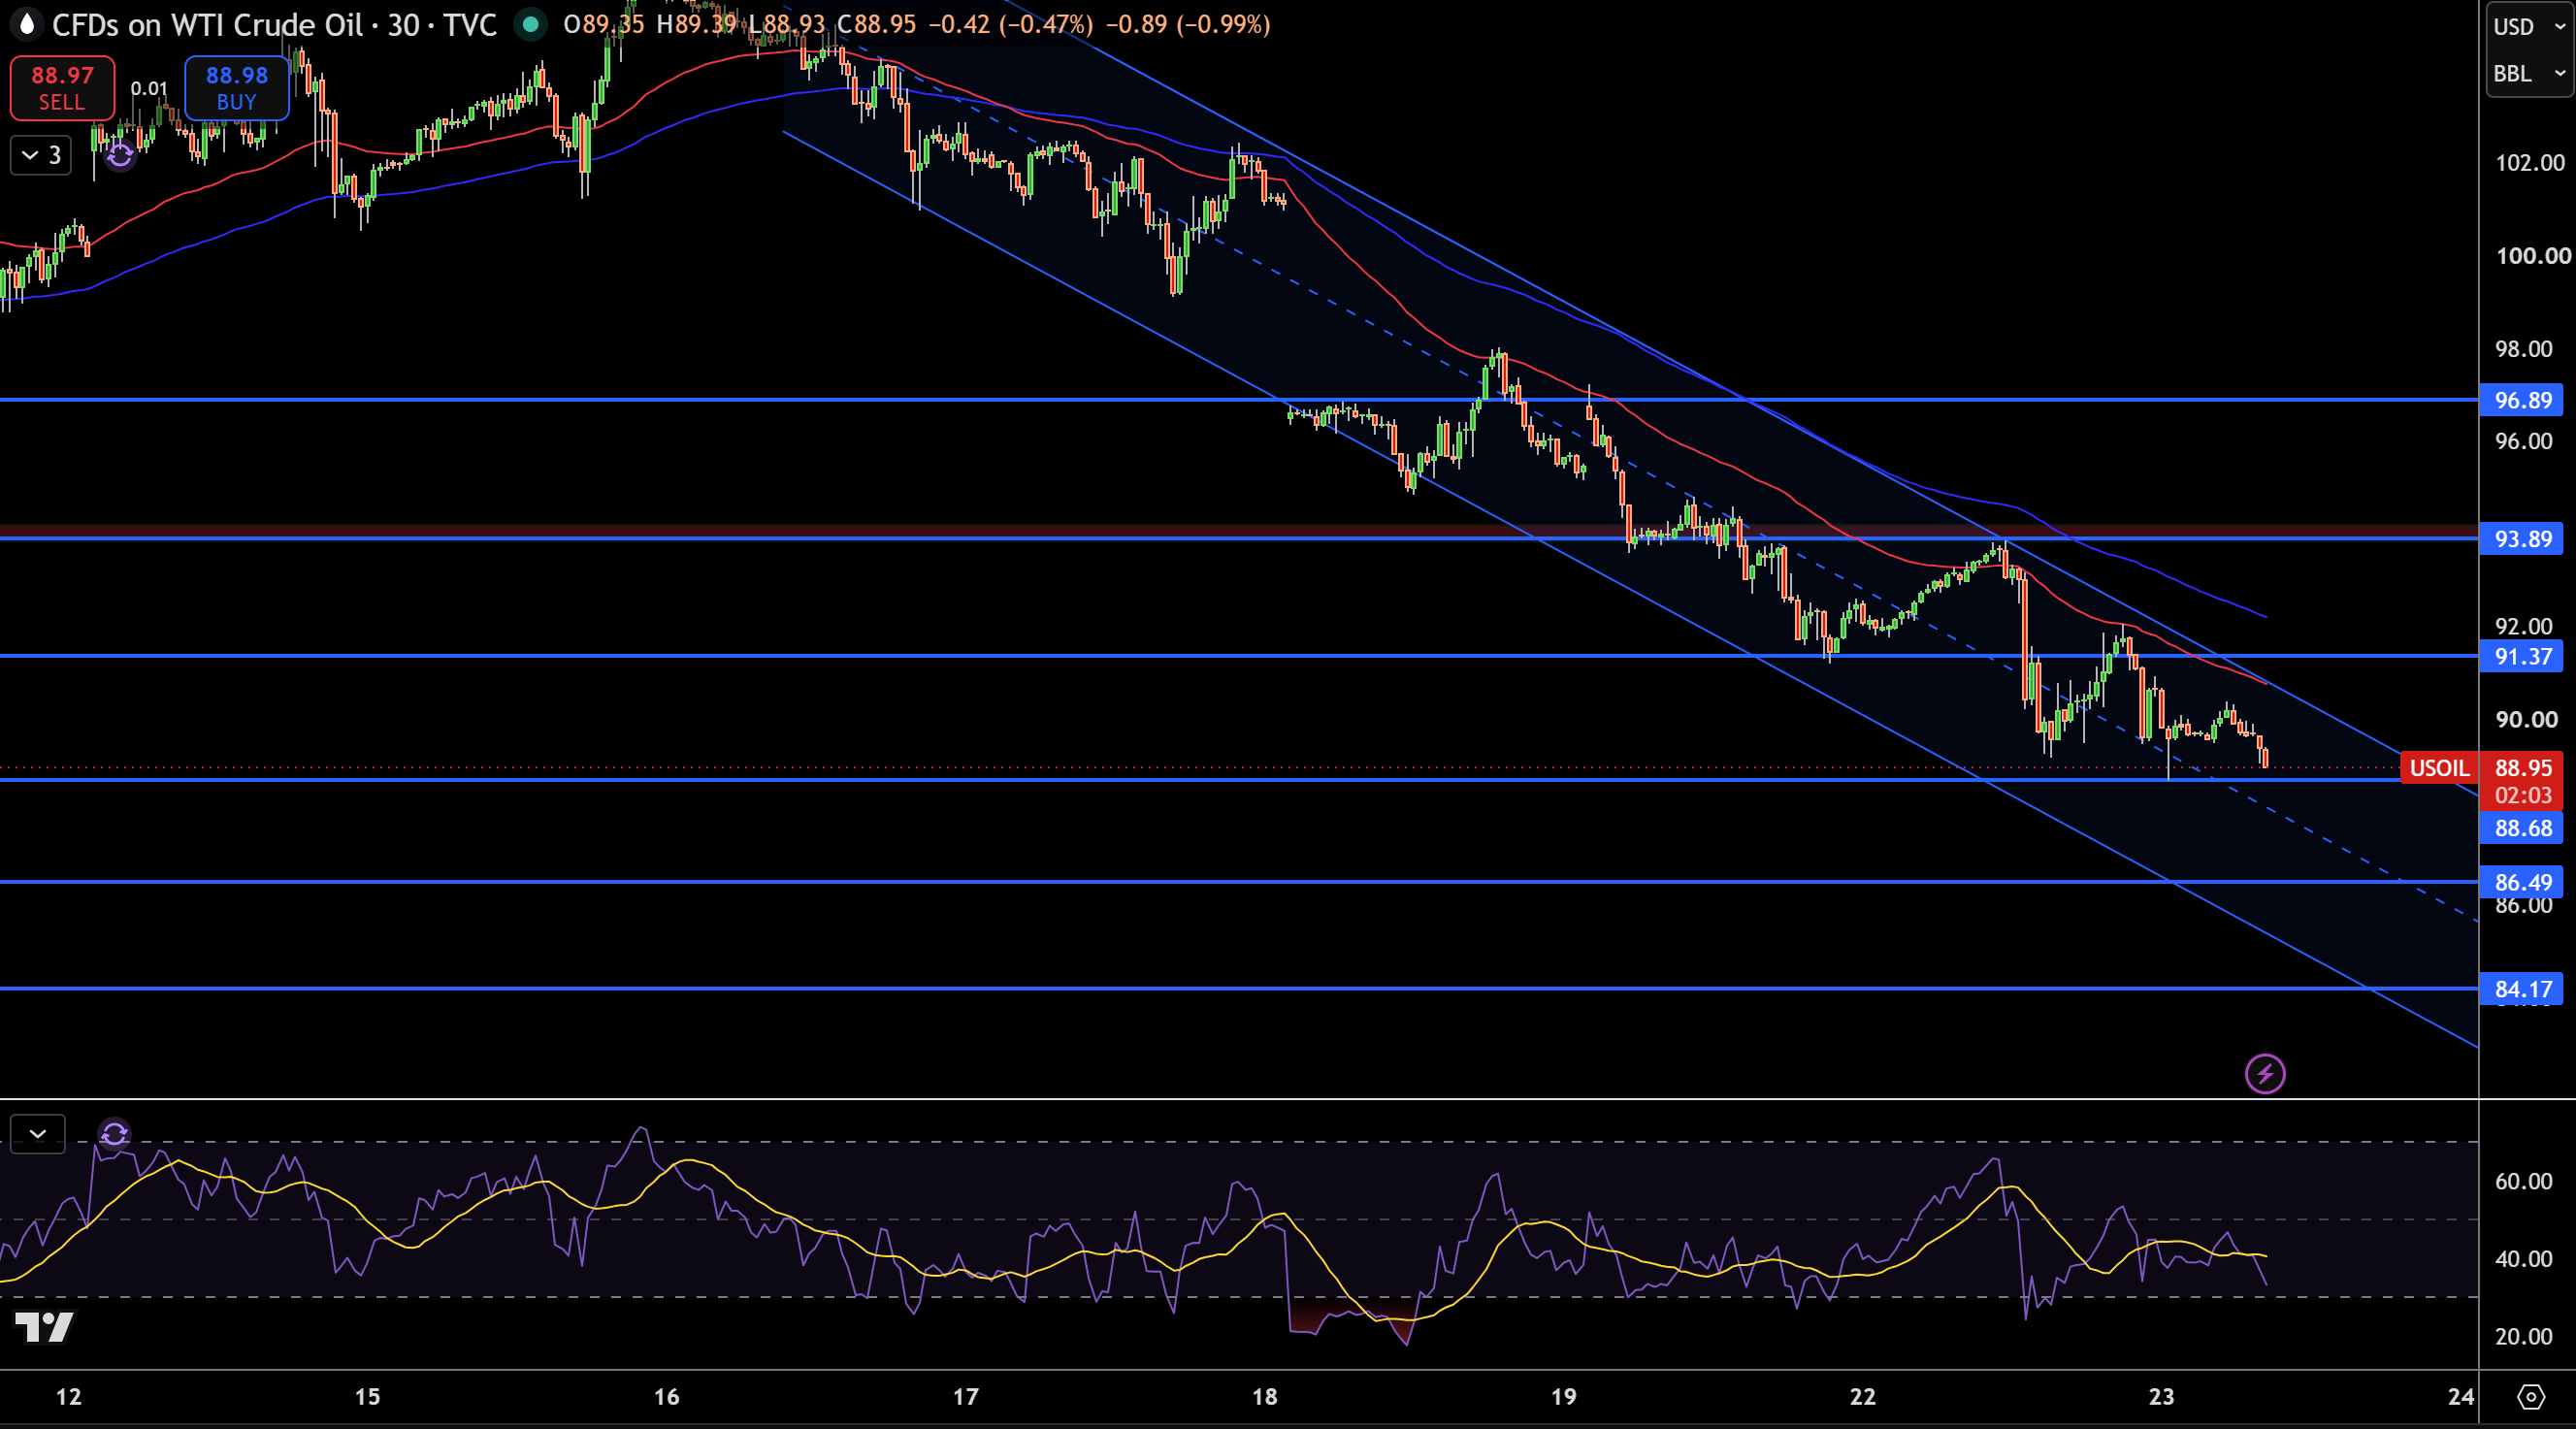
WTI is currently trading near $88.95. It is currently below the moving averages and within a descending channel. Price has been unable to break above the channel and has also been unable to close above $91.37.
I am looking for price to test $88.68 first. A break below $88.68 would have support at $86.49 and then $84.17. If price is able to move above the descending channel and close above $91.37, resistance would then be expected at $93.89 and then $96.89.
Based on the location of the moving averages and the current price of WTI, the channel appears to be Descending. The RSI is also within the channel and is also moving down. Until WTI is able to break above $91.37 and the descending channel, I would expect the price of WTI to move lower. A move above the channel would negate the channel and indicate higher prices. If price moves lower and breaks below $88.68, the next support would be expected lower at $86.49.
Brent Crude Oil Technical Analysis: UKOIL Holds Above $97.41 as $99.33 Resistance Caps the Rebound
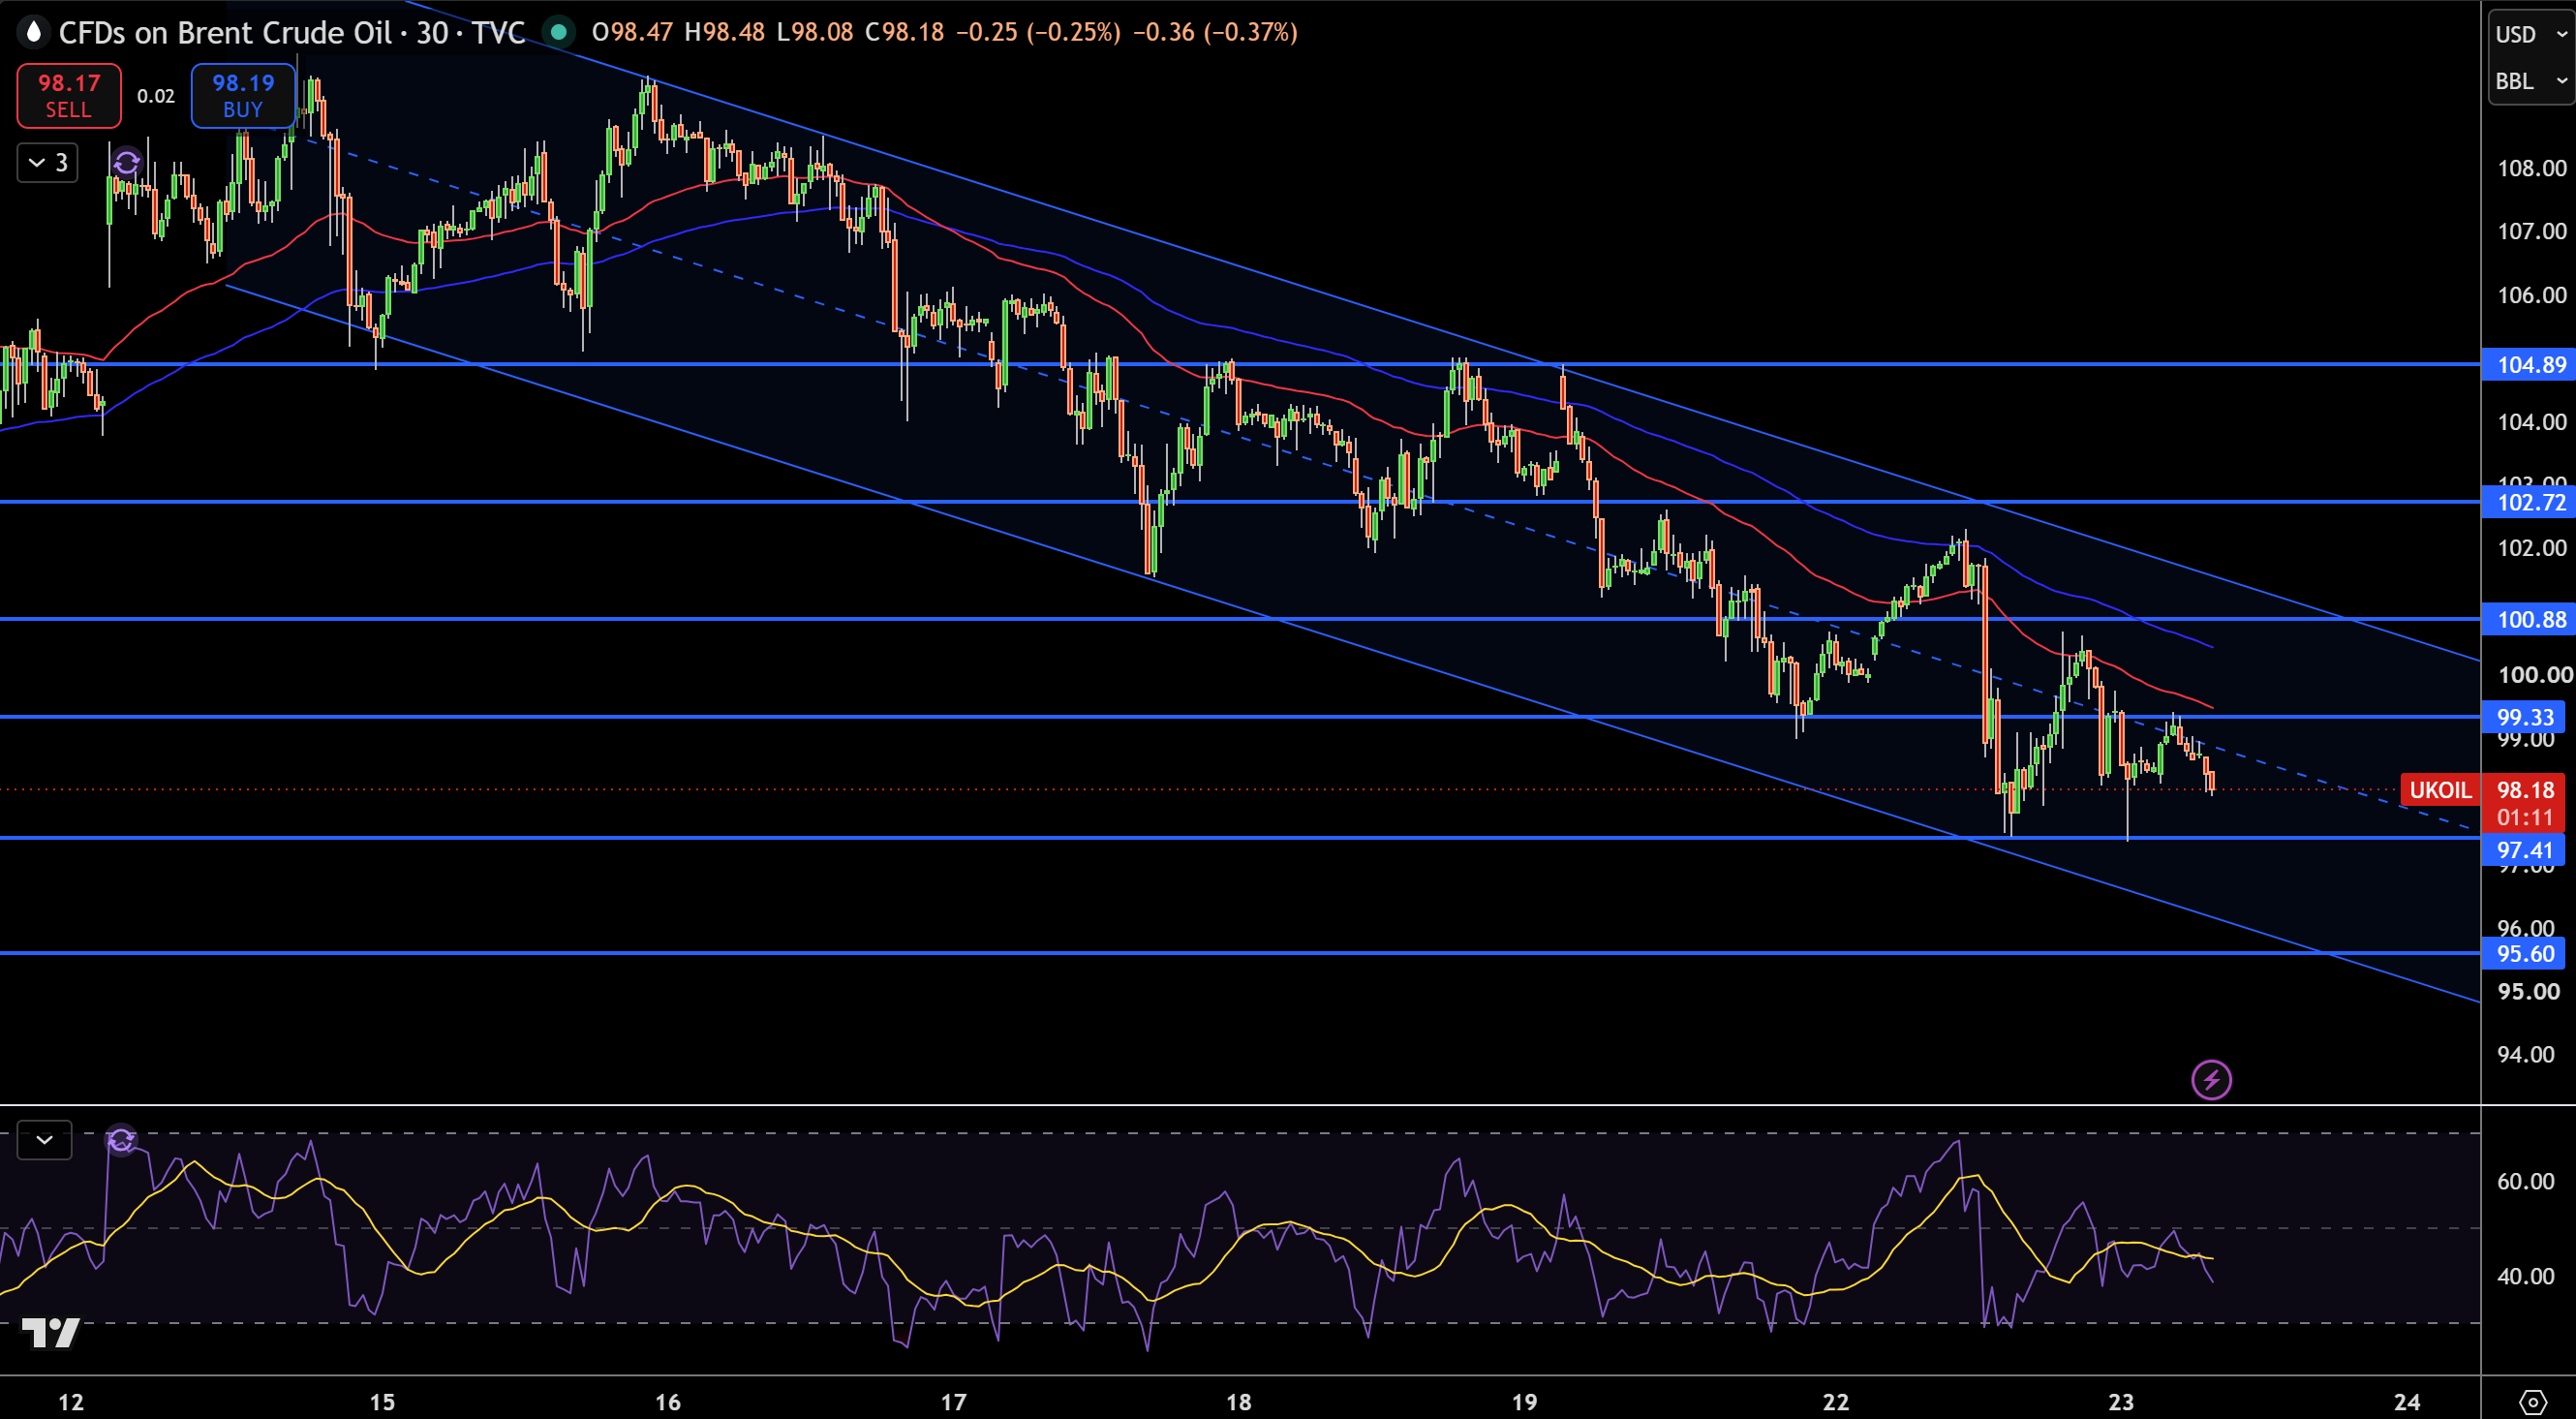
UKOIL is currently at $98.18 on the 30-minute chart after again hitting the descending channel midline. I am currently watching the following levels. Price has been trending below the moving averages and forming lower highs. Recently, the price action has failed to test the resistance area. All of this suggests further downside potential.
$97.41 is the first area of interest. Break below this level opens up the next target of $95.60. The overhead resistance is found at $99.33 and $100.88. Further resistance is located at $102.72 and $104.89.
The RSI is also signaling a minor down trend. I am looking for further sell opportunities and expecting prices to head towards $97.41 and possibly $95.60. From a tactical perspective, I would cover the short position and look to buy if prices trade above $100.88 and channel resistance. A trade below $97.41 makes the $95.60 trade target even more likely.


