
Gold (XAU) and Bitcoin (BTC) are responding to the same market forces, but they are not moving with the same strength. Softer US employment data and a weaker dollar have supported both assets. But high oil prices and the US-Iran conflict continue to favor gold as a safe haven. Bitcoin remains technically bullish but it must break above $82,300 to begin the next major rally. This article examines the latest drivers and the key ratios to determine which asset may lead the next move.

Fed Rate Outlook and US-Iran Conflict Drive Gold and Bitcoin
Gold rebounded strongly after hitting the strong support at $4,282 as the US dollar pulled back from the 99.86 level. The ADP report shows that the private businesses only added 38,000 jobs in August.
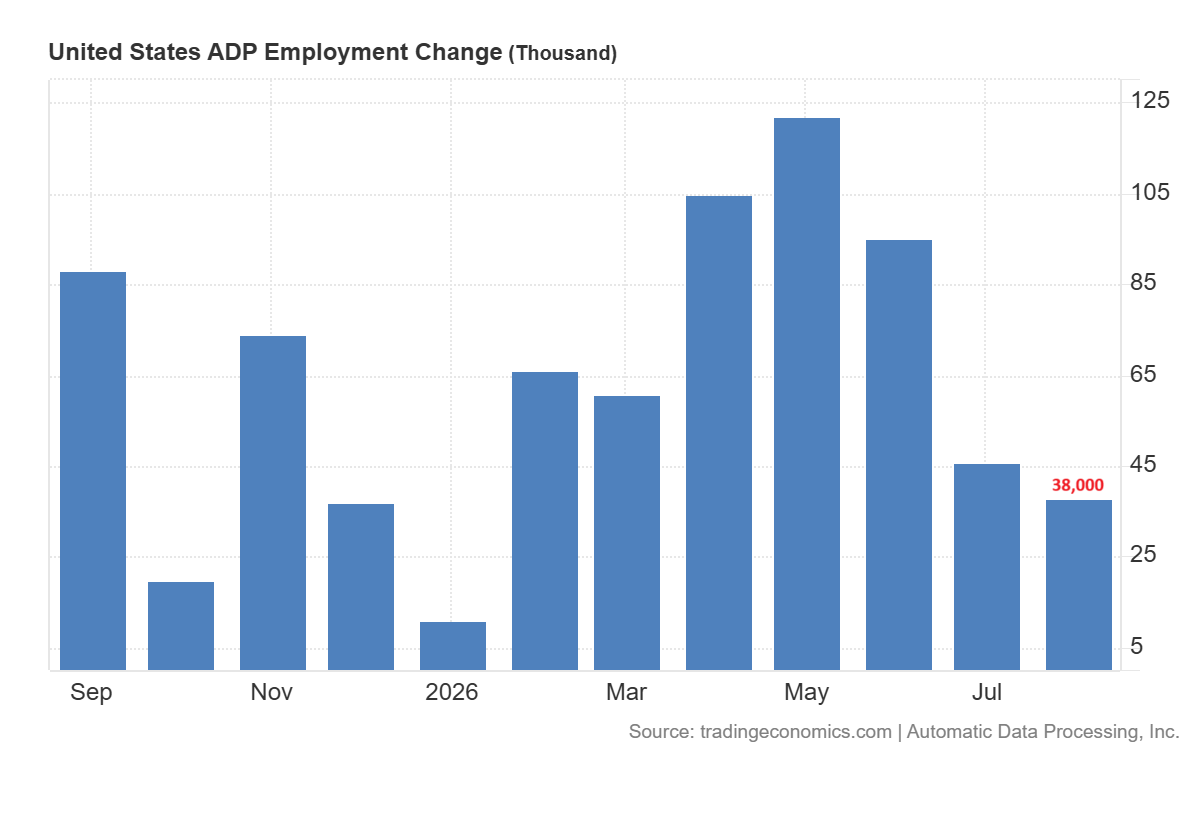
New York Fed President John Williams said that the Fed did not have to rush to raise interest rates again. These developments have dropped the expectations of September rate hike from 67% to around 60% as per the FedWatch tool.
But the threat of high oil prices looms. Brent crude rallied above $95 amid the U.S.-Iran conflict that has affected energy markets and limited shipping through the Strait of Hormuz. The high oil prices could help to keep inflation high and push the Fed to increase rates. In my opinion, gold will receive safe-haven demand if the conflict escalates further. But Bitcoin might struggle when yields and geopolitical risks rise as traders tend to lighten positions in volatile assets.
The movements of the Bitcoin ETF are also volatile. U.S. spot Bitcoin ETFs saw $236.5 million in net outflows on September 1. They raised $101.1 million on September 2, which was still less than half of the amount they withdrew in the previous session. This suggests institutional demand has not disappeared but buyers are cautious. The positive traction in inflows may bring back momentum for Bitcoin. Another leg to the outflows would favor further outperformance in gold.
Gold Price Forecast
Every new Gold analysis as it publishes, today's technical signal and key levels, live price — on one page.
See all Gold forecastsBitcoin Price Forecast: $82,300 Breakout Targets $100,000
The weekly chart for Bitcoin shows that the price failed to break below the $60,000 support zone and surged to $82,000. The key resistance now stands at $82,300 and a break above this level will likely open the way toward $100,000. But the price must hold the $60,000 support zone to avoid any further drop toward the $49,100 level.
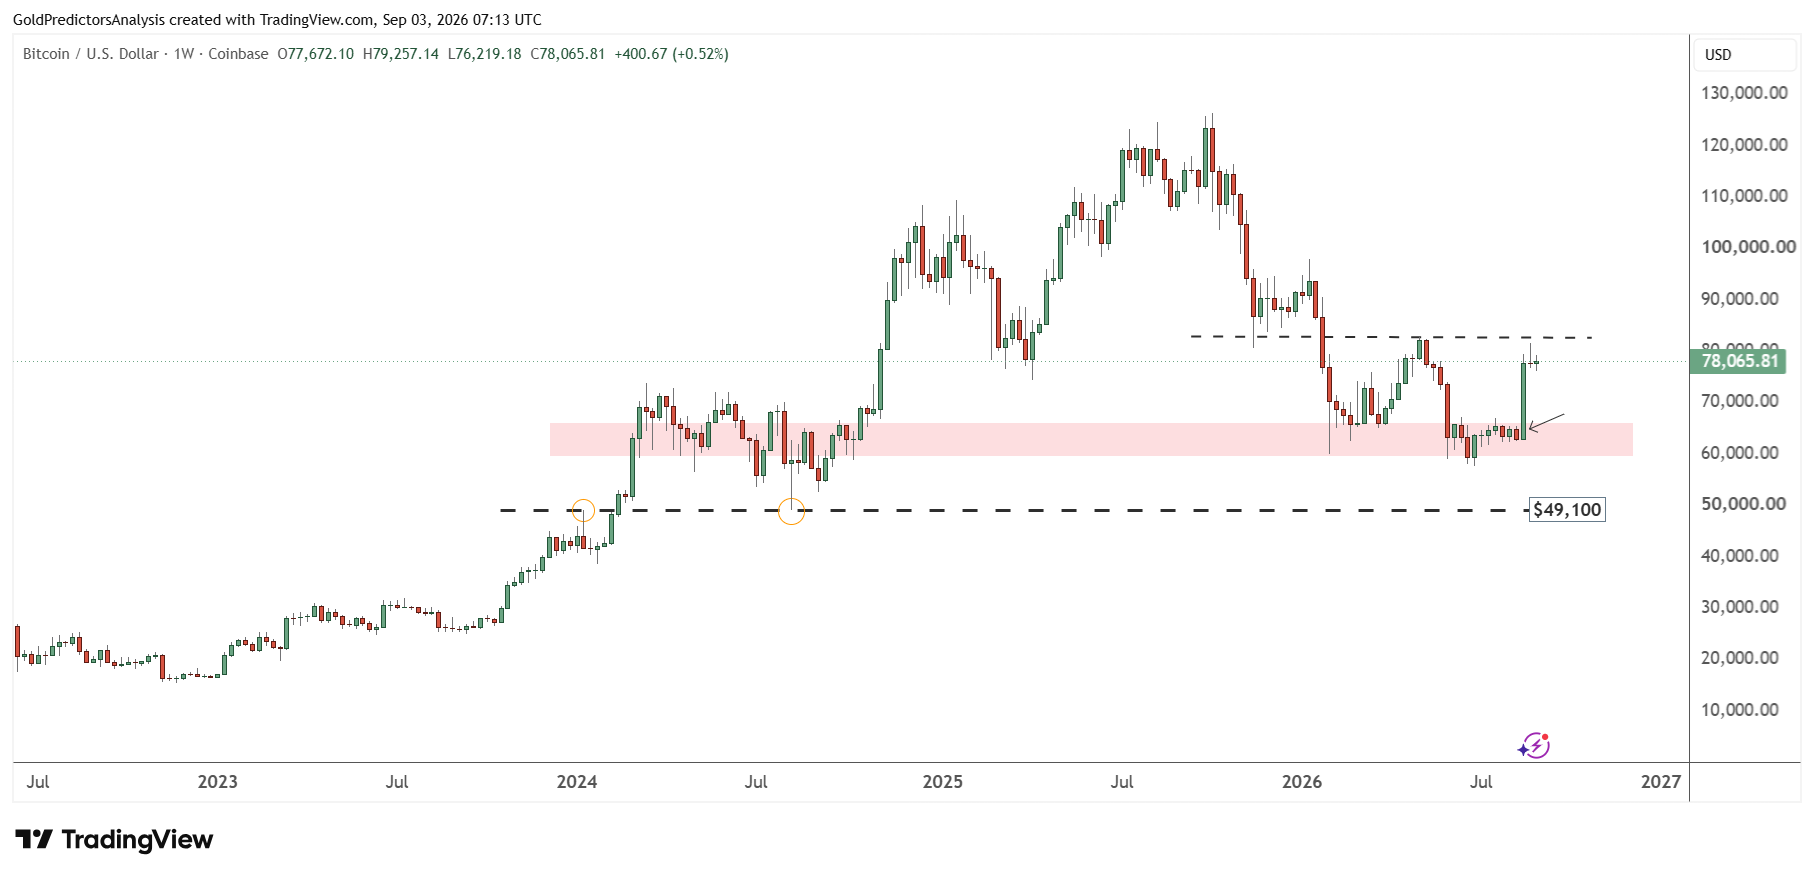
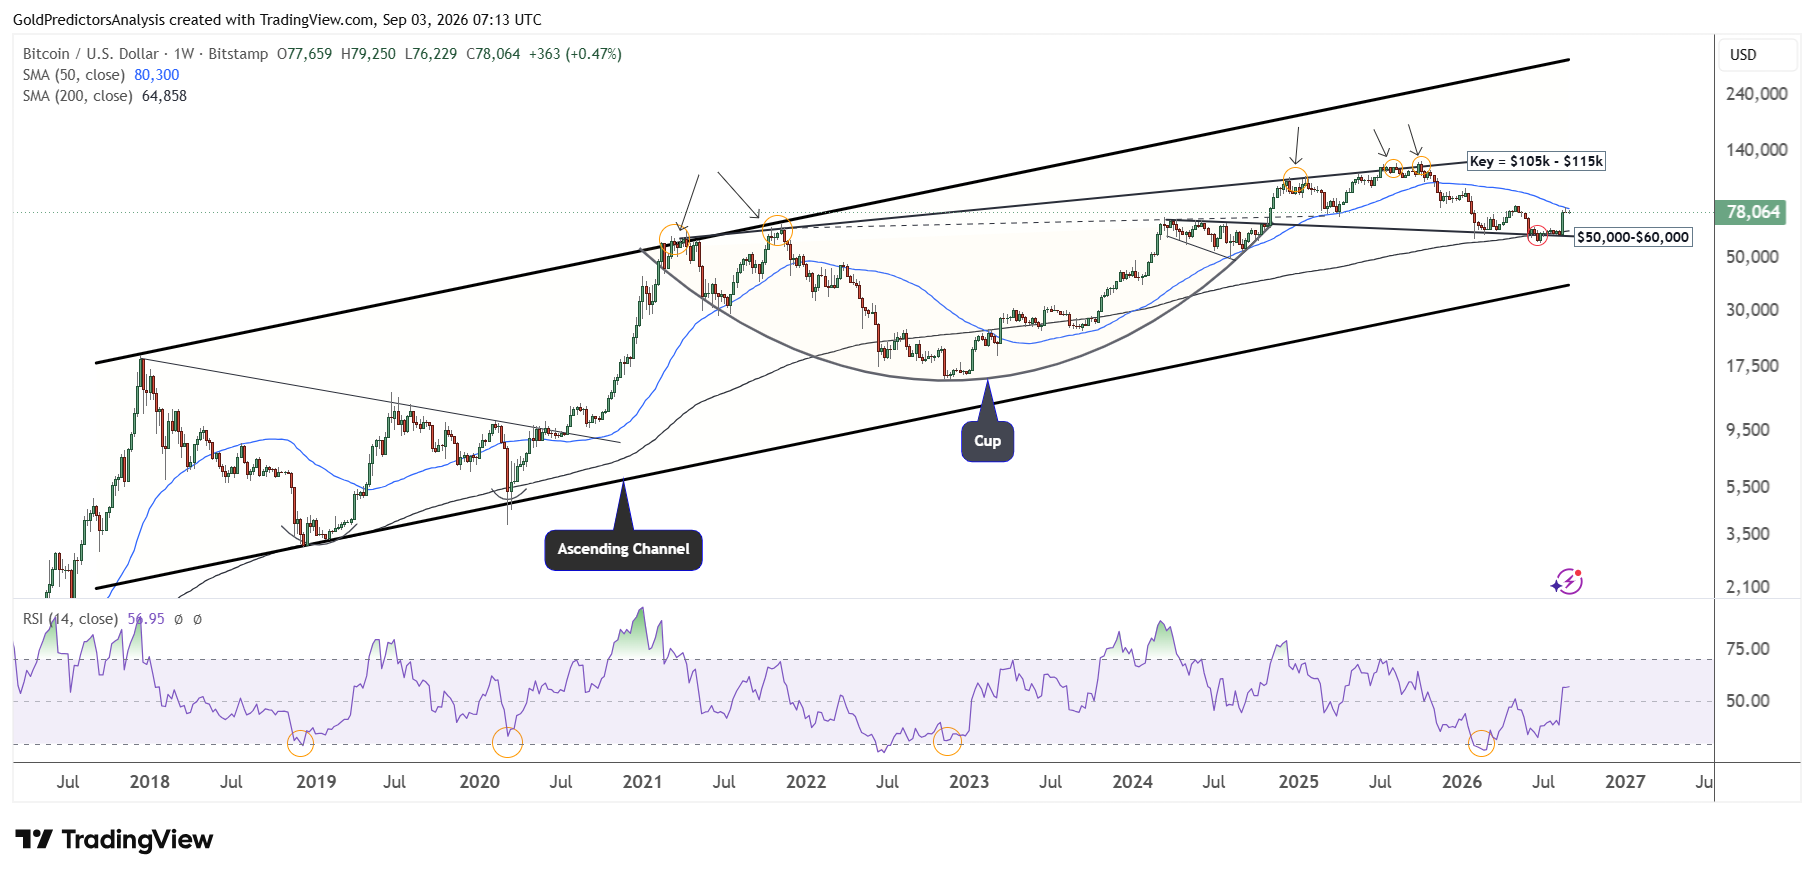
The importance of the $60,000 support was discussed in the previous analysis, which showed that the price rebounded from the 200-week SMA. The price is now challenging the 50-week SMA at $82,300. A break above this level will suggest a rally toward $100,000.
The RSI remains above the midpoint, which points to a positive outlook. As long as Bitcoin remains above $50,000, it will likely remain bullish and trade toward higher levels.
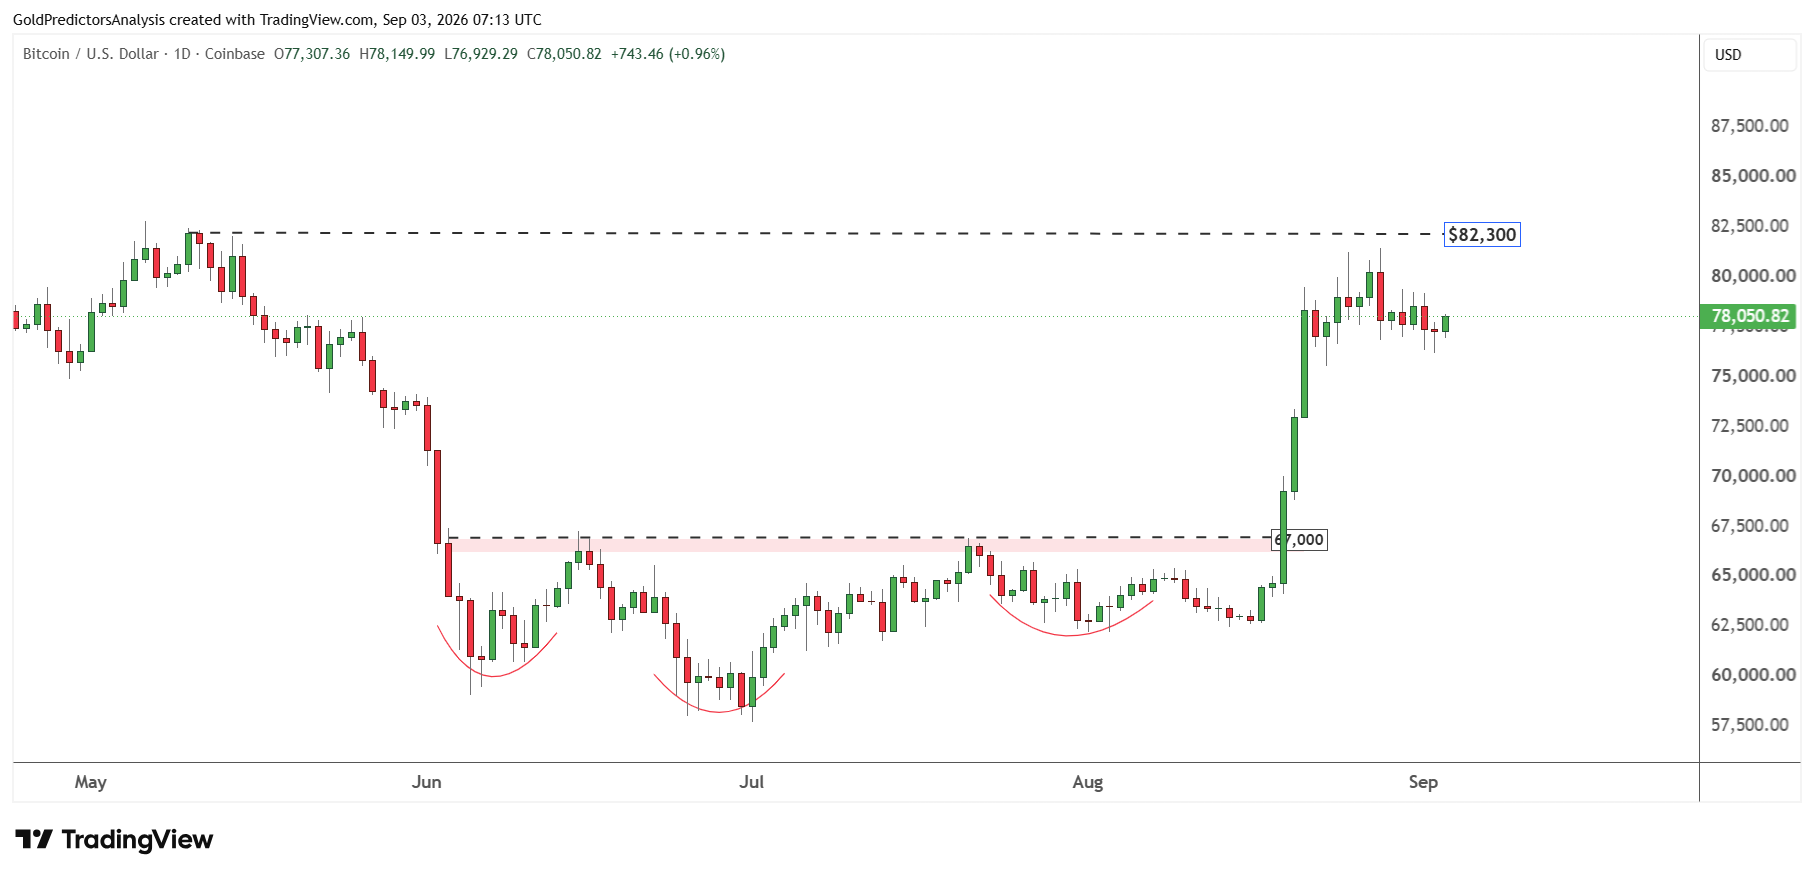
The short-term price structure for Bitcoin remains strongly bullish as seen in the daily chart below. The price formed constructive price action in June and July by consolidating above the $58,000 area. A break above $67,000 indicates positive momentum. But the price must break above $82,300 to trigger the next strong rally.
Gold-to-Bitcoin Ratio Signals the Next Major Move
The monthly chart for gold to bitcoin ratio shows that the ratio has been in a downtrend channel for over 10 years. The previous channel resistance tests have been observed near significant Bitcoin lows and periods of solid gains in the precious metal. But the ratio has already broken the long-term channel and is now dropping from the key resistance of 0.08. The drop in the ratio indicates that Bitcoin is gaining relative strength against gold.
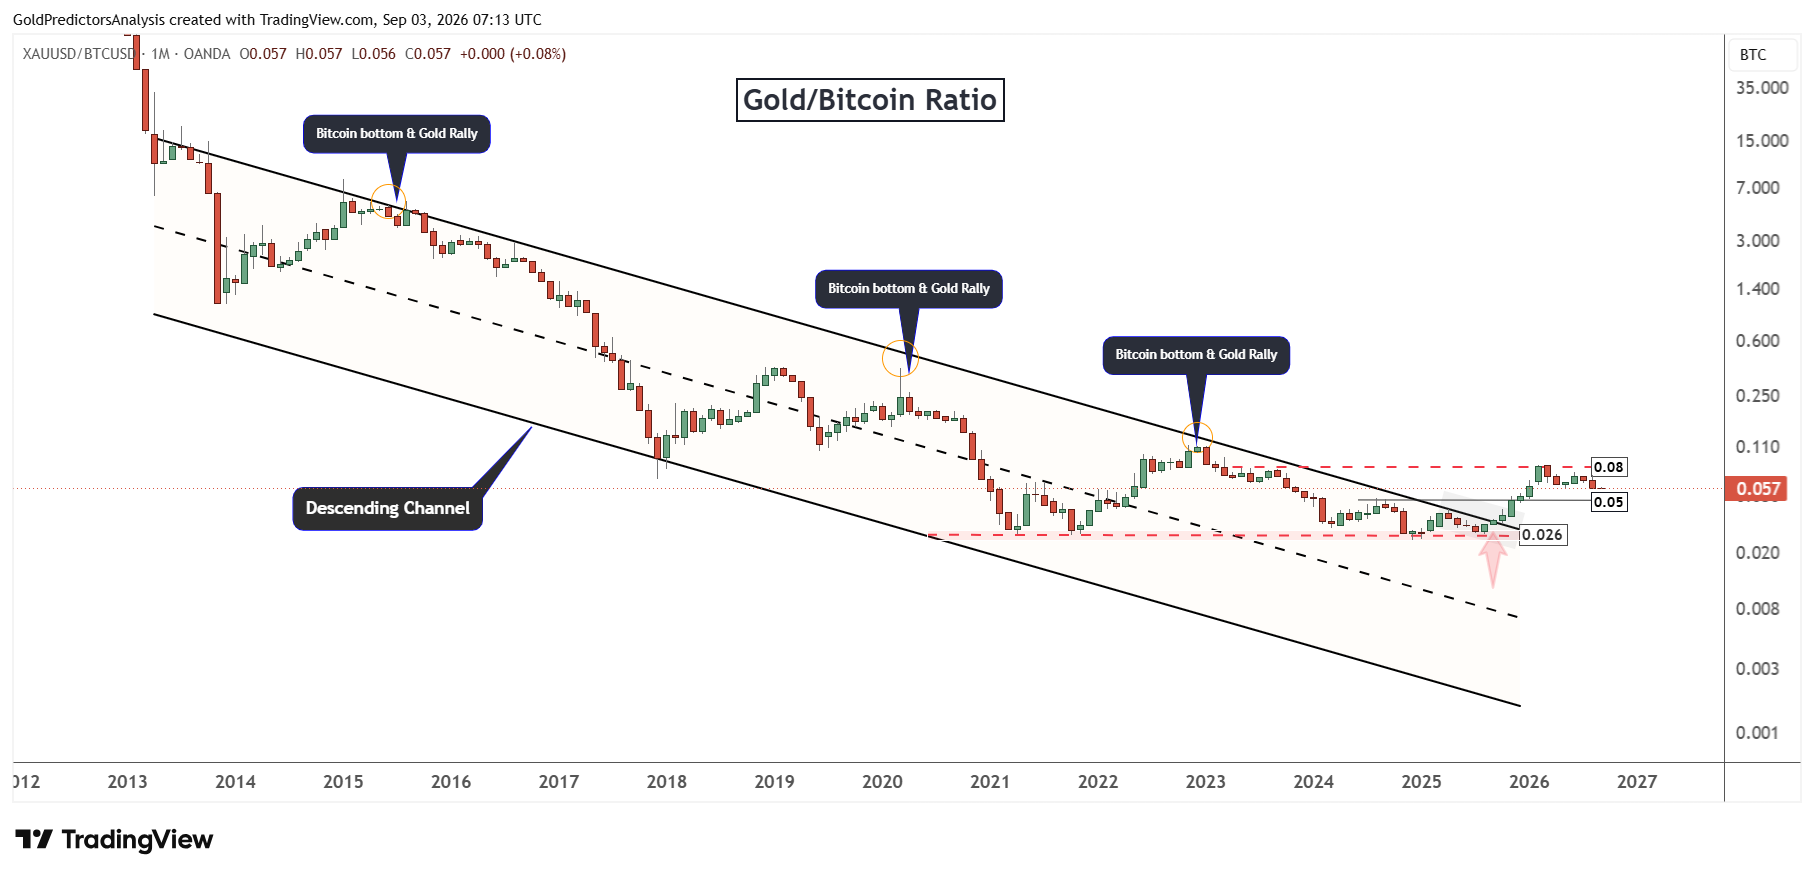
The key support level in the ratio is 0.05. A break below this support will suggest a strong rally in the Bitcoin price. However, a rally above 0.08 will suggest that Bitcoin has some more room to drop before the next rally.
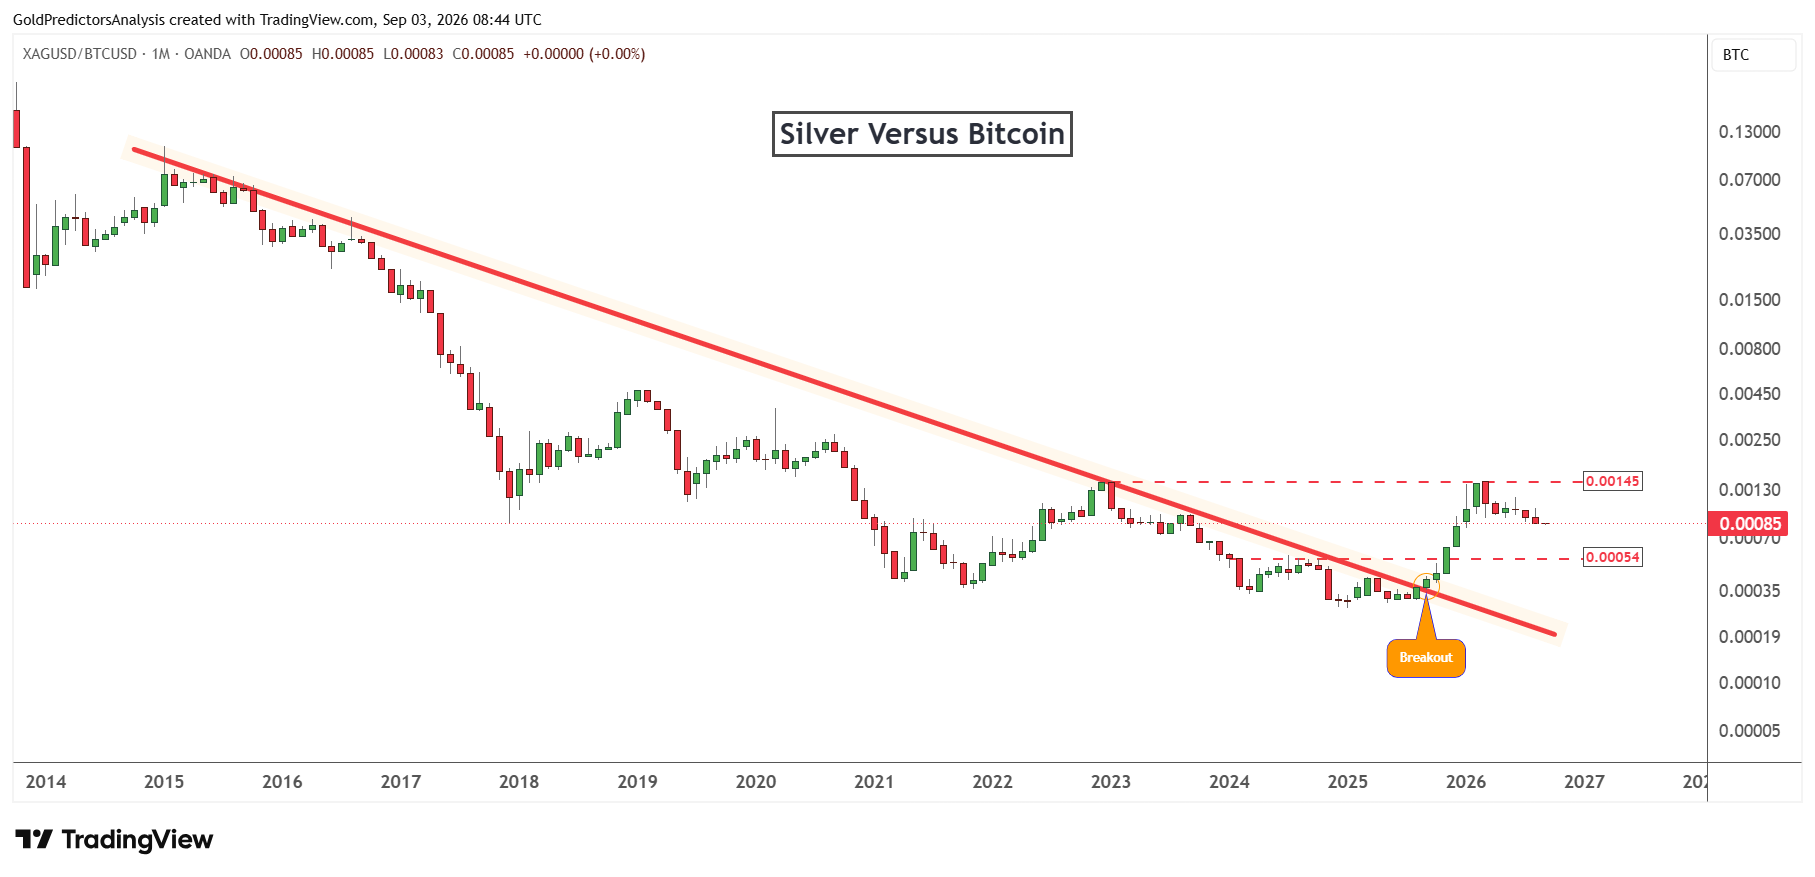
The silver (XAG) to Bitcoin ratio presents the same view. The ratio has broken the descending trend line in September 2025 and rallied toward 0.00145. The ratio is now retreating to approximately 0.00085 but has stayed above the crucial 0.00054 support level. A break above 0.000145 will signal the strength in the precious metals sector.
Bottom Line
Gold and Bitcoin now face an important turning point. The softer hiring and lower US dollar support both assets but high oil prices and geopolitical risks favor gold. In my view, Bitcoin needs to break above $82,300 to initiate the next rally to $100,000. The stronger ETF inflows may support this breakout. But the bullish outlook for Bitcoin is only valid if the price maintains the $60,000 level. Meanwhile, the falling gold to Bitcoin ratio shows that Bitcoin is regaining relative strength. But gold will retain its broader advantage if the ratio remains above 0.05.