
Mild Forecast Overpowers the Storage Surprise
Natural gas had a bullish storage report, high European prices and strong LNG flows behind it Thursday. By Friday, the market was trading the weather again.
The mild outlook is not a one-day forecast. The Commodity Weather Group sees above-normal temperatures across the eastern two-thirds of the country through month-end. That leaves the market with a short cold shot, but not enough heating demand behind it to keep buyers chasing the rally.
November futures gave back 3.71% Friday and December lost 4.16%. The winter strip did not get a lift from the smaller-than-average storage build. It saw mild weather, production coming back and a TCO repair expected over the weekend.
On Friday, November Natural Gas futures settled at $3.116, down $0.120 or -3.71%. December Natural Gas futures closed at $3.386, down $0.147 or -4.16%.

Daily November Natural Gas Technical Analysis
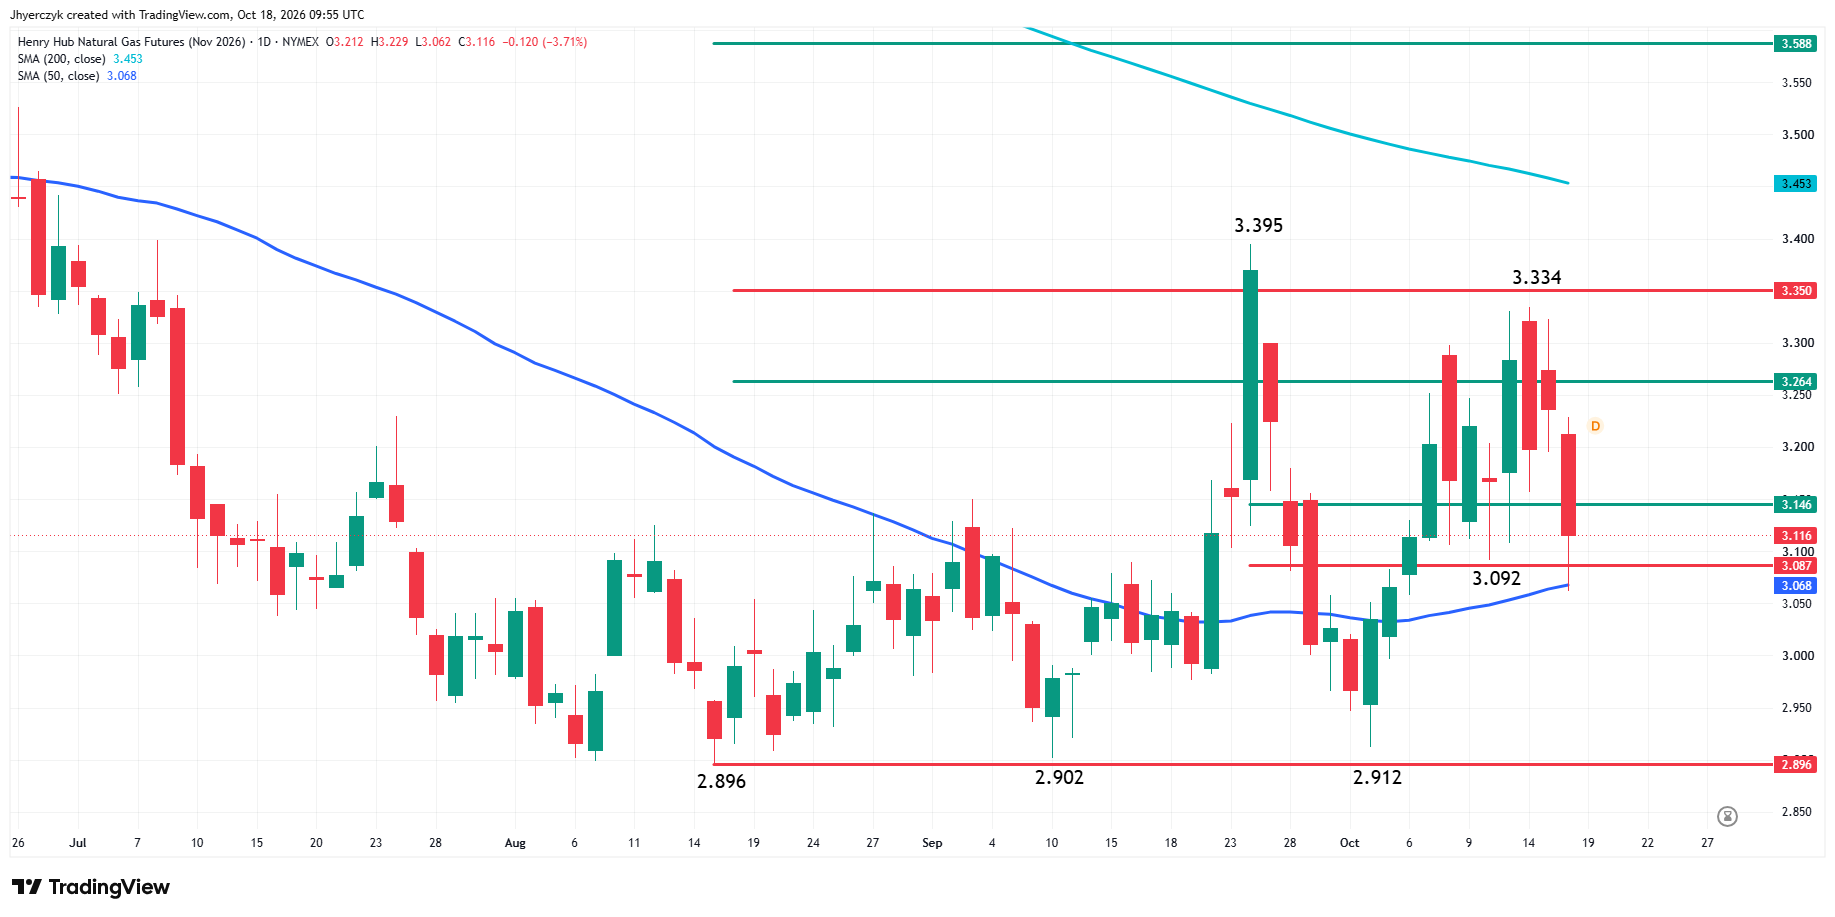
November natural gas futures finished sharply lower on Friday as the market pulled away from major retracement zone resistance at $3.264 to $3.350 for a third straight session.
The main trend is down according to the daily swing chart. The main trend turned down on Friday when sellers took out the October 12 main bottom at $3.092. The new main top is $3.334. A trade through this level will change the main trend to up.
The short-term range is $2.896 to $3.395. On Friday, the market tested its retracement zone at $3.146 to $3.087. The selling pressure briefly pushed the market through the low end of the range. However, it quickly recovered after testing the 50-day moving average at $3.068 before settling at $3.116.
Natural Gas Price Forecast
Every new Natural Gas analysis as it publishes, today's technical signal and key levels, live price — on one page.
See all Natural Gas forecastsDaily December Natural Gas Technical Analysis
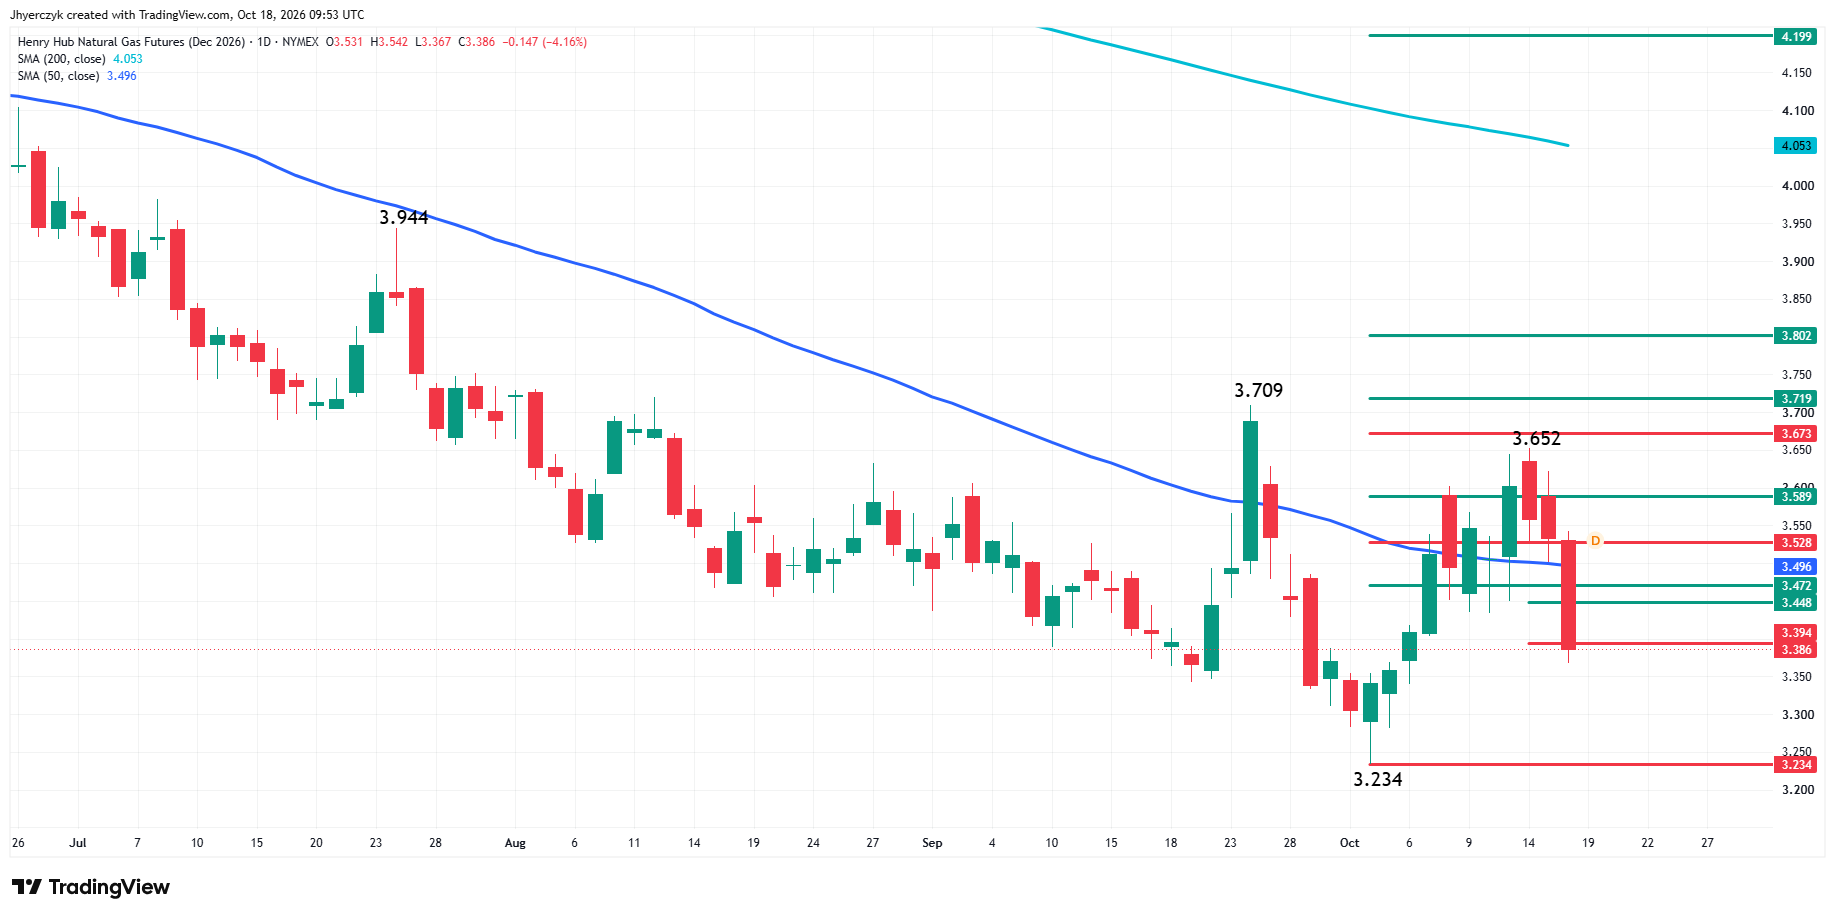
December natural gas futures closed lower on Friday under heavy selling pressure. Prices collapsed when the 50-day moving average at $3.496 failed as support. It is now resistance.
The main trend is down according to the daily swing chart. A trade through $3.652 will change the main trend to up. A move through $3.709 will reaffirm the uptrend. The next major downside target is the main bottom at $3.234.
The short-term range is $3.234 to $3.652. On Friday, the market tested its retracement zone at $3.448 to $3.394. This area could set the tone on Monday. A sustained move under $3.394 could trigger another steep break. A sustained move over $3.448 could lead to a short-covering rally. However, any rally is likely to be labored because of the number of retracement levels, the 50-day moving average and the two swing tops.
The Storage Number Did Not Hold the Rally
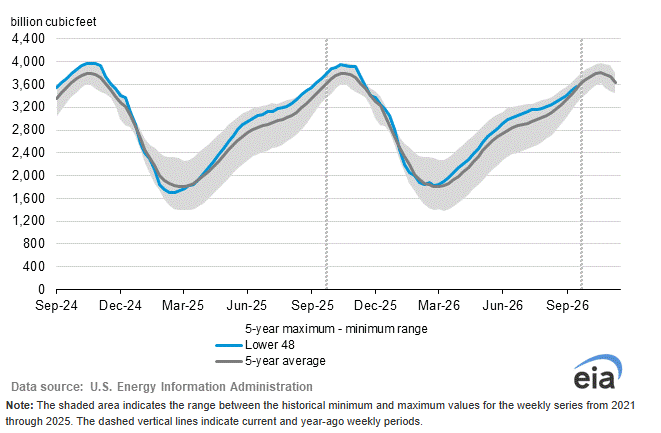
The EIA reported a 67 Bcf storage build for the week ended October 9. Traders had been looking for 74 Bcf, while the five-year average for the week is 90 Bcf.
That was a number buyers could work with on Thursday. It was not enough to keep them involved Friday.
Storage is still 1.3% above the five-year seasonal average, even though inventories are 4.1% below a year ago. The EIA still sees end-of-October storage reaching 3,985 Bcf, the highest level in 10 years and 5% above the five-year average.
Europe Is Still Supporting the Demand Side
European gas prices reached a 3.75-year high Friday. Storage was 74% full on October 14, well below the 89% five-year seasonal average.
U.S. LNG flows were 20.5 Bcf per day, up 6.2% from the prior week. That is still the bullish side of the trade.
Physical prices fell into the weekend outside the East. The market has European demand in front of it, but the weather trade is still winning at home.
LNG can keep the demand side from disappearing. It cannot create heating demand when the weather is not there.
Production Is Coming Back Into the Trade
Lower-48 dry gas production reached 113.9 Bcf per day Friday, up 5.0% from a year earlier, according to BNEF. Lower-48 gas demand was 71.5 Bcf per day, up 1.1% from a year earlier.
That production number is what makes the storage forecast hard to dismiss. The EIA raised its 2027 dry gas production estimate to 116.0 Bcf per day from 115.3 Bcf per day in July. Baker Hughes added one gas rig Friday, bringing the count to 133, just under the September 25 three-year high of 135.
The TCO outage gave the market a supply story Thursday. The expectation that the outage will be resolved Saturday gave traders less reason to carry that premium into the weekend.
What to Watch
The mild forecast gets the first vote when trading opens. Thursday’s smaller storage build, high European prices and strong LNG flows are still part of the bullish case. But the TCO repair, production at 113.9 Bcf per day and warm weather through month-end are the reasons buyers left Friday’s trade.
The November trend turned down after the break under $3.092. The two main tops at $3.334 and $3.395 leave the bias to the downside. The 50-day moving average at $3.068 held Friday’s low, but a sustained move under it puts the main bottoms between $2.912 and $2.896 back in front of the market.
December has the weaker chart after failing at its 50-day moving average. The current setup is bearish with December natural gas futures on the weak side of the 50-day moving average during a swing-chart downtrend. The $3.448 to $3.394 area is Monday’s first line. A recovery through the zone would ease the pressure. A break under it leaves $3.234 as the next major downside target.
More Information in our Economic Calendar.