Bearish Signals Accelerate Downside Pressure
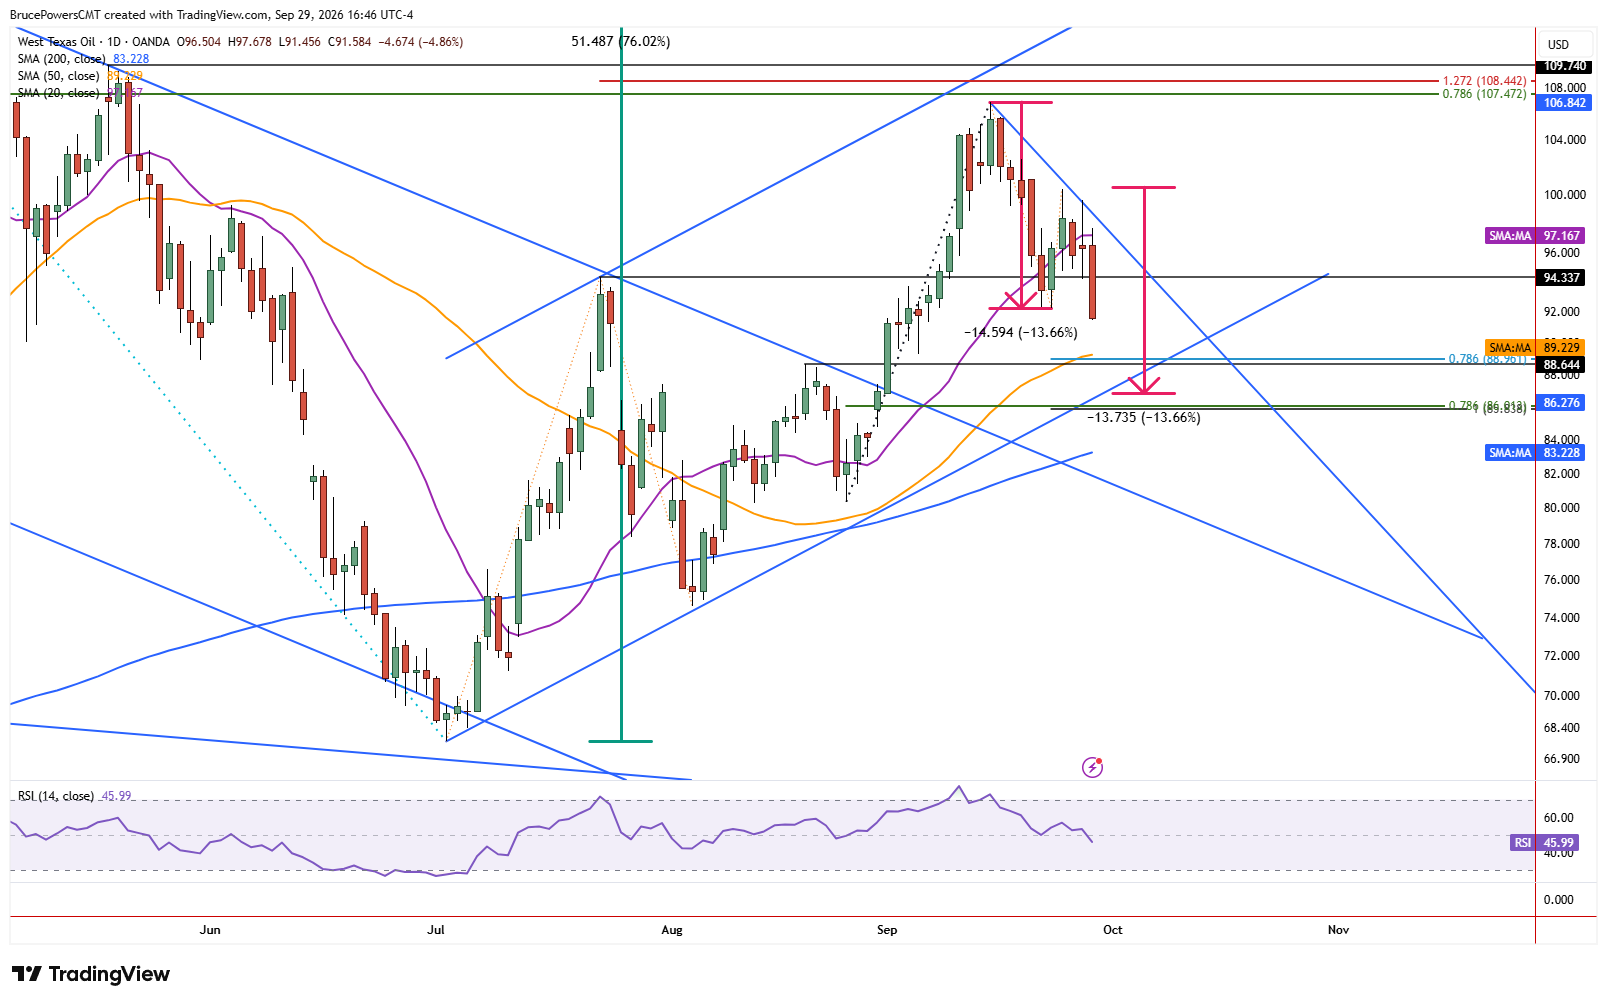
Sellers retained control of WTI crude oil on Tuesday, further confirming a pullback from the recent high and suggesting more downside. Last week a one-week bearish reversal signal triggered a drop below the prior week’s low of $99.22. That week took the form of a bearish shooting star candlestick pattern, leading to a bearish weekly continuation signal below last week’s low of $92.24 on Tuesday. Sellers remain in control at the time of writing, with trading continuing near the current low for the session at $91.61.

Confluence Builds Near $89 Support
These bearish signals show accelerating bearish momentum, putting crude oil on track to test support near the next price zone anchored by the prior swing high of $88.64, and supported by the 78.6% projection for the developing ABCD pattern at $88.96, with the C point on the lower swing high that was established last week at $100.43. There is also the 50-day moving average, currently near $89.23 and rising. The further it rises above the $88.64 high, the greater the chance that support may be found there, above that prior high.
Rising Channel Defines a Moving Support Target
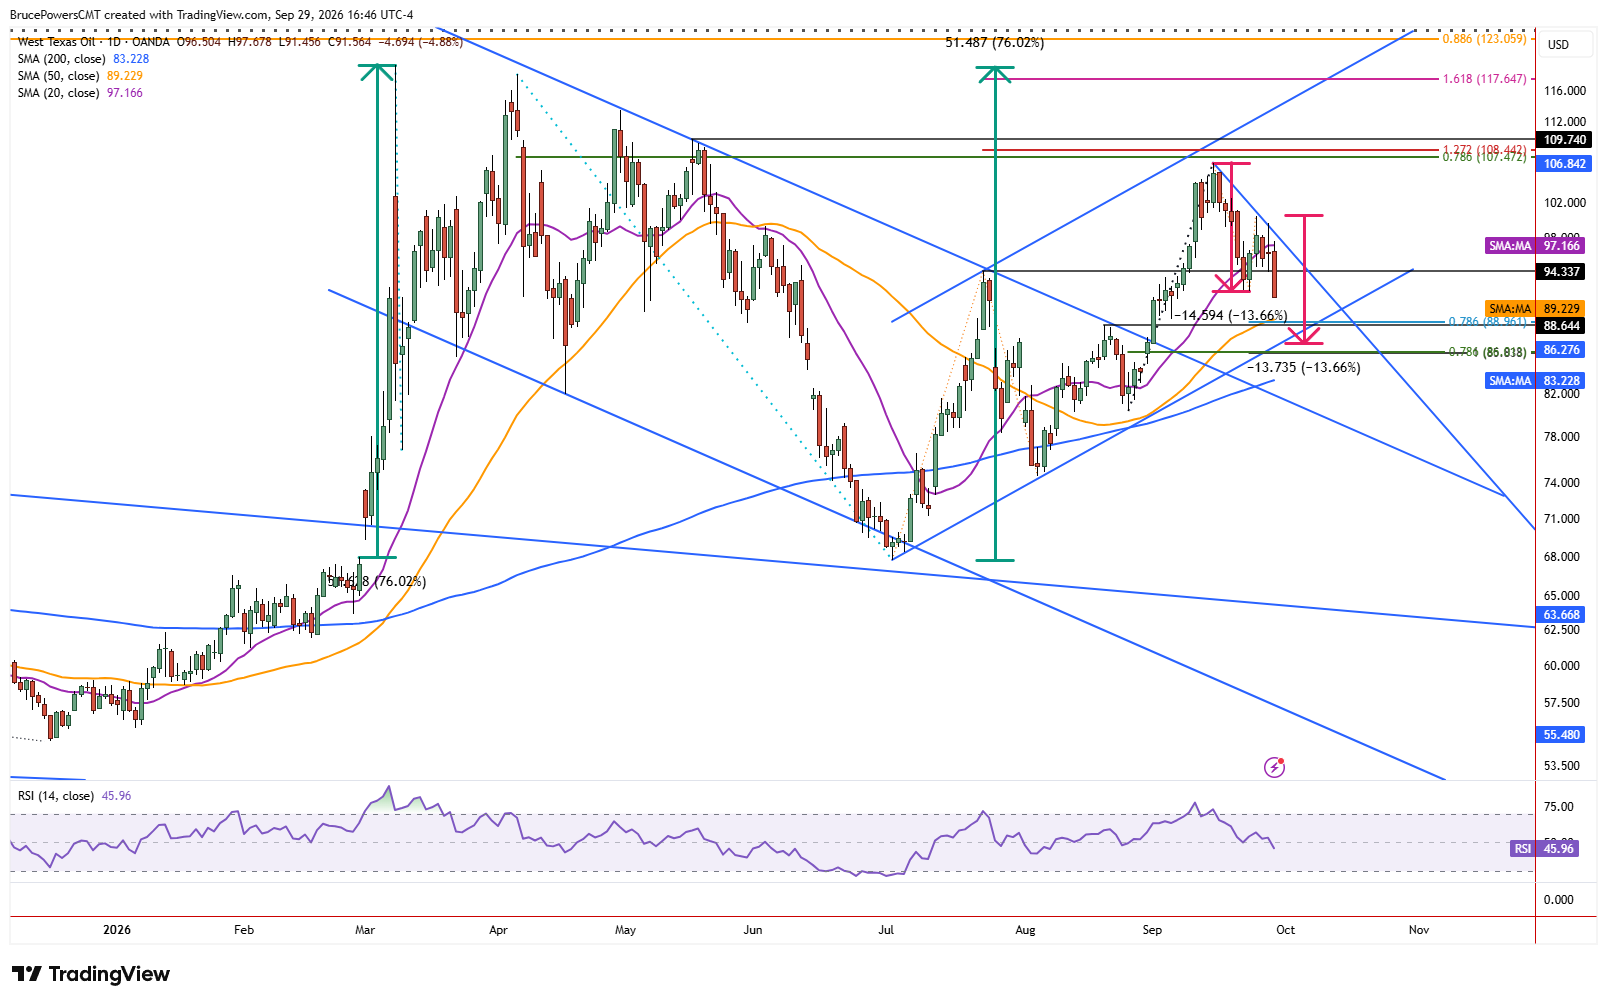
The bearish reversal signal from two weeks ago confirmed resistance near the upper boundary of a rising channel formation, suggesting that downside pressure may persist until support is again tested near the lower boundary of the pattern. The significance of this potential price behavior will depend on when the lower boundary is reached, if it is reached. Since the lower channel boundary is rising it will represent potential support at a higher price area each day until it pushes above $88.64.
Rallies Face Resistance After Support Test
For now, expectations are that support is likely to be seen at the 50-day moving average, which could be followed by signs of strength. Nonetheless, advances will be rising into potential resistance indicated by the short-term bearish trend structure. Key near-term structure resistance starts with Tuesday’s high of $97.68.
If you’d like to know more about how commodity markets work, please visit our educational area.