Gold & Silver Outlook: Fed Hike Bets Surge as Oil, Yields and Dollar Pressure Metals
Gold and silver remain challenged by major trends including energy price inflation, rising US interest rates, and a stronger US dollar.
Federal Reserve Funds Rate futures are increasingly pricing in higher odds of a 50-basis point hike in October. A week ago, those odds were at about 57%, and are now about 72%. Given elevated oil prices, and with the Federal Reserve’s inflation target still unmet, more hawkish comments from Fed officials are expected.
Late last week, St. Louis Fed President James Bullard commented that he would like to see interest rates remain above the 3.25% range, and also reiterated his preference for a restrictive policy for longer than the market is currently implying. On Monday, Fed Governor Cook said she expected additional inflation in the near term due to the recent rise in oil prices and the potential for strong artificial intelligence (AI) related economic activity.
According to Cook, the AI-related inflationary pressures could last for a prolonged period. Federal Reserve officials will speak throughout the week, and a number of key economic reports are scheduled for release, which will be market moving, and likely influence the Fed’s rate decision in October.
The stresses in the bond market are accelerating. The U.S. benchmark yields have been at levels not seen since before the 2008 Financial Crisis. The U.S. dollar is also near its highest level of 2020. Both of these factors lead to a decreased opportunity cost of investing in riskier assets and increase the opportunity cost of holding bullion.
Usually geopolitical risks provide a bid for gold, but the risks of inflation due to geopolitical risks, for example the possible disruption of oil supplies from the U.S. and Iran, work against a bid for gold.
The federal funds rate and inflation expectations became less dovish on Monday. This rate expectations along with other monetary policy expectations caused a sell off in both gold and silver.
From a fundmental viewpoint, expectations of higher rates and inflation work against gold and silver. The U.S. personal consumption expenditure and employment report due out on Friday will be important events for the near-term price outlook for both gold and silver.

Gold Technical Analysis: XAU/USD Holds $4,112 Support as $4,190 Becomes the First Recovery Test
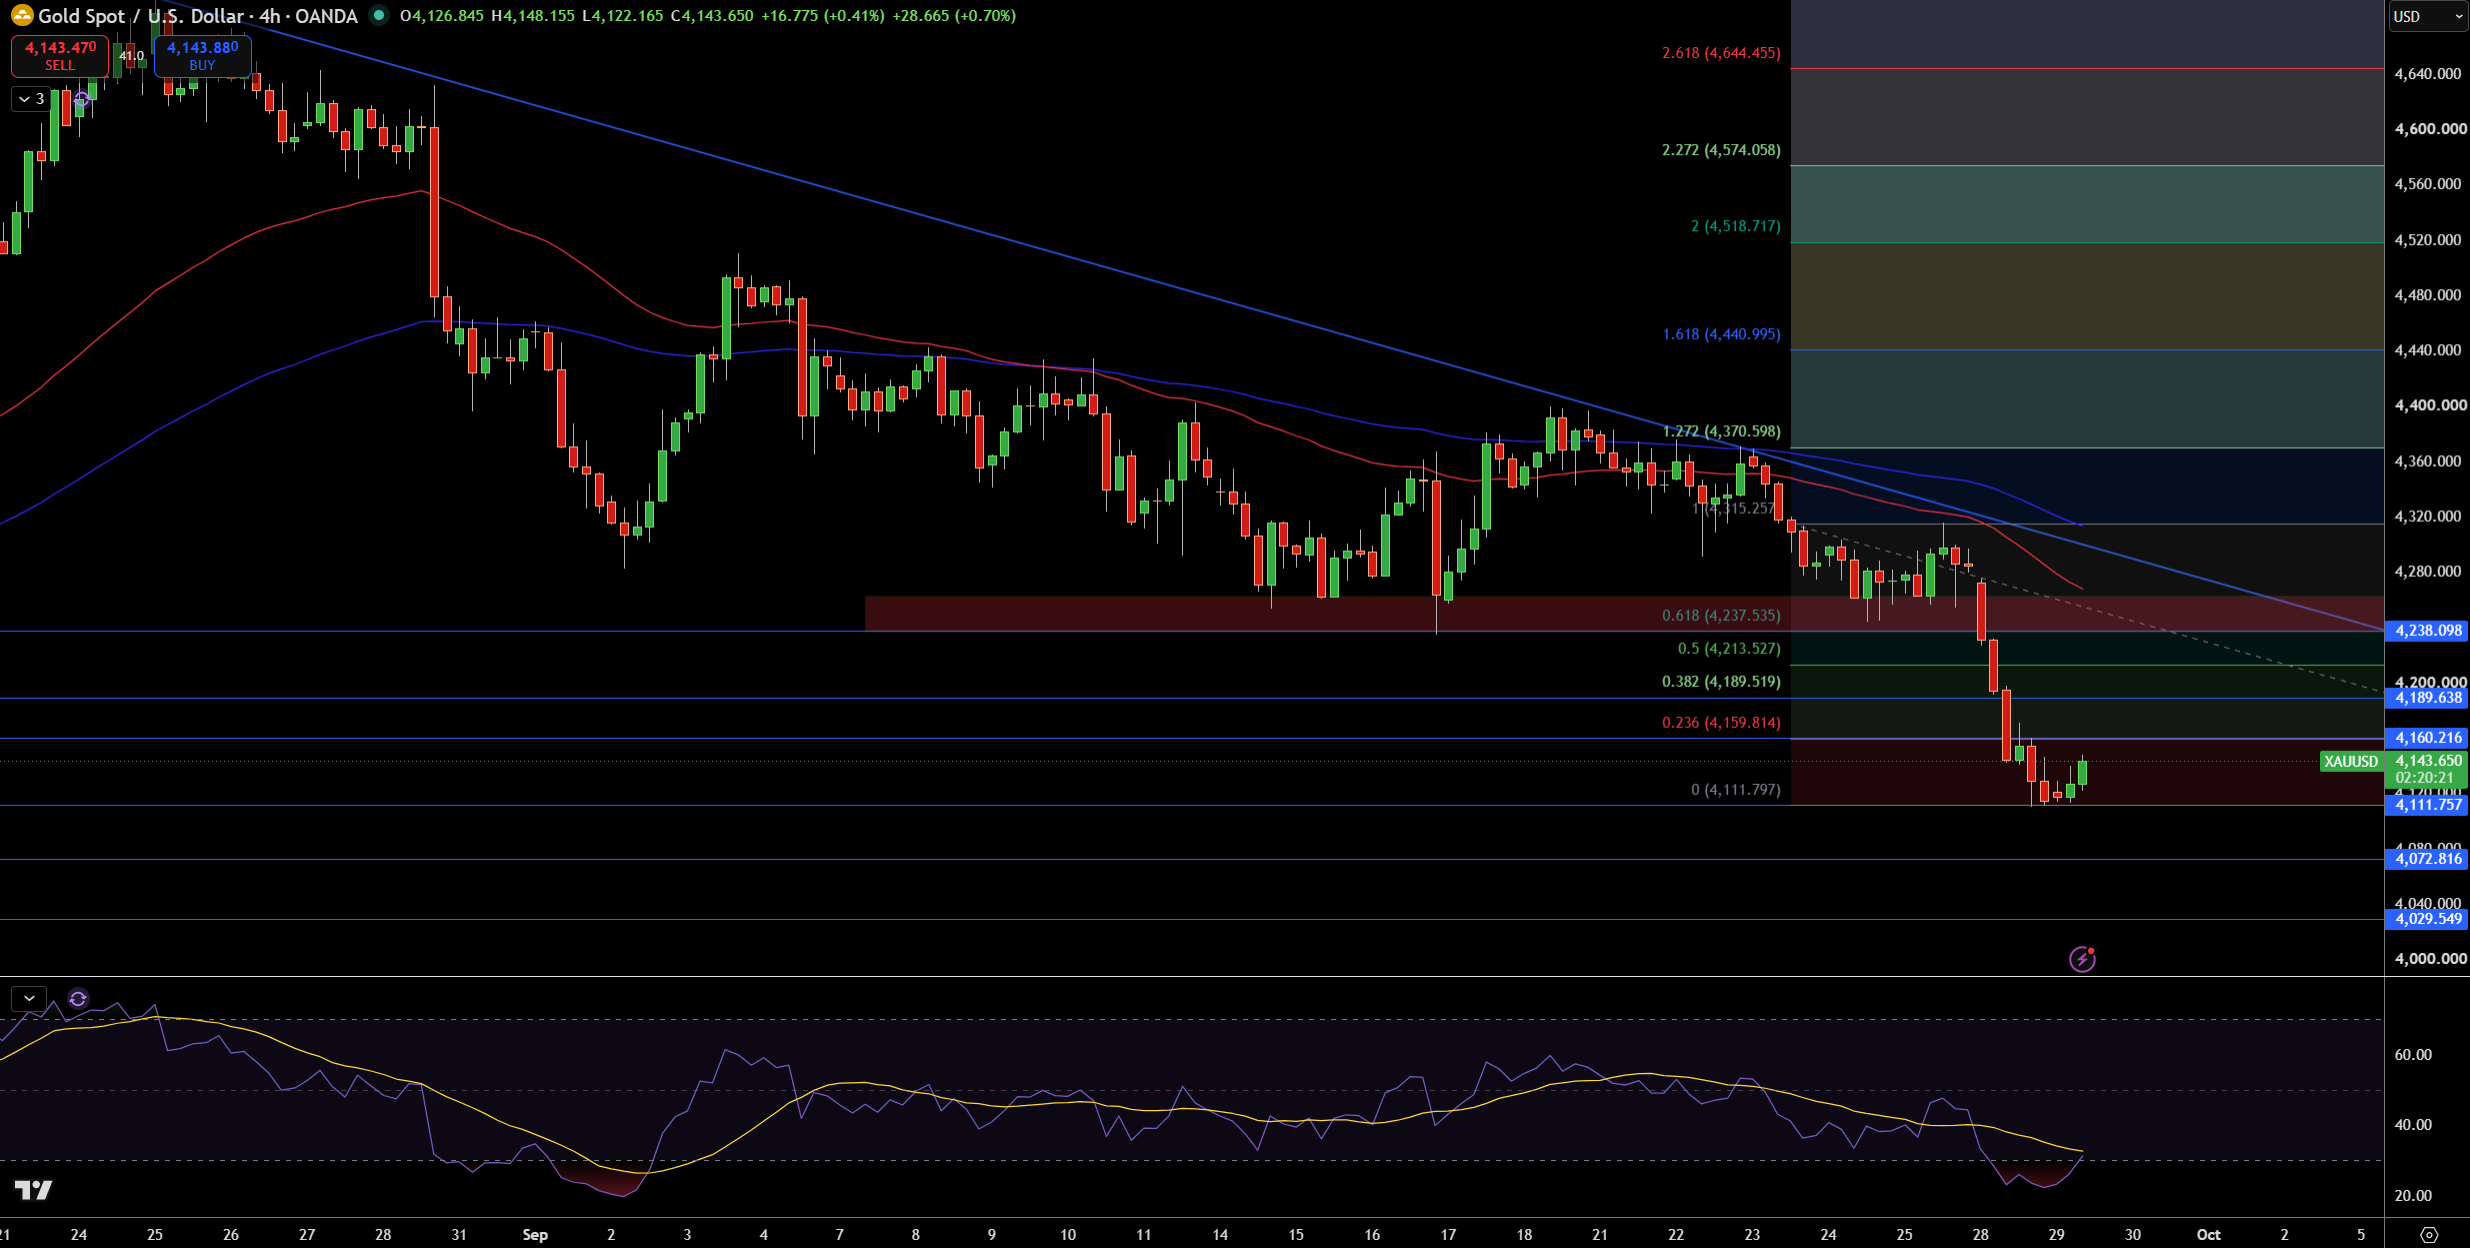
The $4,144 bid offers in gold reflects some near-term mending of the damaged in the price following the recent breakdown below the $4,225-28 support region. I note that gold is currently trading near the $4,112 support region. While I note the price action has almost immediately escalated to a bearish trend, I would consider the area below the moving averages and the falling trend line as bearish territory.
I note near term resistance is located at the $4,190 price level. A break out above $4,190 would place the price in a new near term uptrend with the next target at $4,214 and $4,238. I would expect the price to eventually retest the $4,112 support. A further breakdown in the price would eventually targets the $4,073 and $4,030 price levels.
The relative strength index (RSI) in the lower portion of its range suggests the price of gold is still in a downtrend. I would consider a move and close below the $4,112 support to further strengthen my bearish view. A move above the $4,238 would negate the bearish trend.
Gold Price Forecast
Every new Gold analysis as it publishes, today's technical signal and key levels, live price — on one page.
See all Gold forecastsSilver Technical Analysis: XAG/USD Holds $60.31 as $61.45 Resistance Caps the Bounce
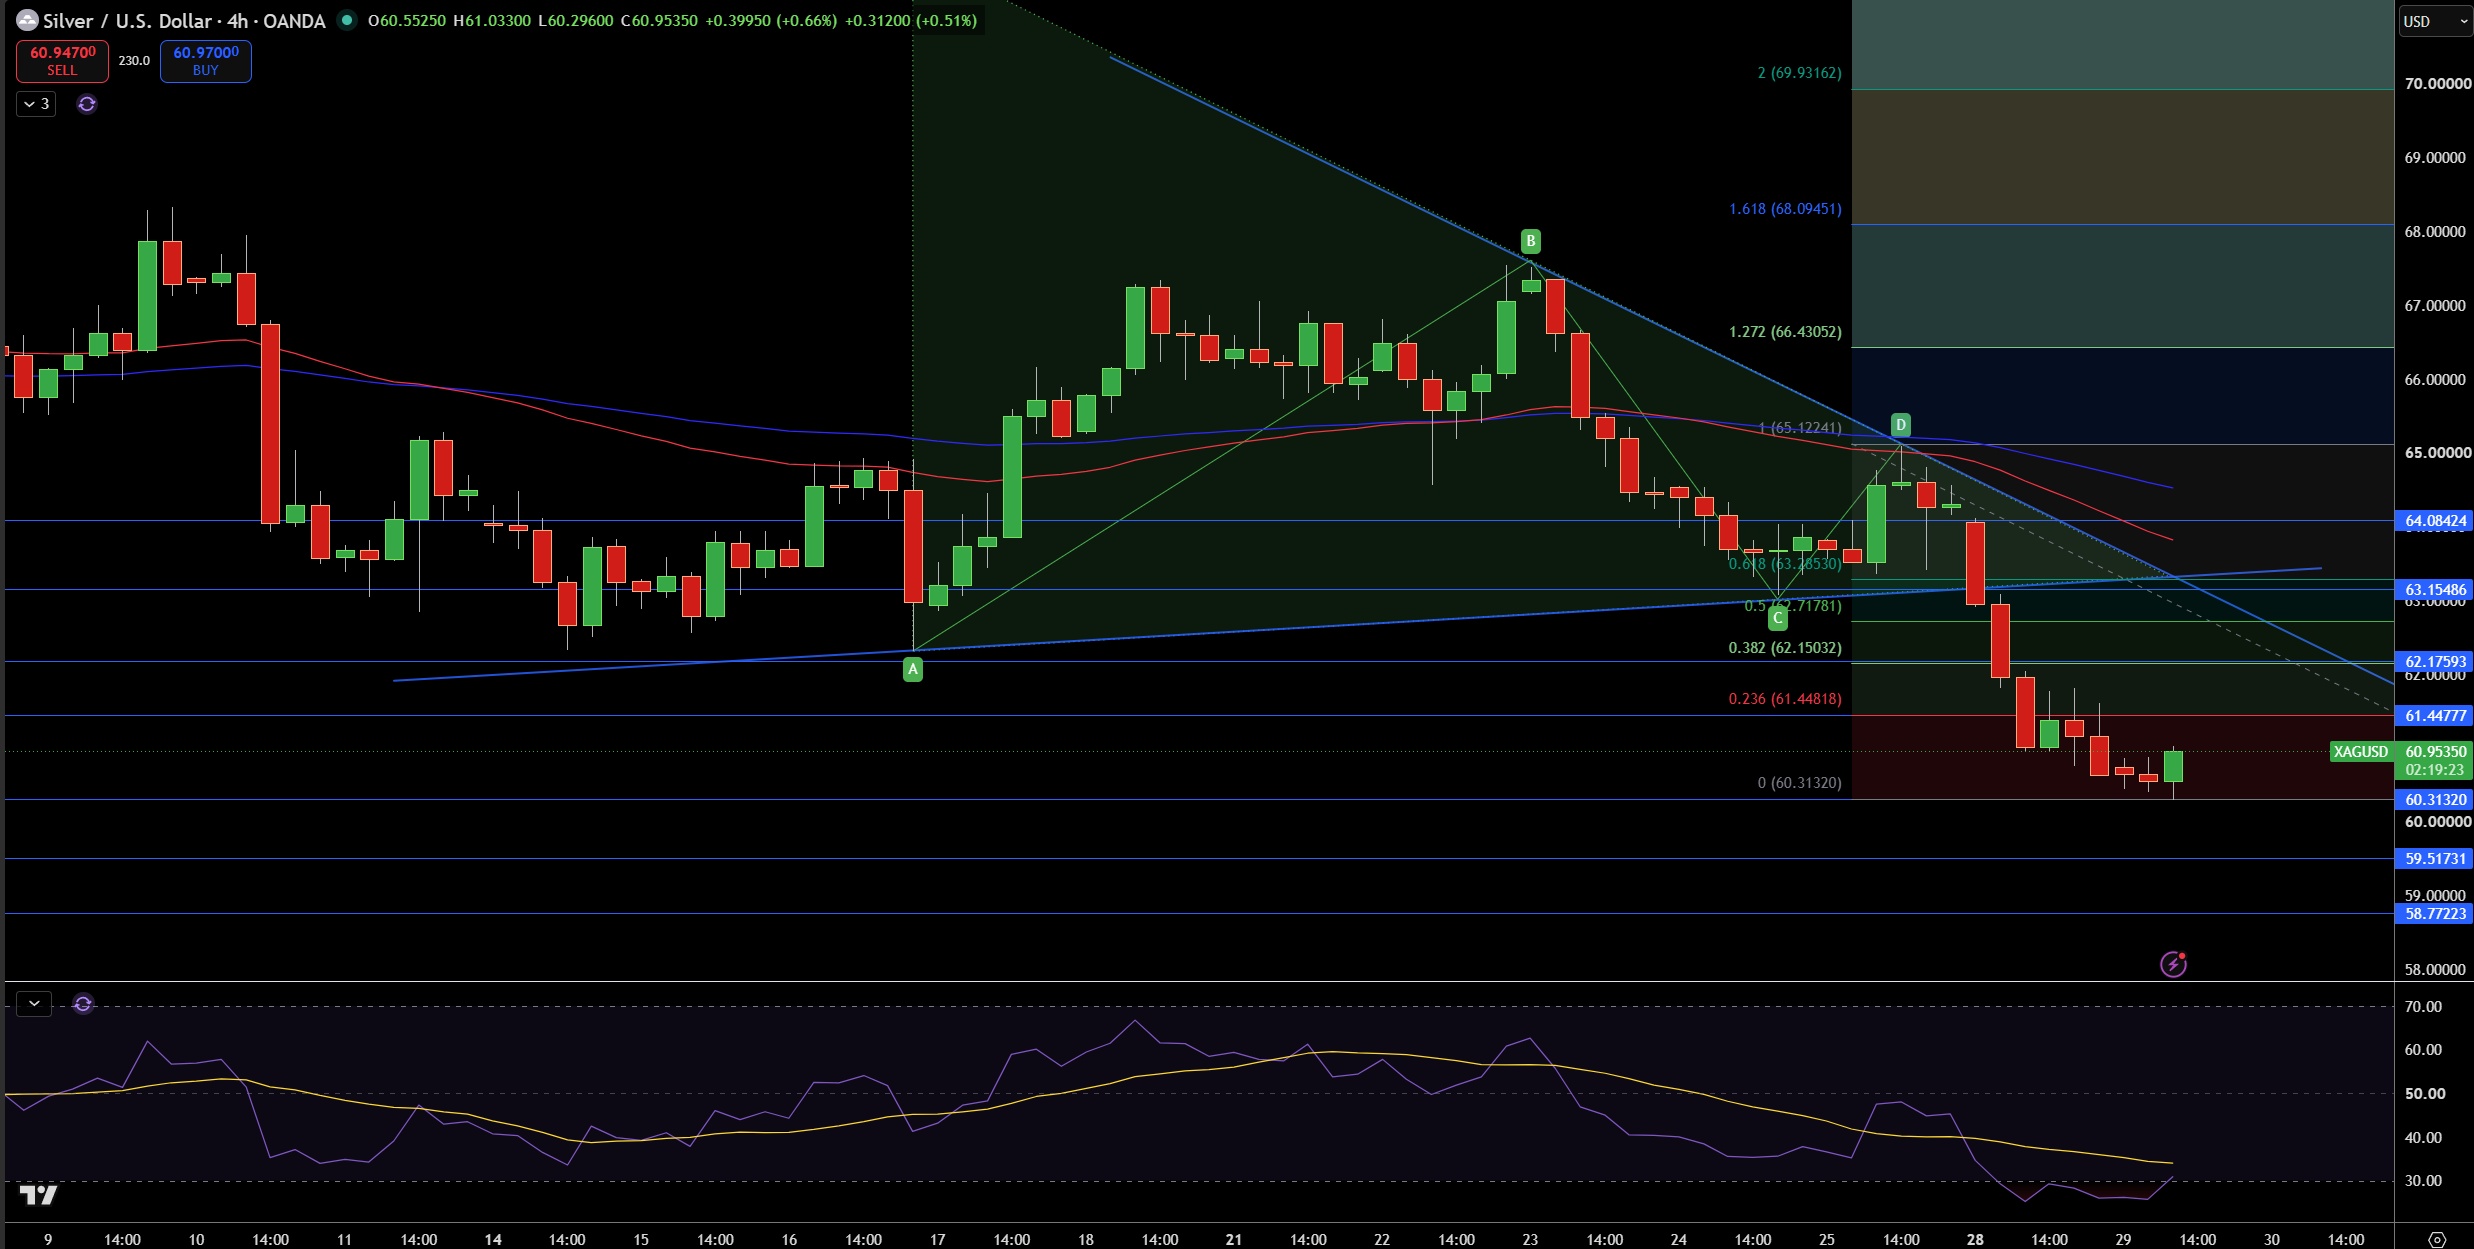
Silver fell to the $60.95 area on the 4 hour chart from the $62.18 area. Silver is still trying to find support above the $60.31 area. The longer term trend is still down as Silver is still trapped below the 200 and 100 SMAs and the bearish trendline.
I expect resistance at $61.45 and if that is broken $62.18 is next. Resistance at $63.15 and $64.08 are further above.
The current decline in prices of Silver has pushed the RSI to the over sold area. Support is expected at $60.31 and below that at $59.52 and $58.77.
I expect Silver to move lower from current levels as long as it trades below the $61.45-$62.18 area. A move above $62.18 would change the short term outlook higher and give support at $60.31. A break below $60.31 support would give an even deeper decline to $59.52 and $58.77.