Key Support Zone Gives Way
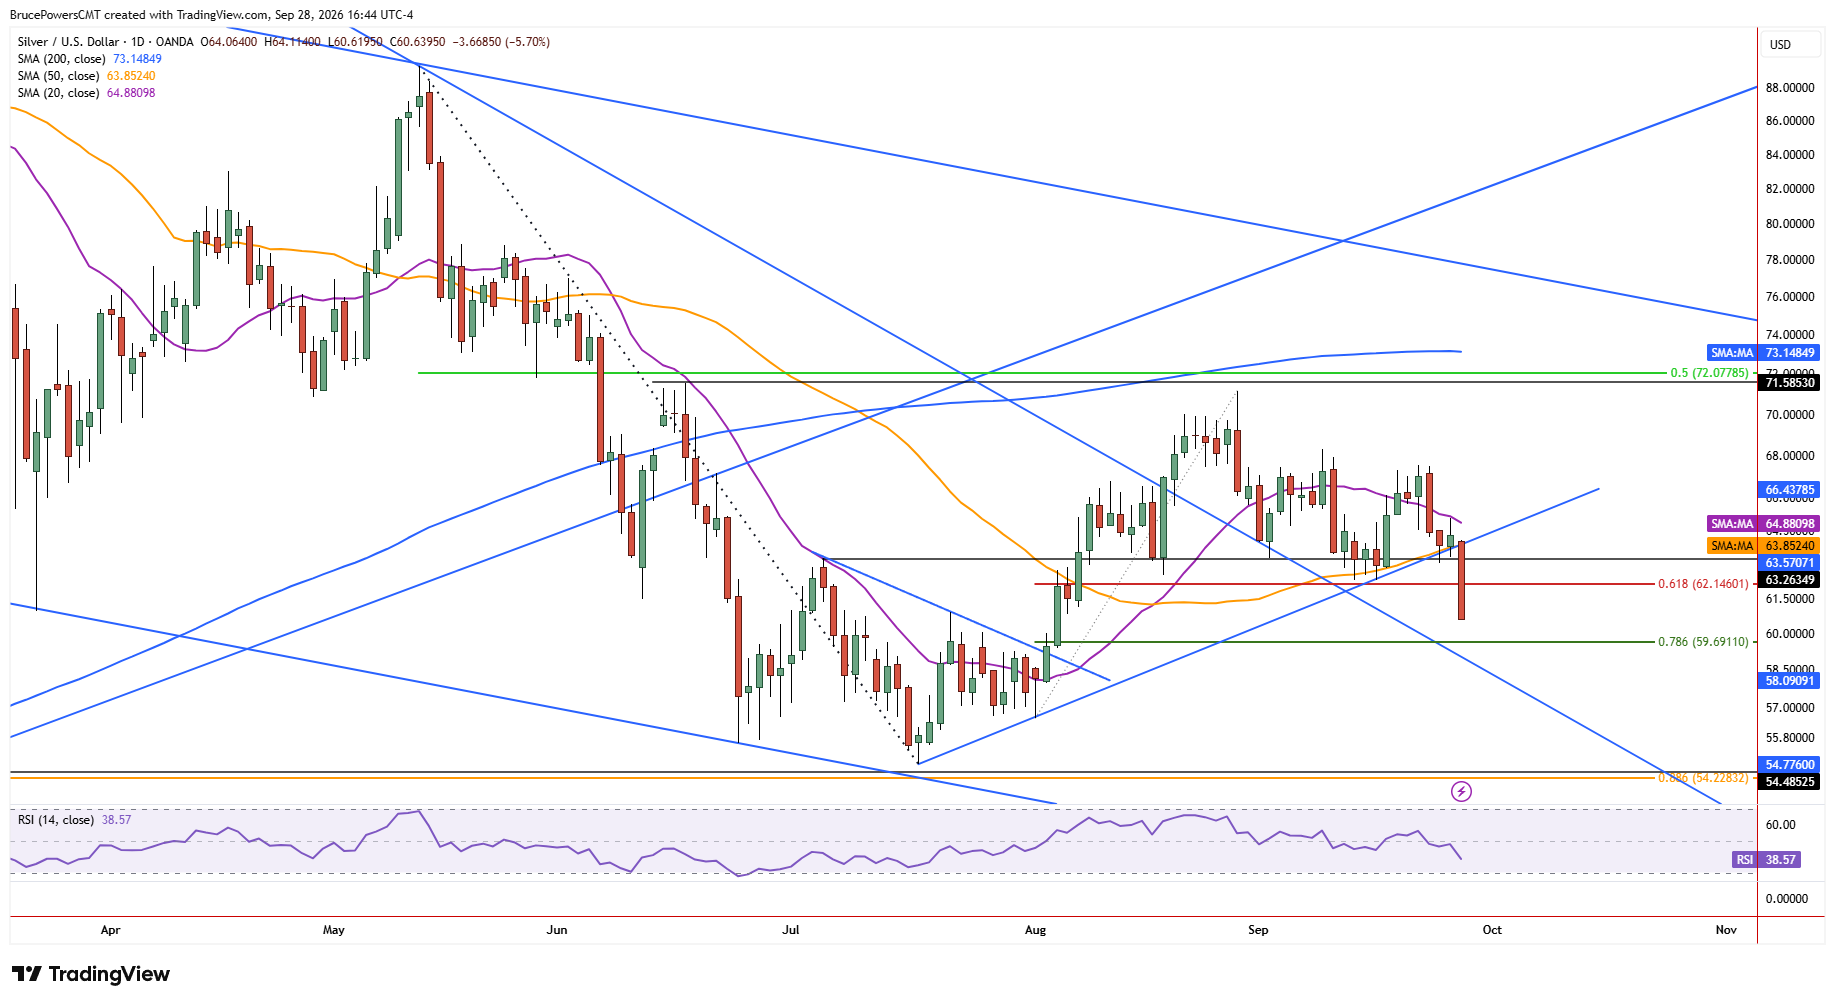
Silver became decidedly more bearish on Monday, with it breaking down below a key support zone and triggering a continuation of the bearish correction. Key support near the 50-day moving average failed to hold after being tested on several days recently. The decline also showed support failing at the 61.8% Fibonacci retracement of the prior advance at $62.15, which had reinforced the support zone that had a swing low of $62.31.

$59.69 Emerges as Next Downside Target
Sellers remain in control at the time of writing with trading continuing near the lows of the day, currently at $60.75. The high of the day at $64.11 recognized resistance near the 50-day moving average, further confirming the potential for bearish momentum. Since the 61.8% Fibonacci retracement zone was recognized as support, the 78.6% Fibonacci retracement at $59.69 becomes a downside target zone.
Bearish Flag Reasserts Longer-Term Pressure
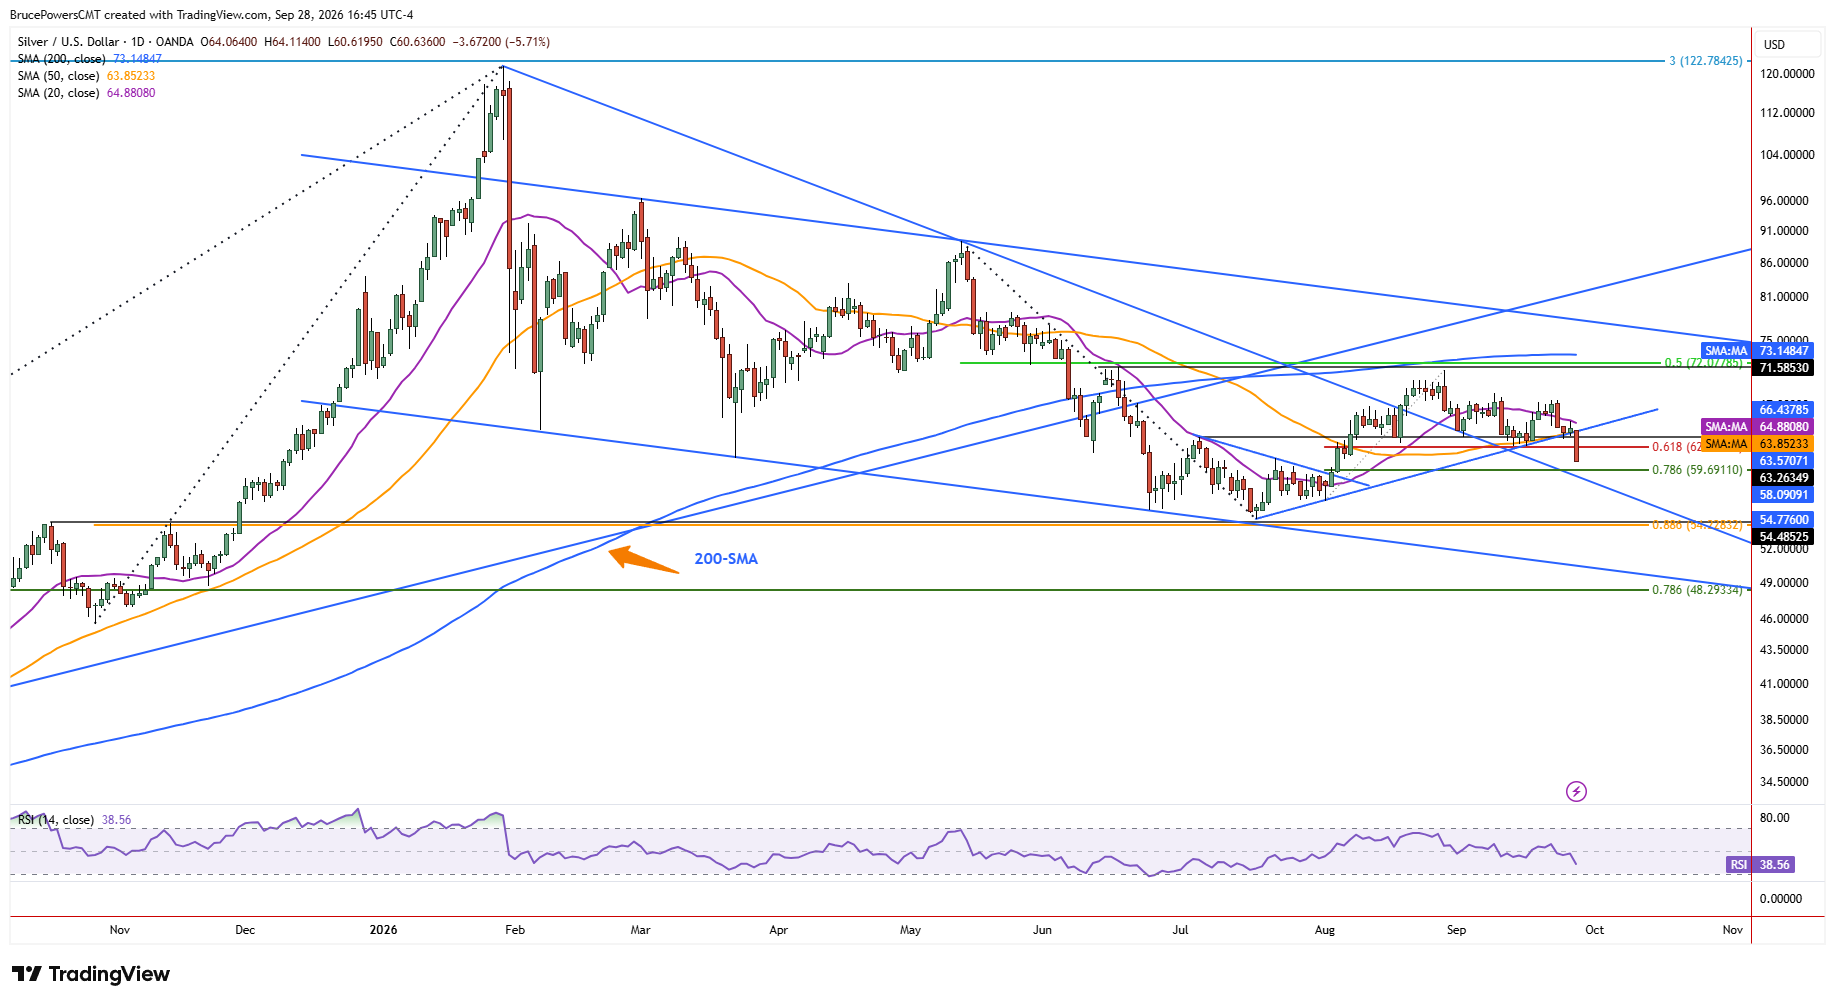
Monday’s decline suggests that the larger declining trend structure may be reasserting its influence and therefore the corrective low of $54.78 from July is at risk of failing as support. The breakdown on Monday triggered a rising bearish flag pattern that formed during the recent counter-trend rally that established a lower swing high at $71.18 and a successful test of resistance near the 200-day moving average. That long-term trend indicator switched from marking potential support to resistance once it was broken to the downside in June. Subsequent weakness, confirmed on Monday, is bearish price behavior and lowers the potential for a bottom soon.
Bounce Scenario Requires a Reclaim
Despite the bearish implication of Monday’s decline, if support is found near the 78.6% Fibonacci retracement at $59.69 a bounce to test resistance near the 50-day moving average at $63.85 could follow. But a sustained advance above the 50-day moving average would be needed before the outlook shifts toward bullish.
If you’d like to know more about how to trade gold and silver, please visit our educational area.