USOIL, UKOil & Natural Gas Outlook: Iran Talks Stall as Gulf Exports Recover and LNG Supply Stays Tight
Between the return of Iranian oil and the ongoing U.S.-Iran tensions, the price of oil is expected to remain volatile in the short-term. On the weekend, it was reported that U.S. President Trump refused an Iranian plan to end the conflict in the region and re-open Hormuz Strait. Trump’s rejection to the plan increased uncertainty around the Hormuz Strait and continued the supply premium on both WTI and Brent.
Physical supplies of both crude oils are improving. Satellite images analysed by German energy data firm Kpler, showed that in September, crude oil supplies from OPEC countries increased to 12.8 million bpd. The increase was mainly attributed to increases in oil loadings from Saudi Arabia and UAE. The increase in loadings has also contributed to an increase in ship-to-ship transfers in the Oman Sea. Ship-to-ship transfers are an expensive and risky method to make up for the Iranian oil supply.
Recovering flows of Hormuz crude have increased, and the restored East-West pipeline has reduced Saudi Arabian land crude exports. As a result, crude oil exports from the Persian Gulf are increasing. Much higher than usual shipping rates are driving the increases in crude exports as shuttling between loading and discharge areas increases the total capacity required for crude oil shipments. If diplomacy and a reduction in Gulf tensions allow for the reopening of the Hormuz Strait, crude oil exports and shipments from the Persian Gulf would likely increase, making crude oil shipments from other regions of the world less necessary. The increased attacks on Saudi Arabian and Emirati oil facilities have lowered crude oil exports from those areas.
Naturally, increased tensions in the region have decreased the shipments of Liquefied Natural Gas (LNG) from the Persian Gulf, further increasing regional tensions. Analysts expect that natural gas prices will remain high and LNG demand will remain low in 2023. Fundamental bias: USOIL and UKOIL neutral-to-bullish; Natural Gas bullish.
Natural Gas Technical Analysis: NG Holds $3.11 Support as $3.20–$3.27 Resistance Caps Momentum
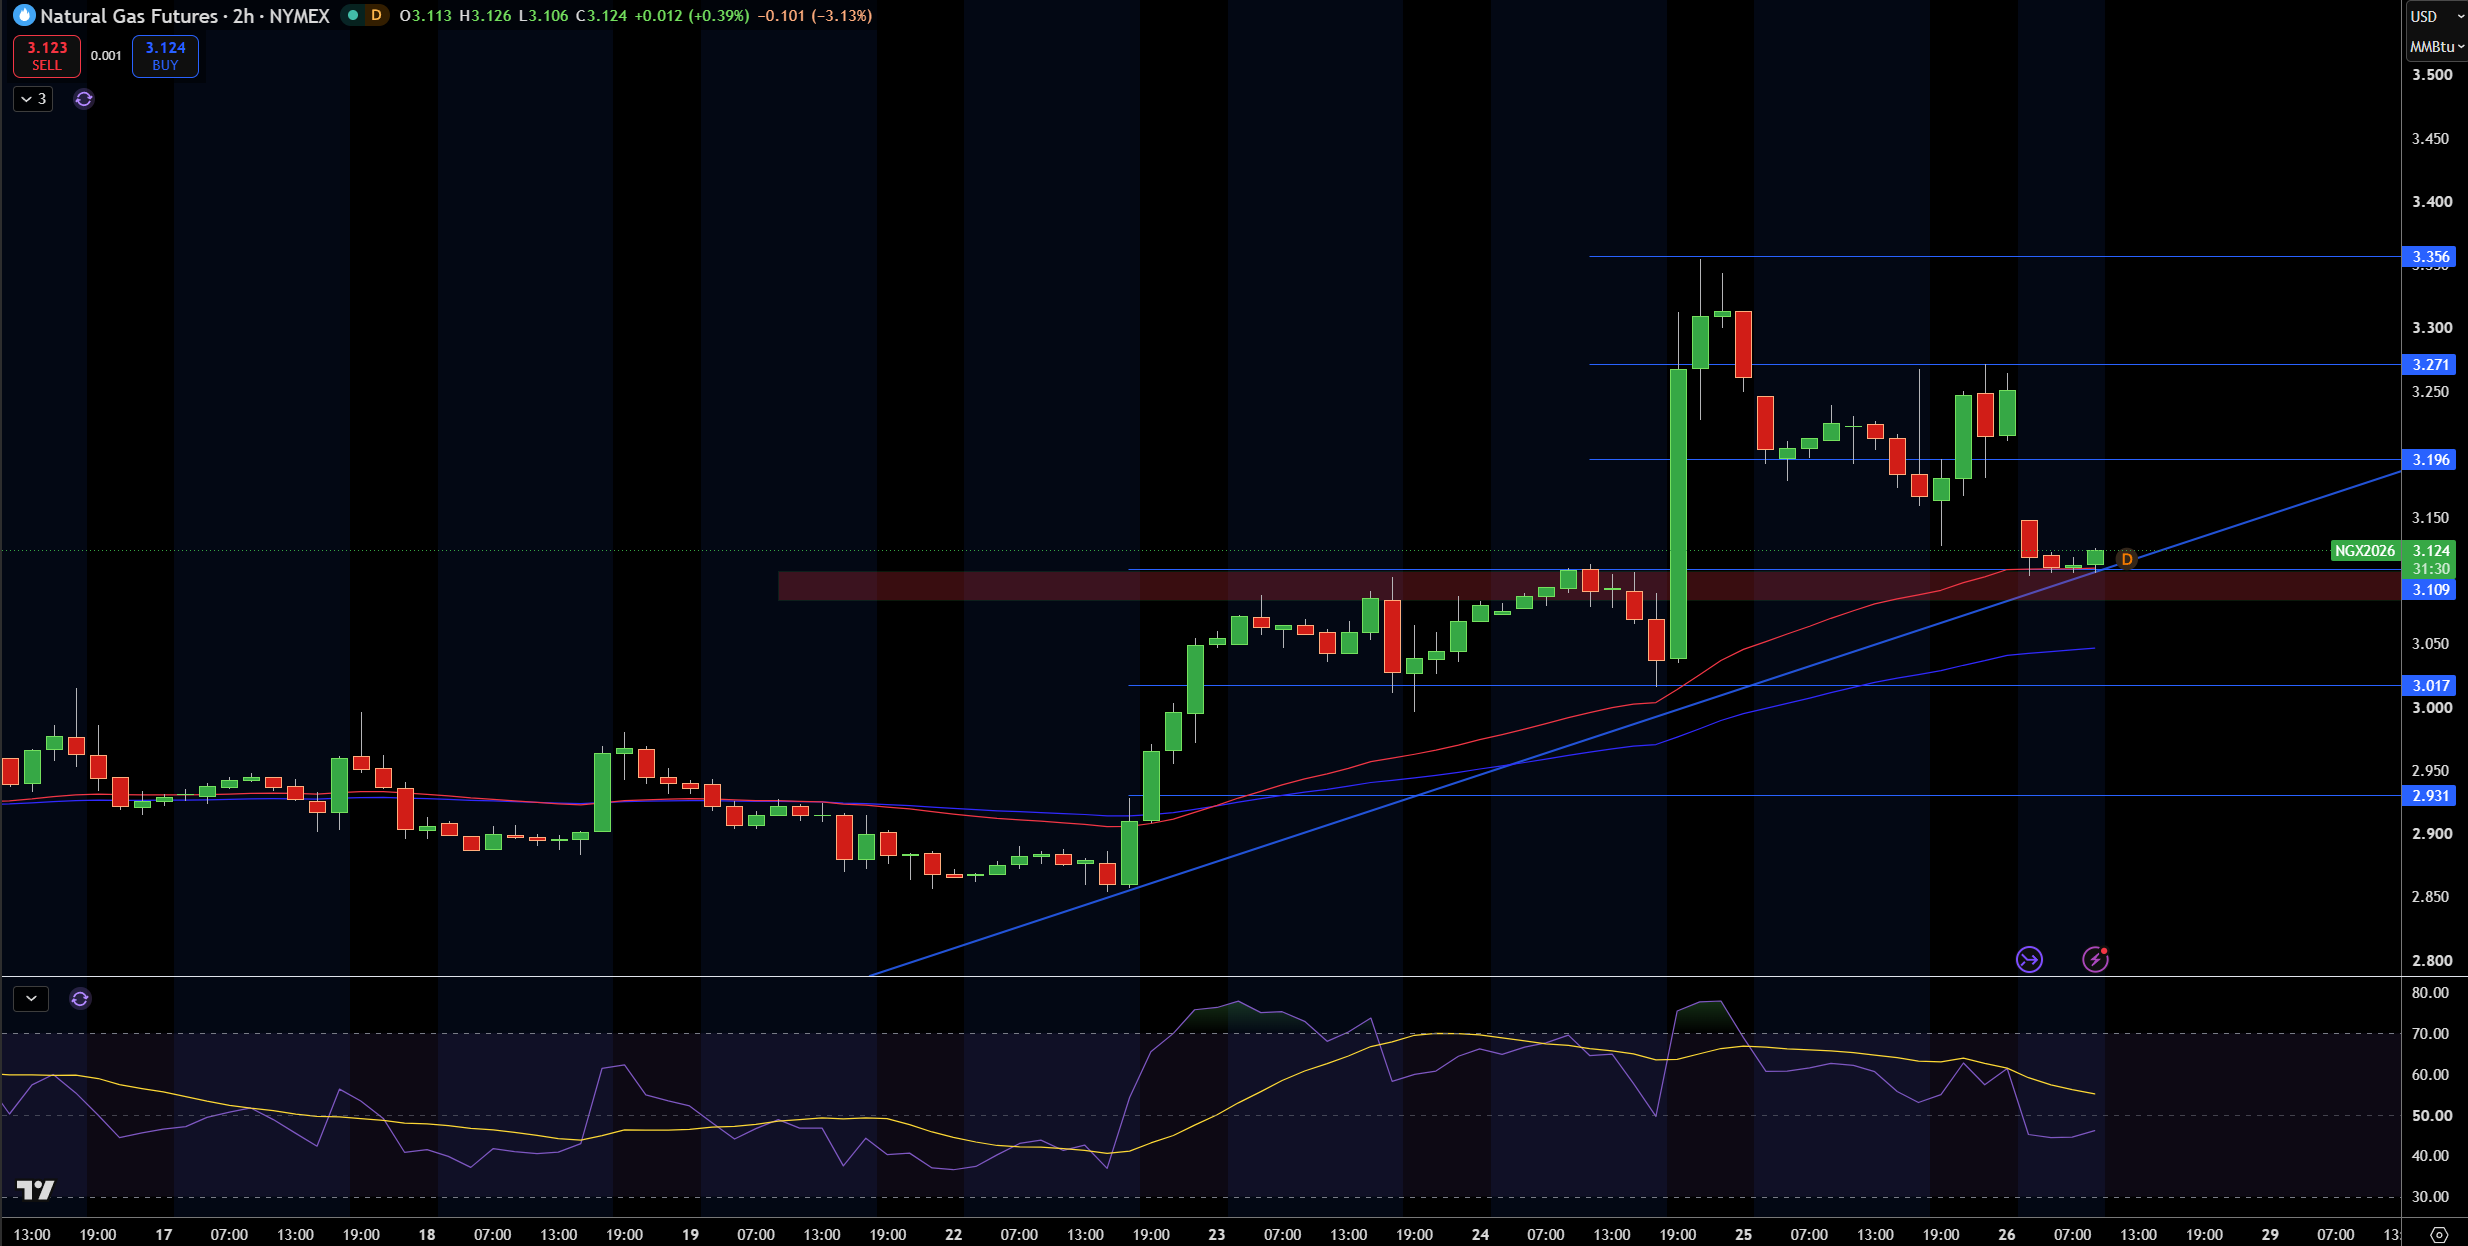
Natural gas is currently trading at $3.12. It recently fell from the resistance zone between $3.27 and $3.36. I see that price is still trading above the rising trendline and the support zone at $3.11. Additionally, it is still trading above the longer moving average. As a result, I see that the outlook remains positive.
Initially, I expect resistance to be found at $3.20. If this level is broken, I expect the next levels of resistance to be at $3.27 and $3.36. If price moves lower, I expect it to find support at $3.11. If price moves lower than this level, I expect it to find support at $3.02 and $2.93.
The momentum of the bullish trend has possibly shifted to neutral after RSI moved to oversold territory. However, as long as price is above the trendline and $3.11, I expect price to move higher. If price moves lower and breaks the trendline and $3.11, I expect it to move lower to $3.02. If $3.02 is broken, I expect it to move to the resistance zone between $3.27 and $3.36. If price breaks this resistance, I expect it to move higher to $3.43.
Natural Gas Price Forecast
Every new Natural Gas analysis as it publishes, today's technical signal and key levels, live price — on one page.
See all Natural Gas forecastsWTI Crude Oil Technical Analysis: USOIL Holds $92.97 as Descending Trendline Keeps $95.60 in Focus
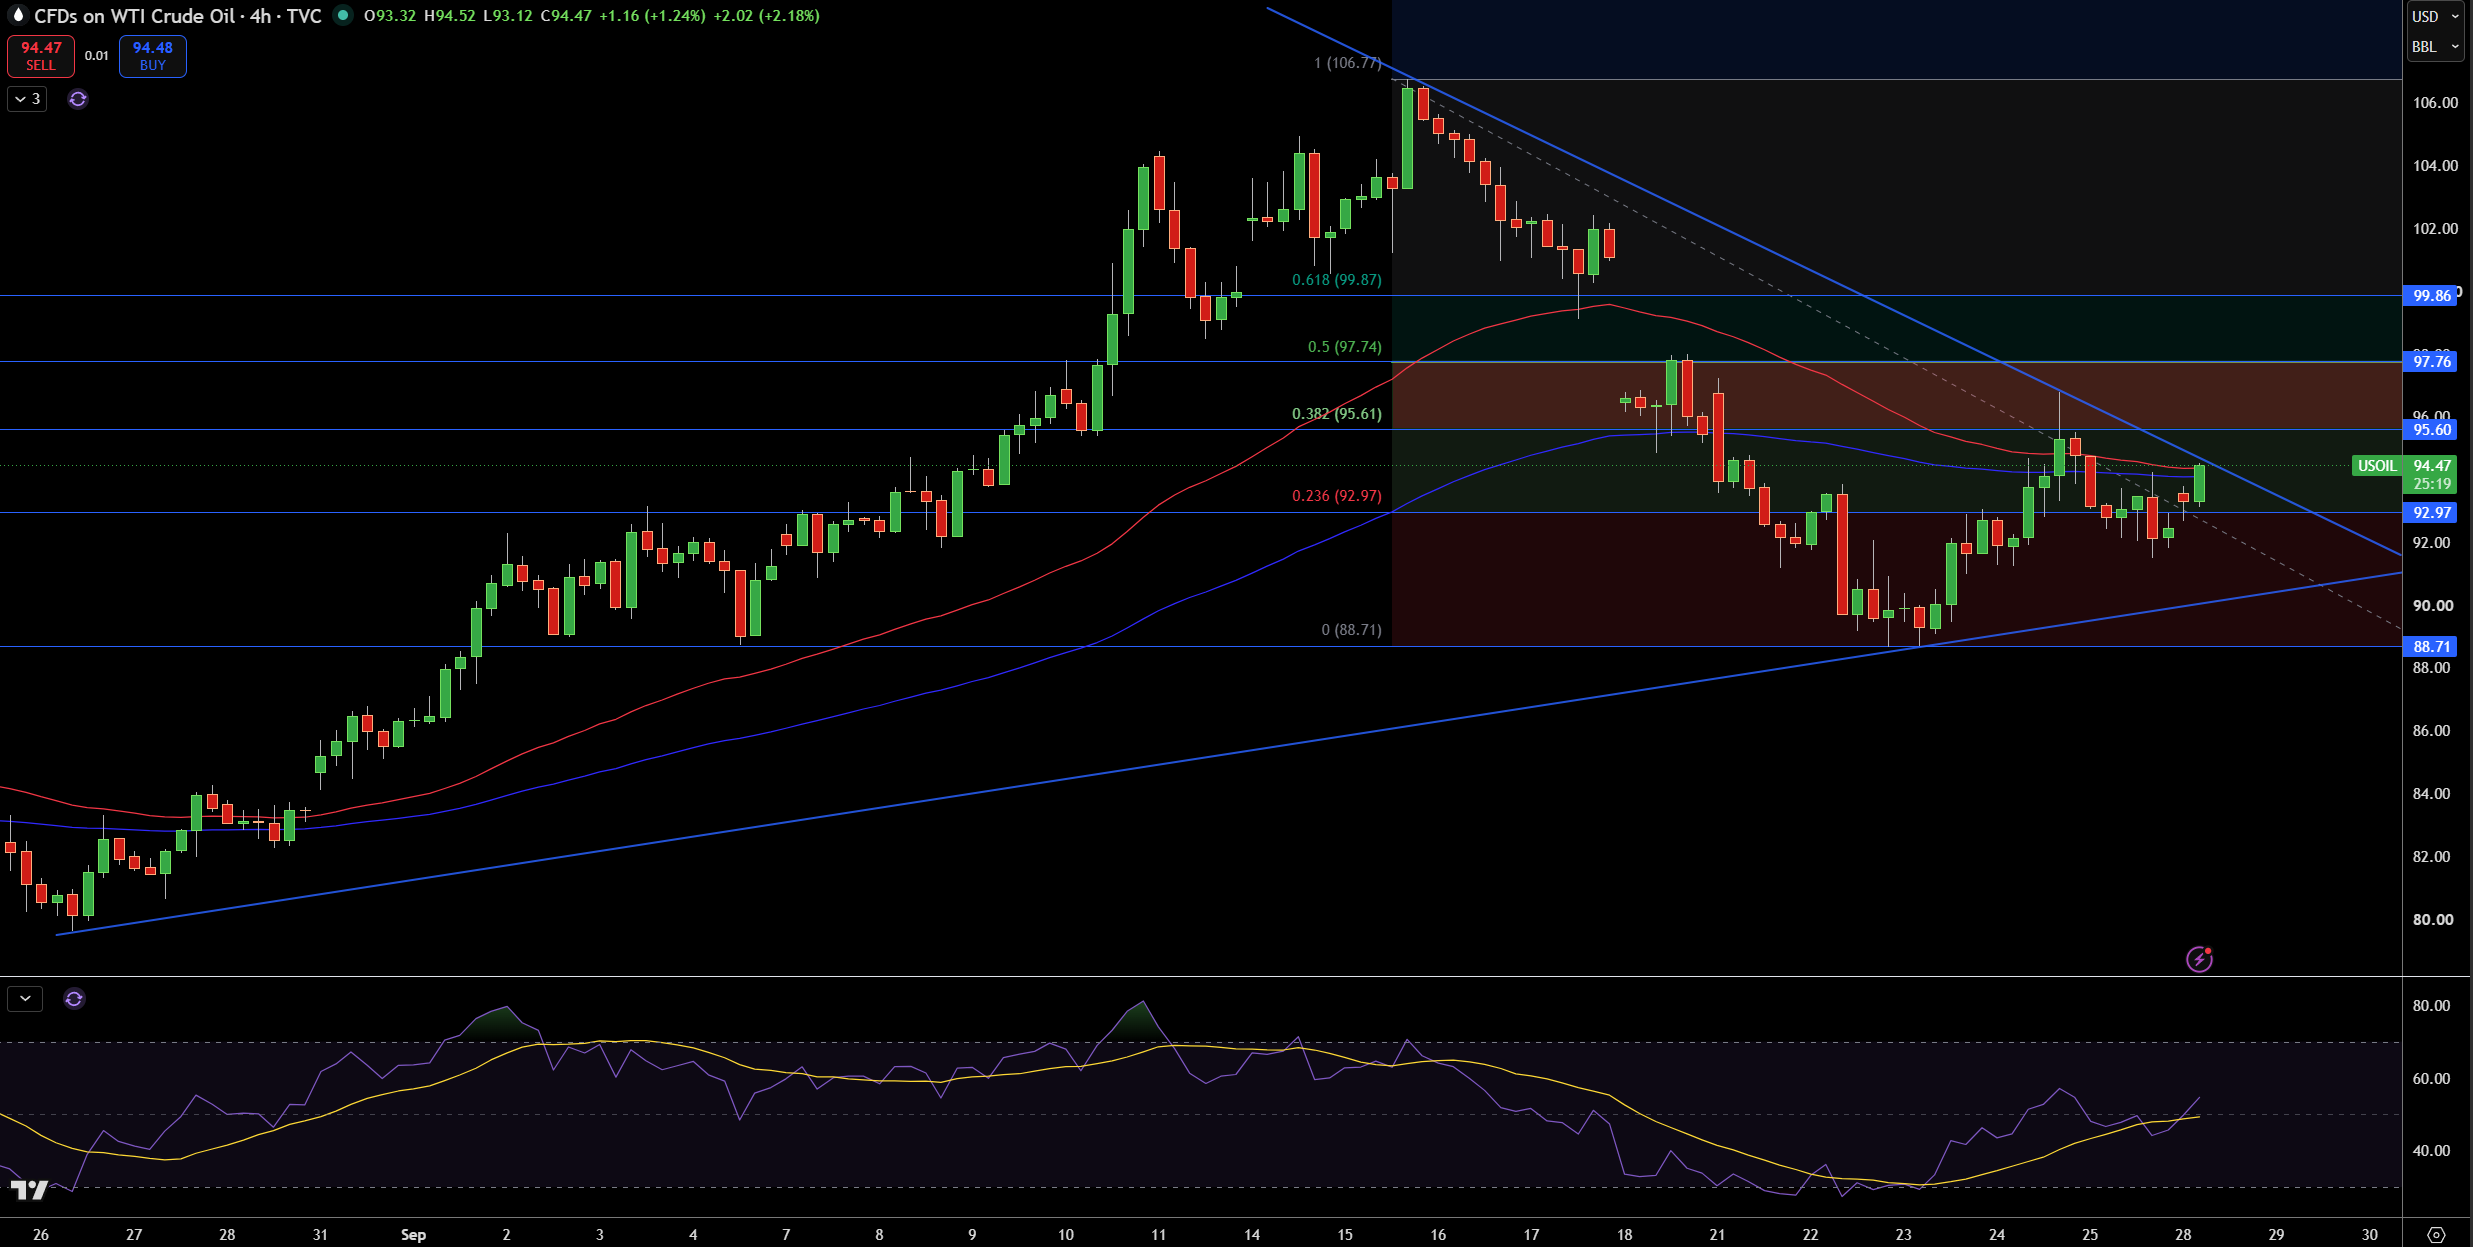
As of the 4 hour chart, WTI crude oil is trading at $94.47. After touching the support at $88.71, the price is looking better. However, the price is still unable to break the resistance of the moving averages and the trend line. Until the price of WTI crude breaks and closes above the moving averages and the trend line, I will consider the price action as a sideways movement.
There is resistance at $95.60. If the price breaks $95.60, then I will expect the price to rise to the next resistance at $97.76, and then to $99.86. Support is expected at $92.97. If the price breaks below $92.97, then I expect the price to fall to $88.71.
The moving averages are in a downtrend. The Relative Strength Index (RSI) is trending up. I am expecting the price of WTI crude oil to continue going up as long as it is above $92.97. A break above $95.60 will be bullish. If the price breaks below $92.97, I will expect the price to fall to $88.71.
Brent Crude Oil Technical Analysis: UKOIL Holds $97.24 Support as $100.23 Becomes the First Recovery Test
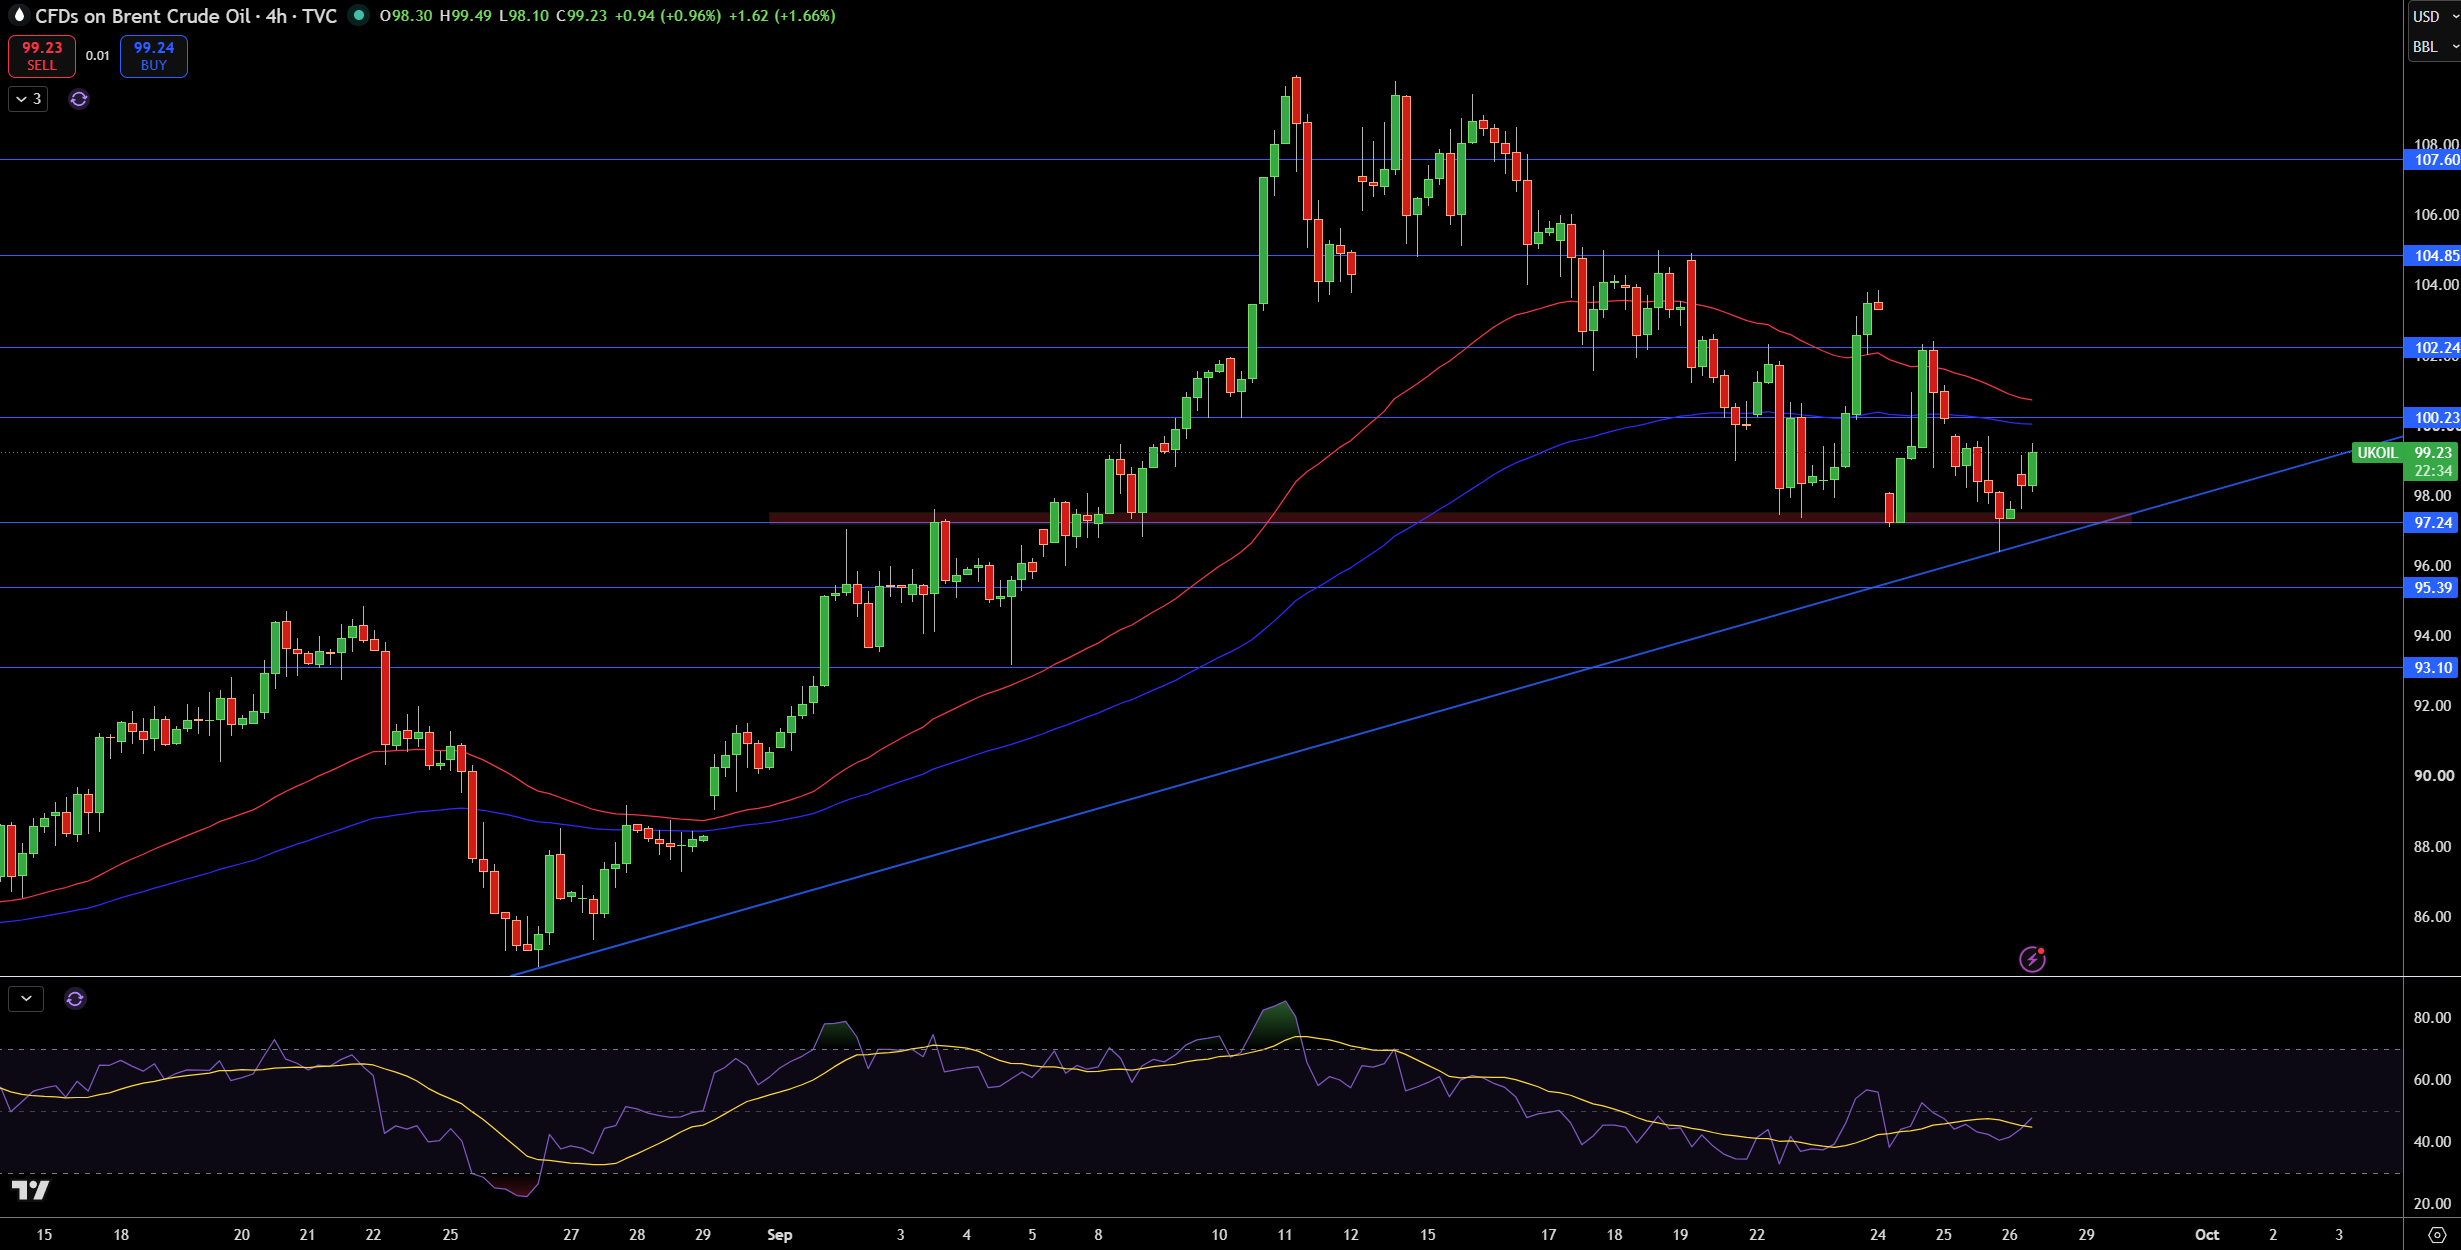
Current price action has Brent trading at $99.23. Price ran-up and tested the resistance zone at $97.24 and was supported by the rising trendline. Recently, price has been trading beneath both the 50 and 200 SMA. This price action combined with a lower high formation gives an unsettled formation between a potential top and a developing uptrend.
The initial bearish objective is to break below $97.24. If broken, expect a larger move lower to find support between $95.39 and $93.10. The rising trendline continues to provide support. The 200 SMA provides the next overhead resistance at $100.23, with the next major resistive barrier found at $102.24 and $104.85 and $107.60.
Neutral bias is appropriate while the price of Brent is sandwiched between $97.24 and $100.23. A break above $100.23 would indicate a new uptrend with the next major target at $107.60. A clear break below $97.24 would indicate a deeper correction toward $95.39.