Gold & Silver Outlook: Oil Rebound Fuels Fed Hike Bets as Higher Yields Pressure Metals
Gold and silver are experiencing downward pressure due to renewed central bank policy concerns as rising oil prices currently causes a rise in inflation and anticipates that the Federal Reserve will increase the target federal funds rate.
Oil prices have been trending higher recently due to unsuccessful negotiations to reopen the Strait of Hormuz. The increased oil prices further complicate efforts to alleviate U.S. inflationary pressure. As of writing, a 65% probability is placed on a Federal Reserve rate increase in October.
Federal Reserve officials also took a hawkish tone this week. Inflation is expected to persist for a long period of time, causing the public to alter their expectations of what is considered normal inflation. The Federal Reserve will have to keep policies restrictive until inflation is reduced to the long-term target.
Other regional Fed Presidents have indicated similar views as well.
Currently, it appears that other central banks will also need to implement similar polictical changes.
What is working against gold? Higher rates, higher U.S. Treasury yields and the higher dollar. Gold lost value last week and is down for the fifth week of the last six week period with the recent move higher in U.S. interest rates and the dollar taking a toll on the yellow metal.
U.S./Iran tensions keep the geopolitical environment on edge. This leads to defensive demand for the metal but if tensions continue to increase and disrupt the flow of oil it can lead to higher inflation and an even more hawkish Federal Reserve.
Other things working against silver are the higher yields and higher dollar. Silver, like gold, is also feeling the pressure and selling off.
With central banks and other institutions continuing to diversify their holdings and add gold to their reserve holdings, the outlook on gold remains positive in the longer term.
Until the Fed closes the door on further rate hikes, the dollar and Treasury yields fall, and oil prices weaken, expect gold and silver to remain under selling pressure.

Gold Technical Analysis: XAU/USD Breaks $4,199 Support as $4,173 Becomes the Next Downside Test
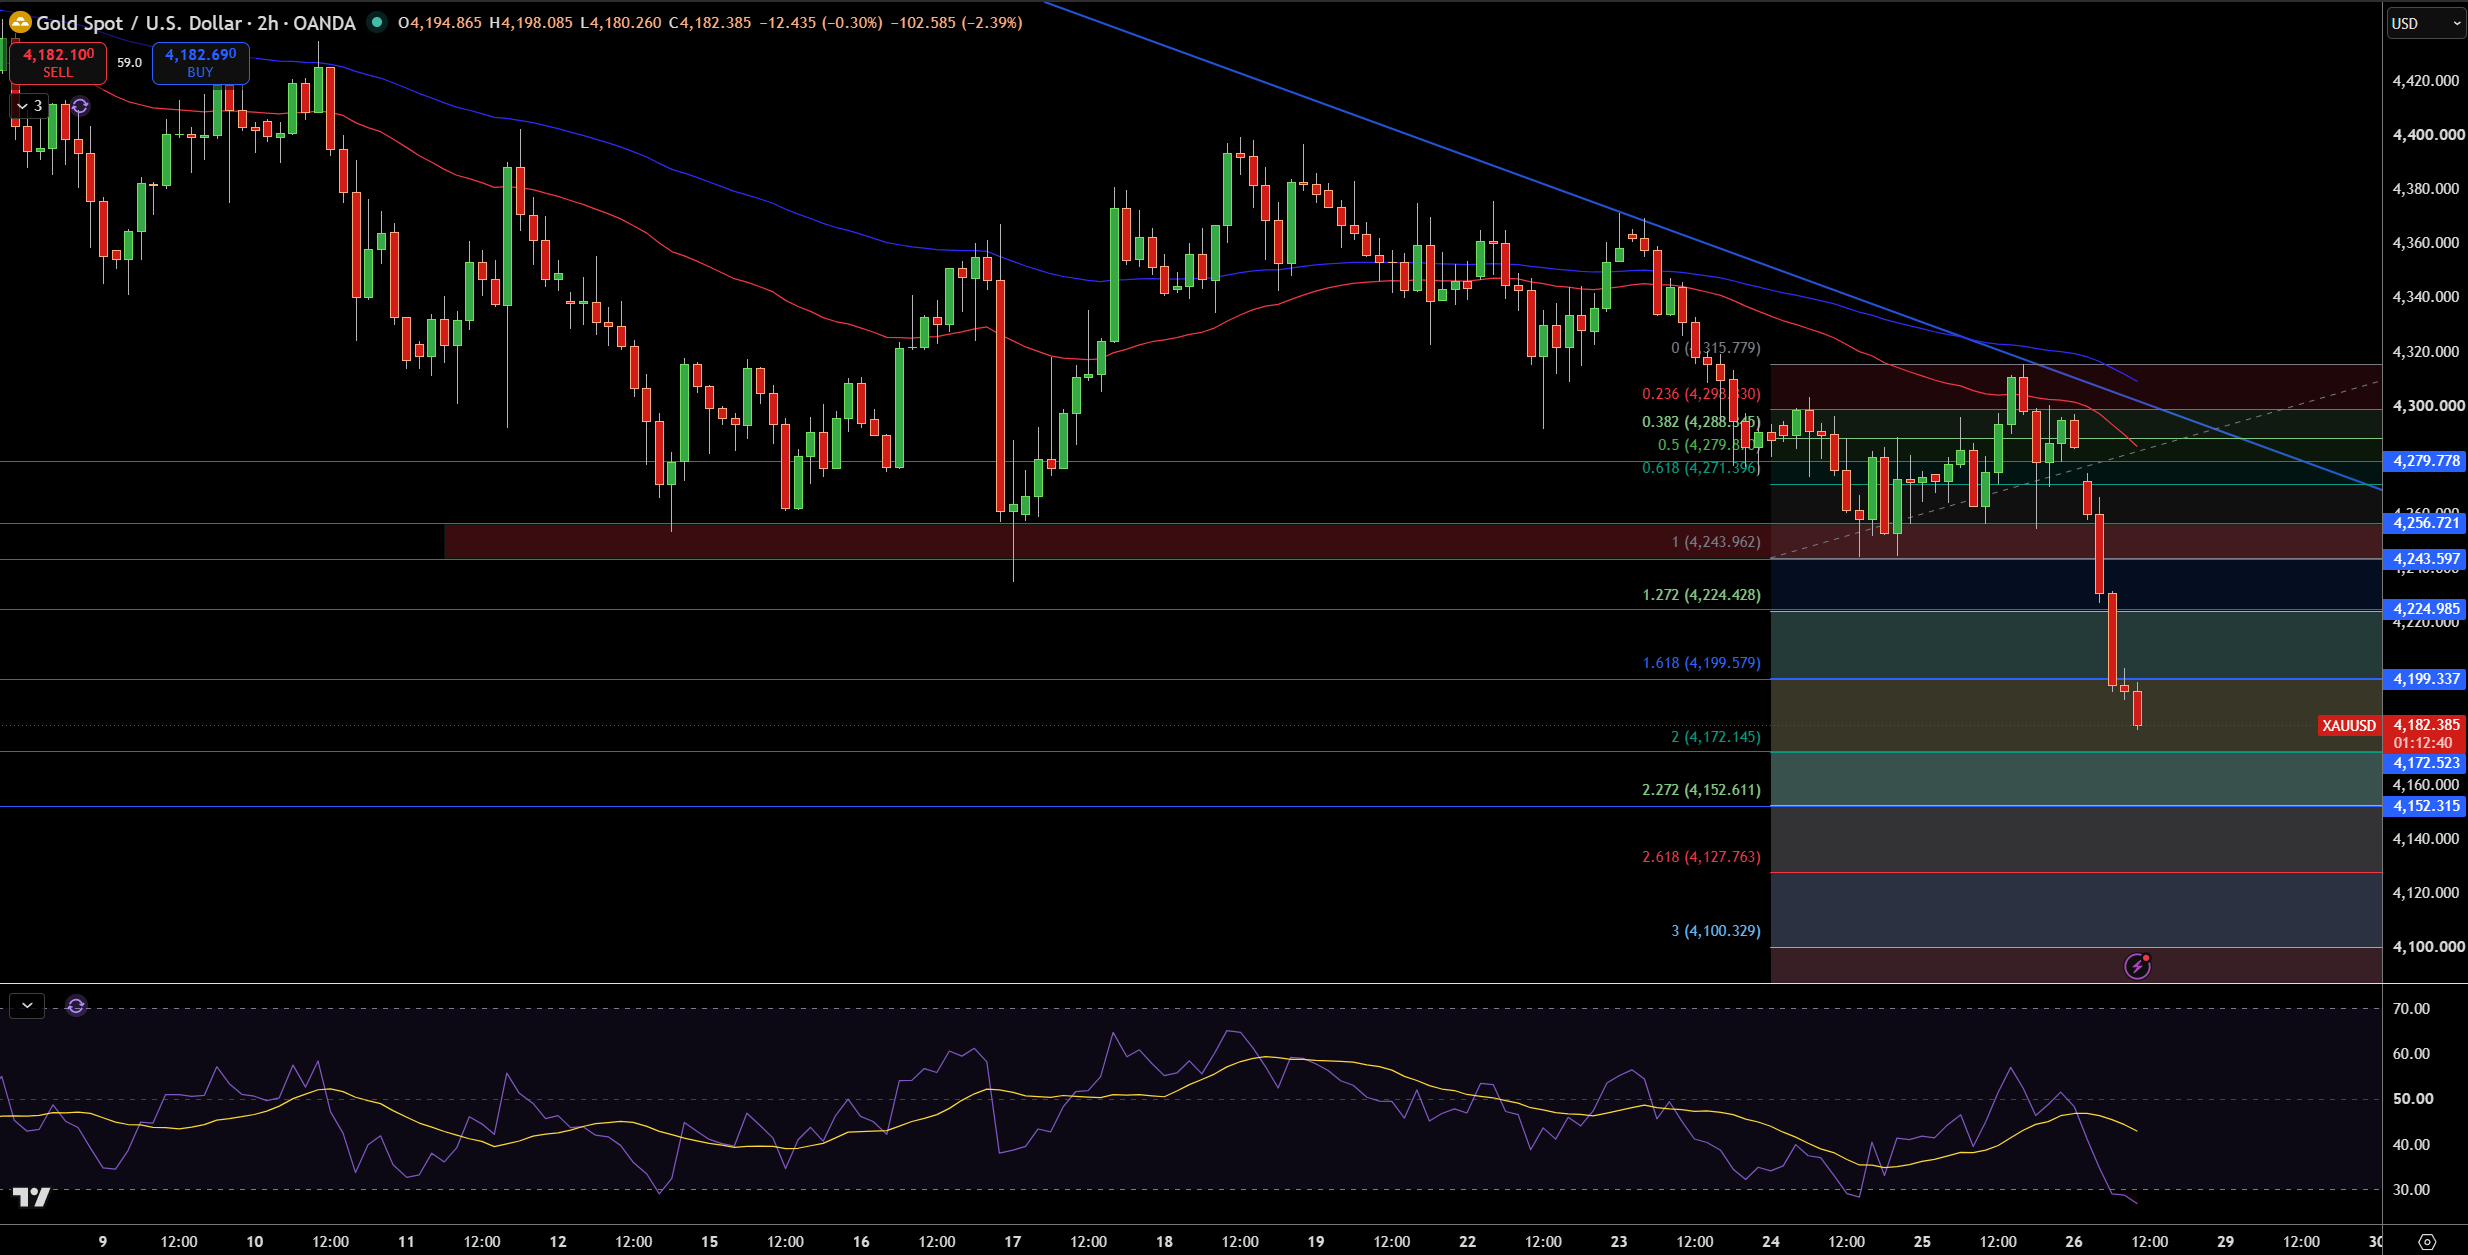
Gold is trading at about $4,182. I’m looking at the 2-hour chart and the drop below the support at $4,199 stands out. Prior to this, Gold had also broken down from the support range at $4,244 to $4,257. The more recent candles are below both the 20 and 50 moving averages, and also the downsloping trendline.
There is support at $4,173. Breaking below that would make the next support at $4,152 and then $4,128 and $4,100 coming into play. The resistance at $4,199 is the first of the range, with the next at $4,225, $4,244, and $4,257.
RSI is showing oversold conditions. This makes a bounce from current levels possible, but not reliable. I expect this bounce to be a small corrective move. A break below $4,173 would bring the next support at $4,152 into play. I would take a break above $4,244 to indicate a more bullish outlook on Gold.
Gold Price Forecast
Every new Gold analysis as it publishes, today's technical signal and key levels, live price — on one page.
See all Gold forecastsSilver Technical Analysis: XAG/USD Breaks $62.35 as $60.89 Becomes the Next Major Support
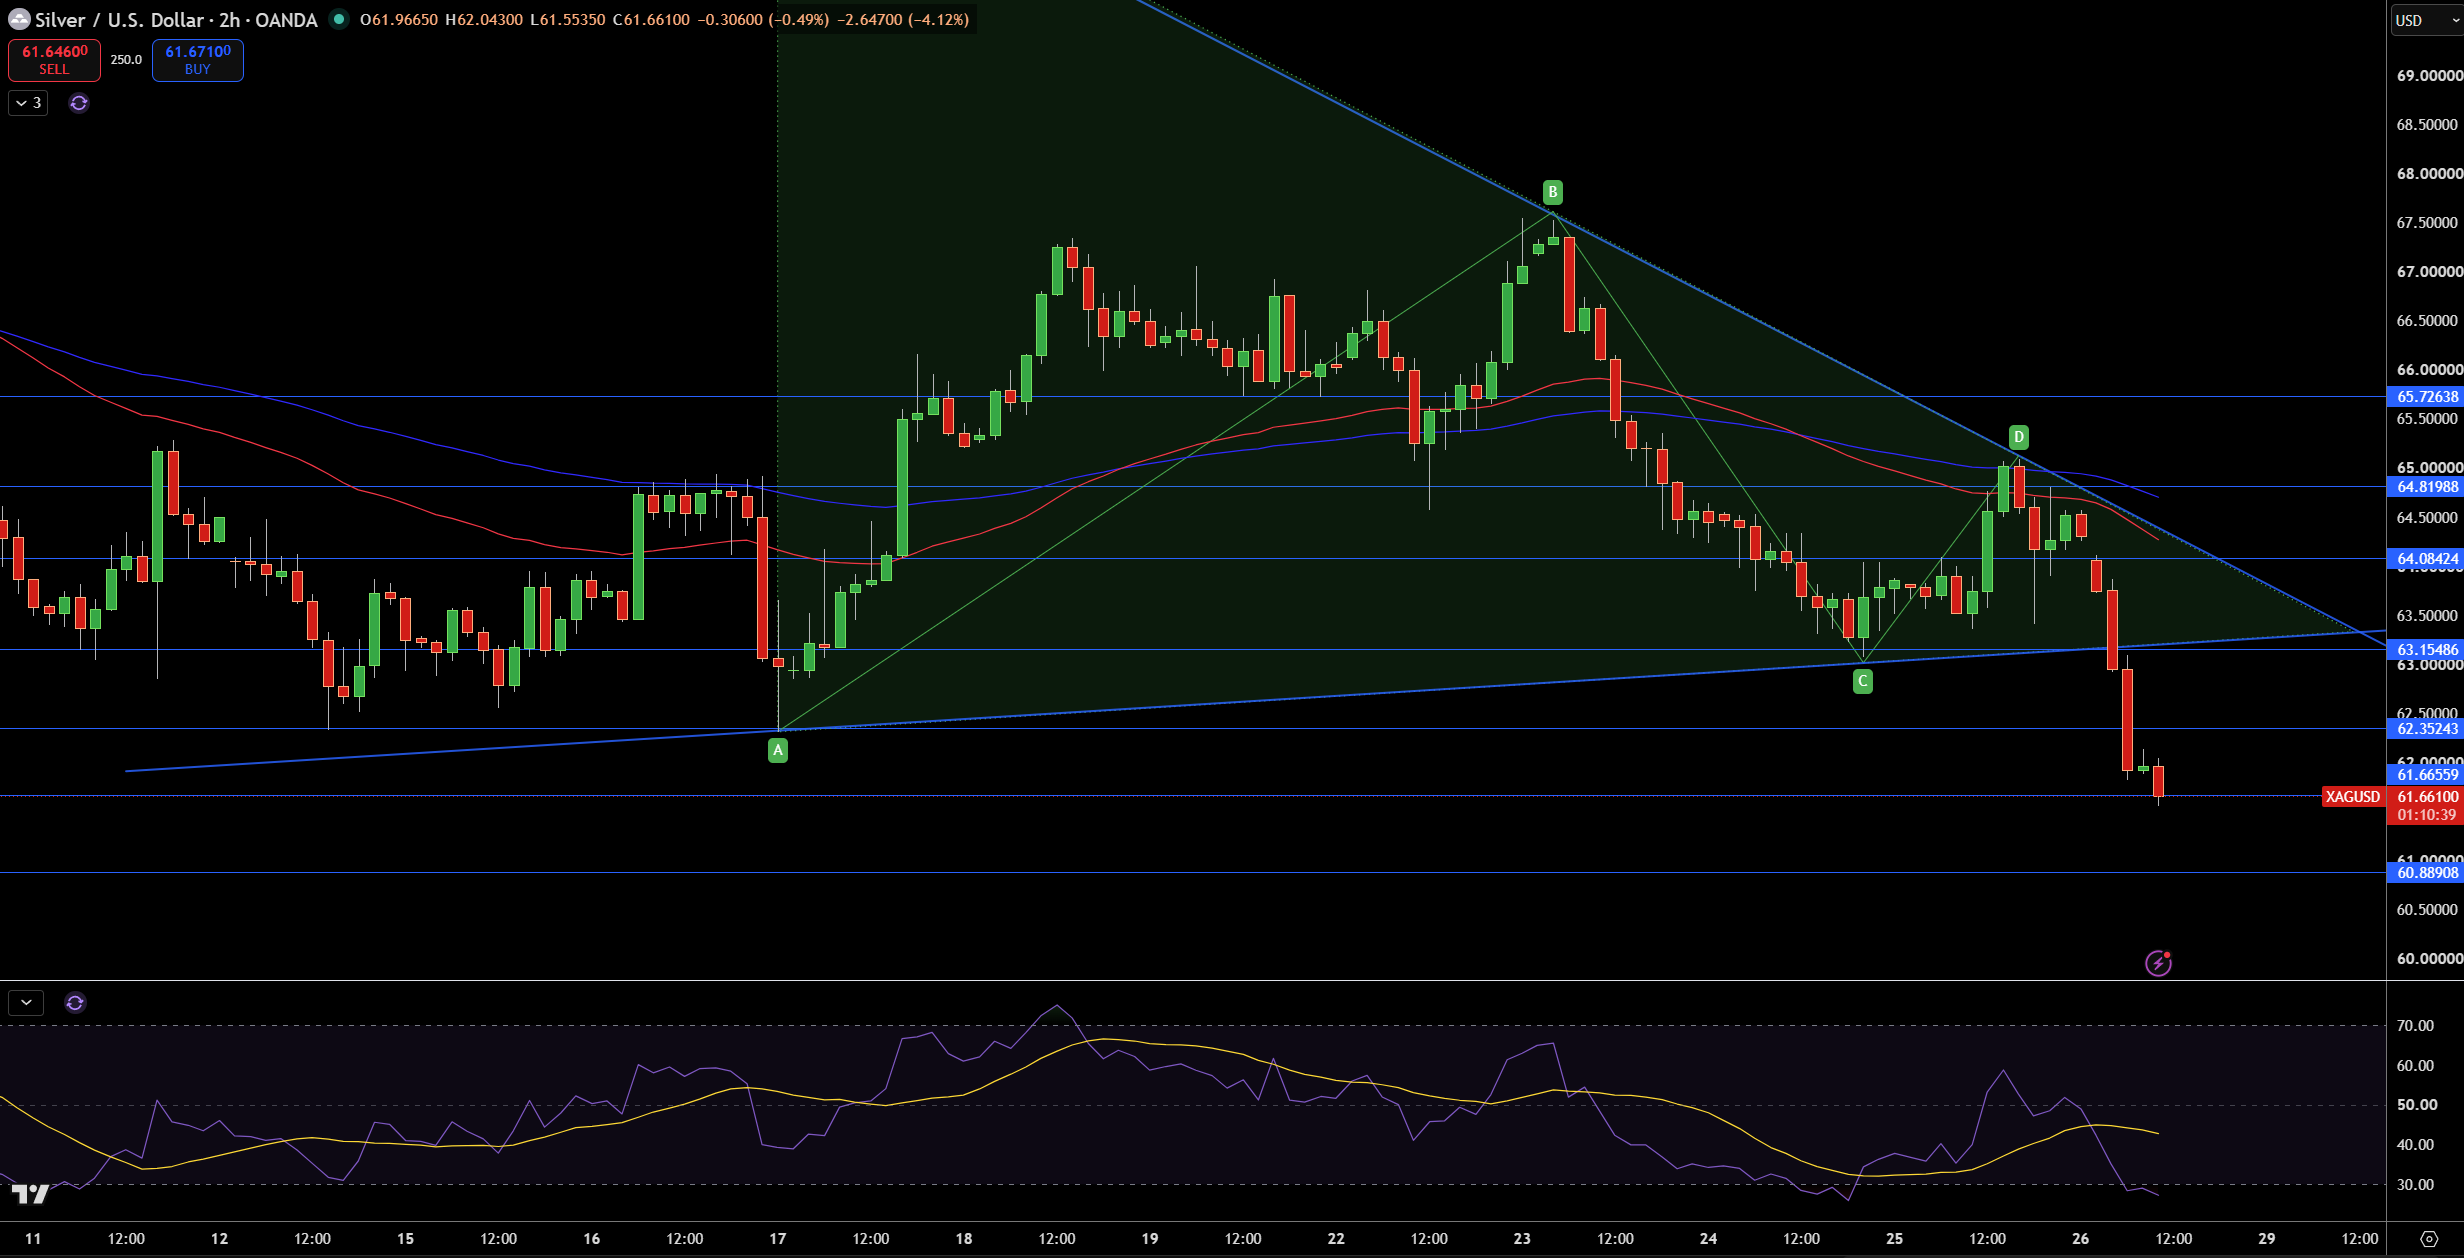
Silver is currently around $61.66 on the 2 hour chart after recently breaking down from the $62.35 support area and trendline. The recent move lower has also broken the previous support area and consolidation, and is now trading well below both the moving averages and the trendline.
The closest support to look for now is around $60.89. A daily close below this area would likely lead to more downside and higher and possibly farther away support zones. There is a resistance area beginning at $62.35 and continuing to $63.15, $64.08 and $64.82.
RSI is now in oversold territory, but that does not change the trend, rather confirms the recent moves. So while looking for bounces in this area may be prudent, and worth setting limits to sell, I would still look for further downside potential. I will look for a move higher to give me a signal to cover my short position, and a move back above $63.15 would do that. On the other side of that, a close below the $60.89 support would confirm further downside potential and give a signal to add to my short position.