
Dollar Index Outlook: Iran Tensions Revive Fed Hike Bets as EUR and GBP Face Policy Pressure
The U.S. dollar opens the week with a strong base thanks to rising U.S.-Iran tensions and related inflation. Market participants expect the Fed to continue its rate hikes.
The Fed’s rate hike expectation has supported the U.S. dollar. Tensions between the U.S. and Iran have increased uncertainty in the region. Despite declining global oil prices, the lack of normal shipping through the Strait of Hormuz has increased concerns about global energy supply. If global energy prices continue to increase, it could further cement the Federal Reserve’s expectation for a continued tightening cycle.
Last week, the Fed’s rate hike expectation was reinforced after better than expected U.S. economic data showed further labor market strength. With the American workforce remaining at historically low levels, rate hikes are expected to continue until there is a material change in the U.S. inflation outlook. Similarly, other Fed officials have reiterated the need to control inflation.
The energy crisis creates difficult choices for central banks. For the ECB, the energy crisis pushes inflation up, but not enough to worry about prematurely tightening. Philip Lane was recently quoted saying that there is less of a need to aggressively hike rates, because the main drivers of inflation, wages and services, are not creating as much of a barrier as previously.
The BOE also has inflation that is too high and is expecting a prolonged energy shortage. The October policy meeting resulted in the bank rate being held at 3.75%, but the Bank of England left the door open to future rate hikes.
The Fed is still hiking rates, and the ECB and the BOE have both said they expect to hike rates in the future.
Fundamental bias: DXY moderately bullish, EUR neutral-to-bearish, GBP neutral-to-bearish.

U.S. Dollar Index Technical Analysis: DXY Holds 101.01 as 101.40 Remains the Next Upside Test
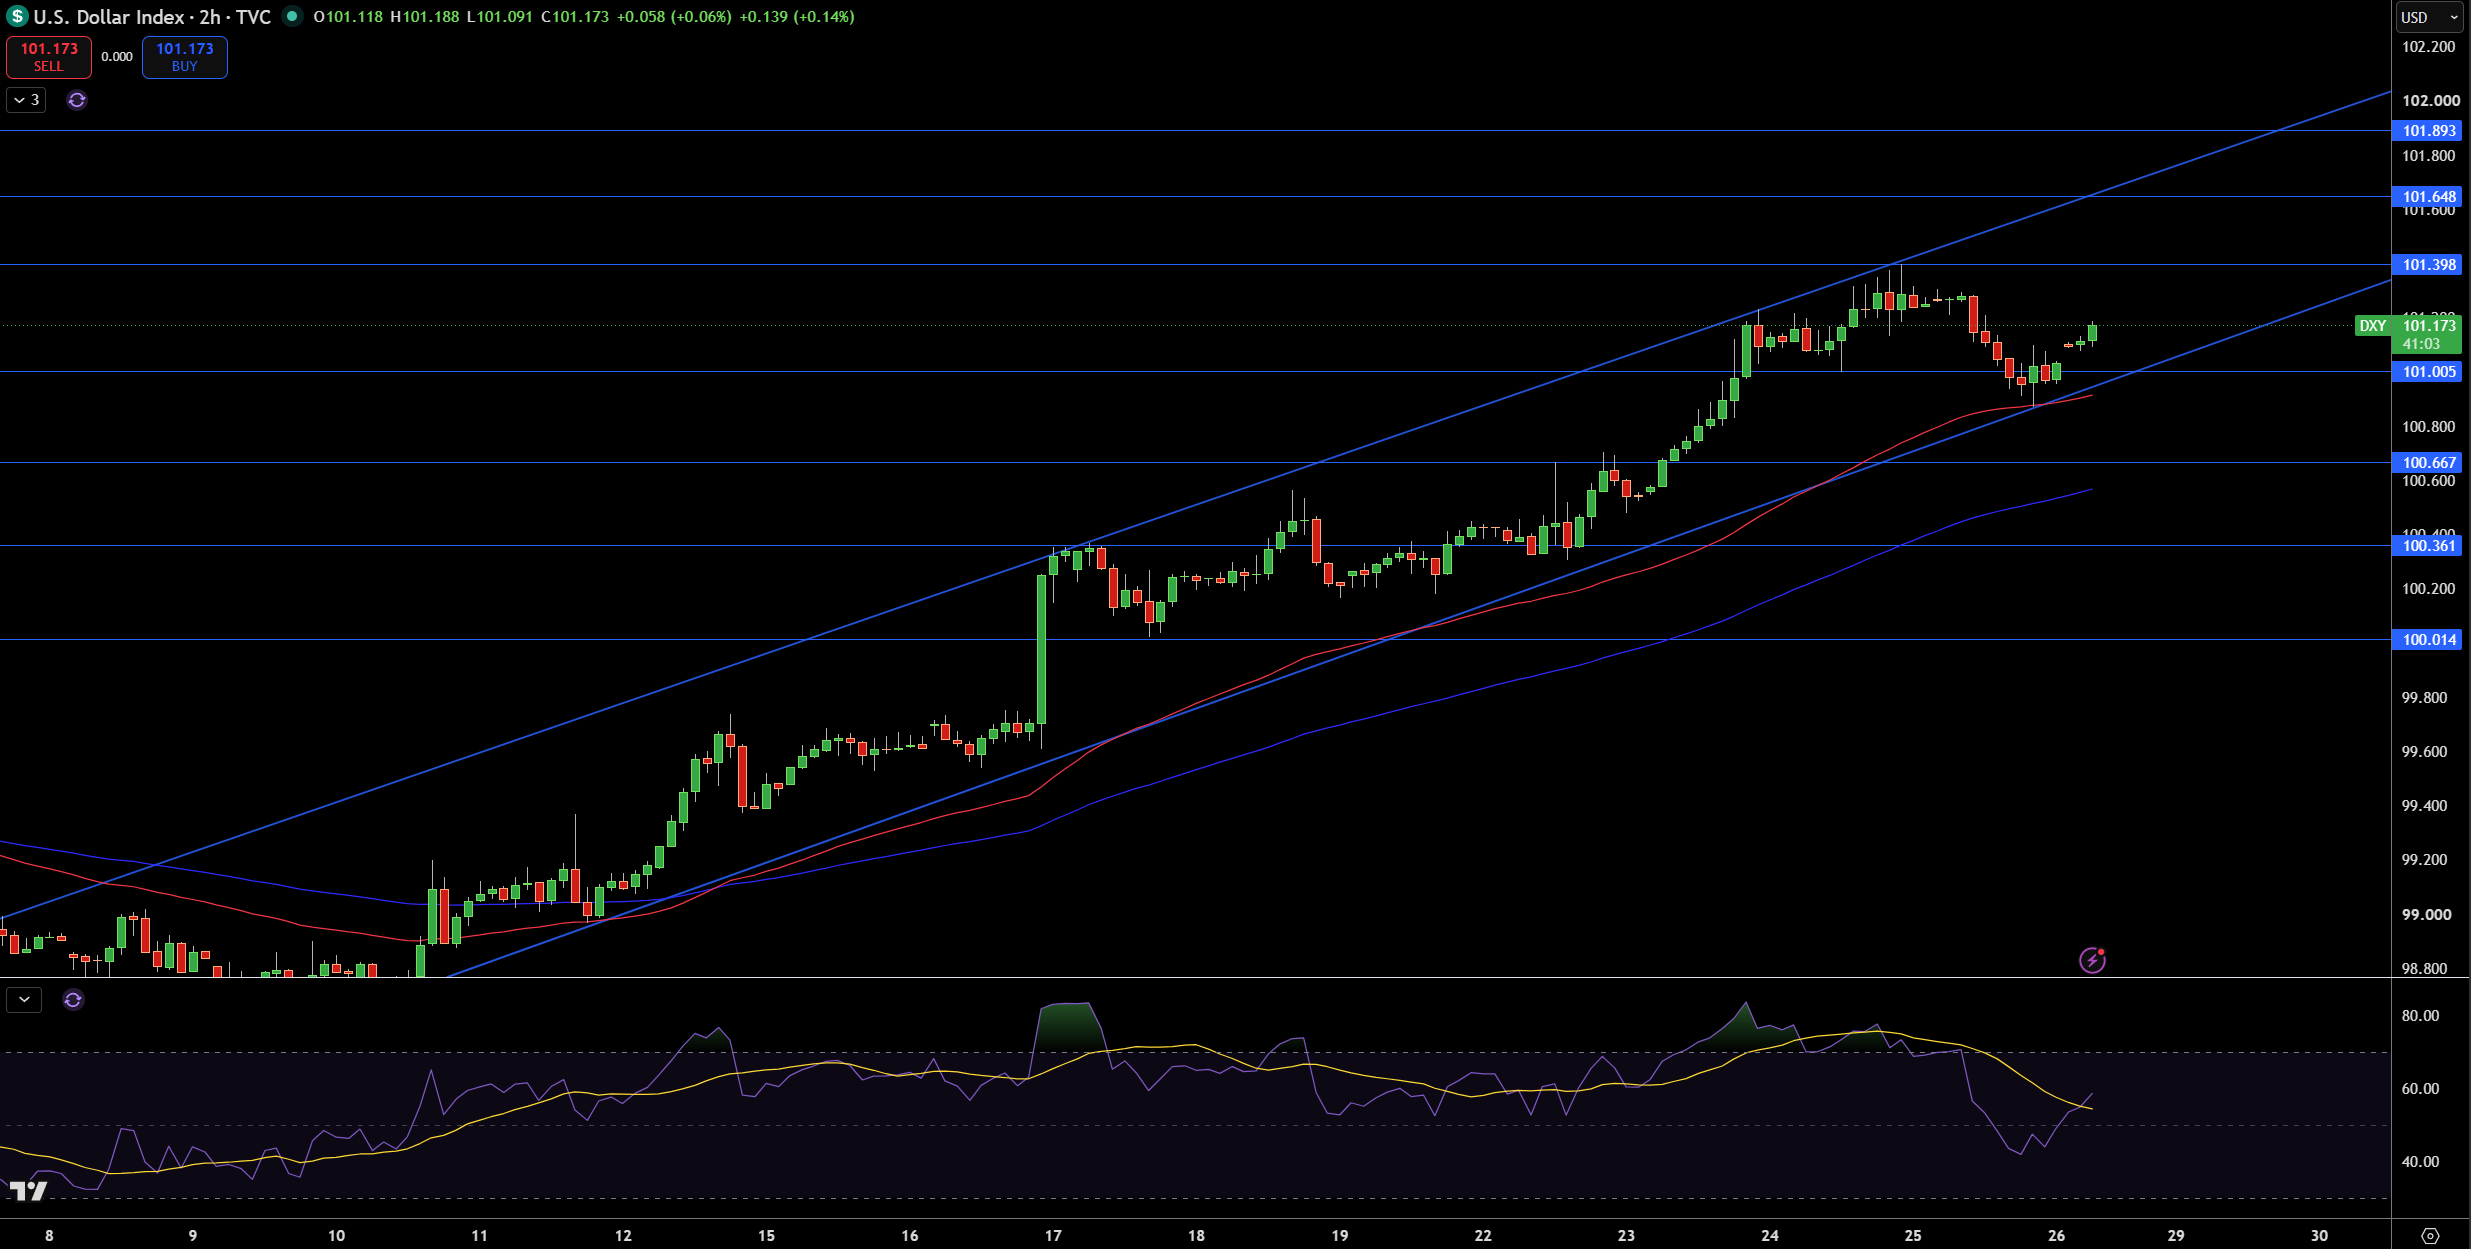
U.S. Dollar Index (DXY) has been trading around the 101.17 level and is currently in a rising channel. DXY is expected to test 101.40. Higher lows and higher highs are still in play. As long as the moving averages remain in this area, DXY should continue to be in a bullish trend.
Looking at the 2 hour chart, 101.40 is the first resistance level. If 101.40 is broken, then further resistance is expected at 101.65 and then 101.89. If the channel support is broken, then 101.01 is expected to provide support. Further support is expected at 100.67 and then 100.36 and 100.01.
Relative Strength Index (RSI) is expected to move higher. As long as RSI remains in the upper range, the bullish trend is expected to continue. If the rising channel support is broken and 100.67 is broken, then the bullish trend is expected to continue. If 101.40 is broken, then a move towards 101.65 and 101.89 is expected.
EUR/USD Price Forecast
Every new EUR/USD analysis as it publishes, today's technical signal and key levels, live price — on one page.
See all EUR/USD forecastsGBP/USD Technical Analysis: Sterling Holds 1.3205 as 1.3250 Becomes the First Recovery Hurdle
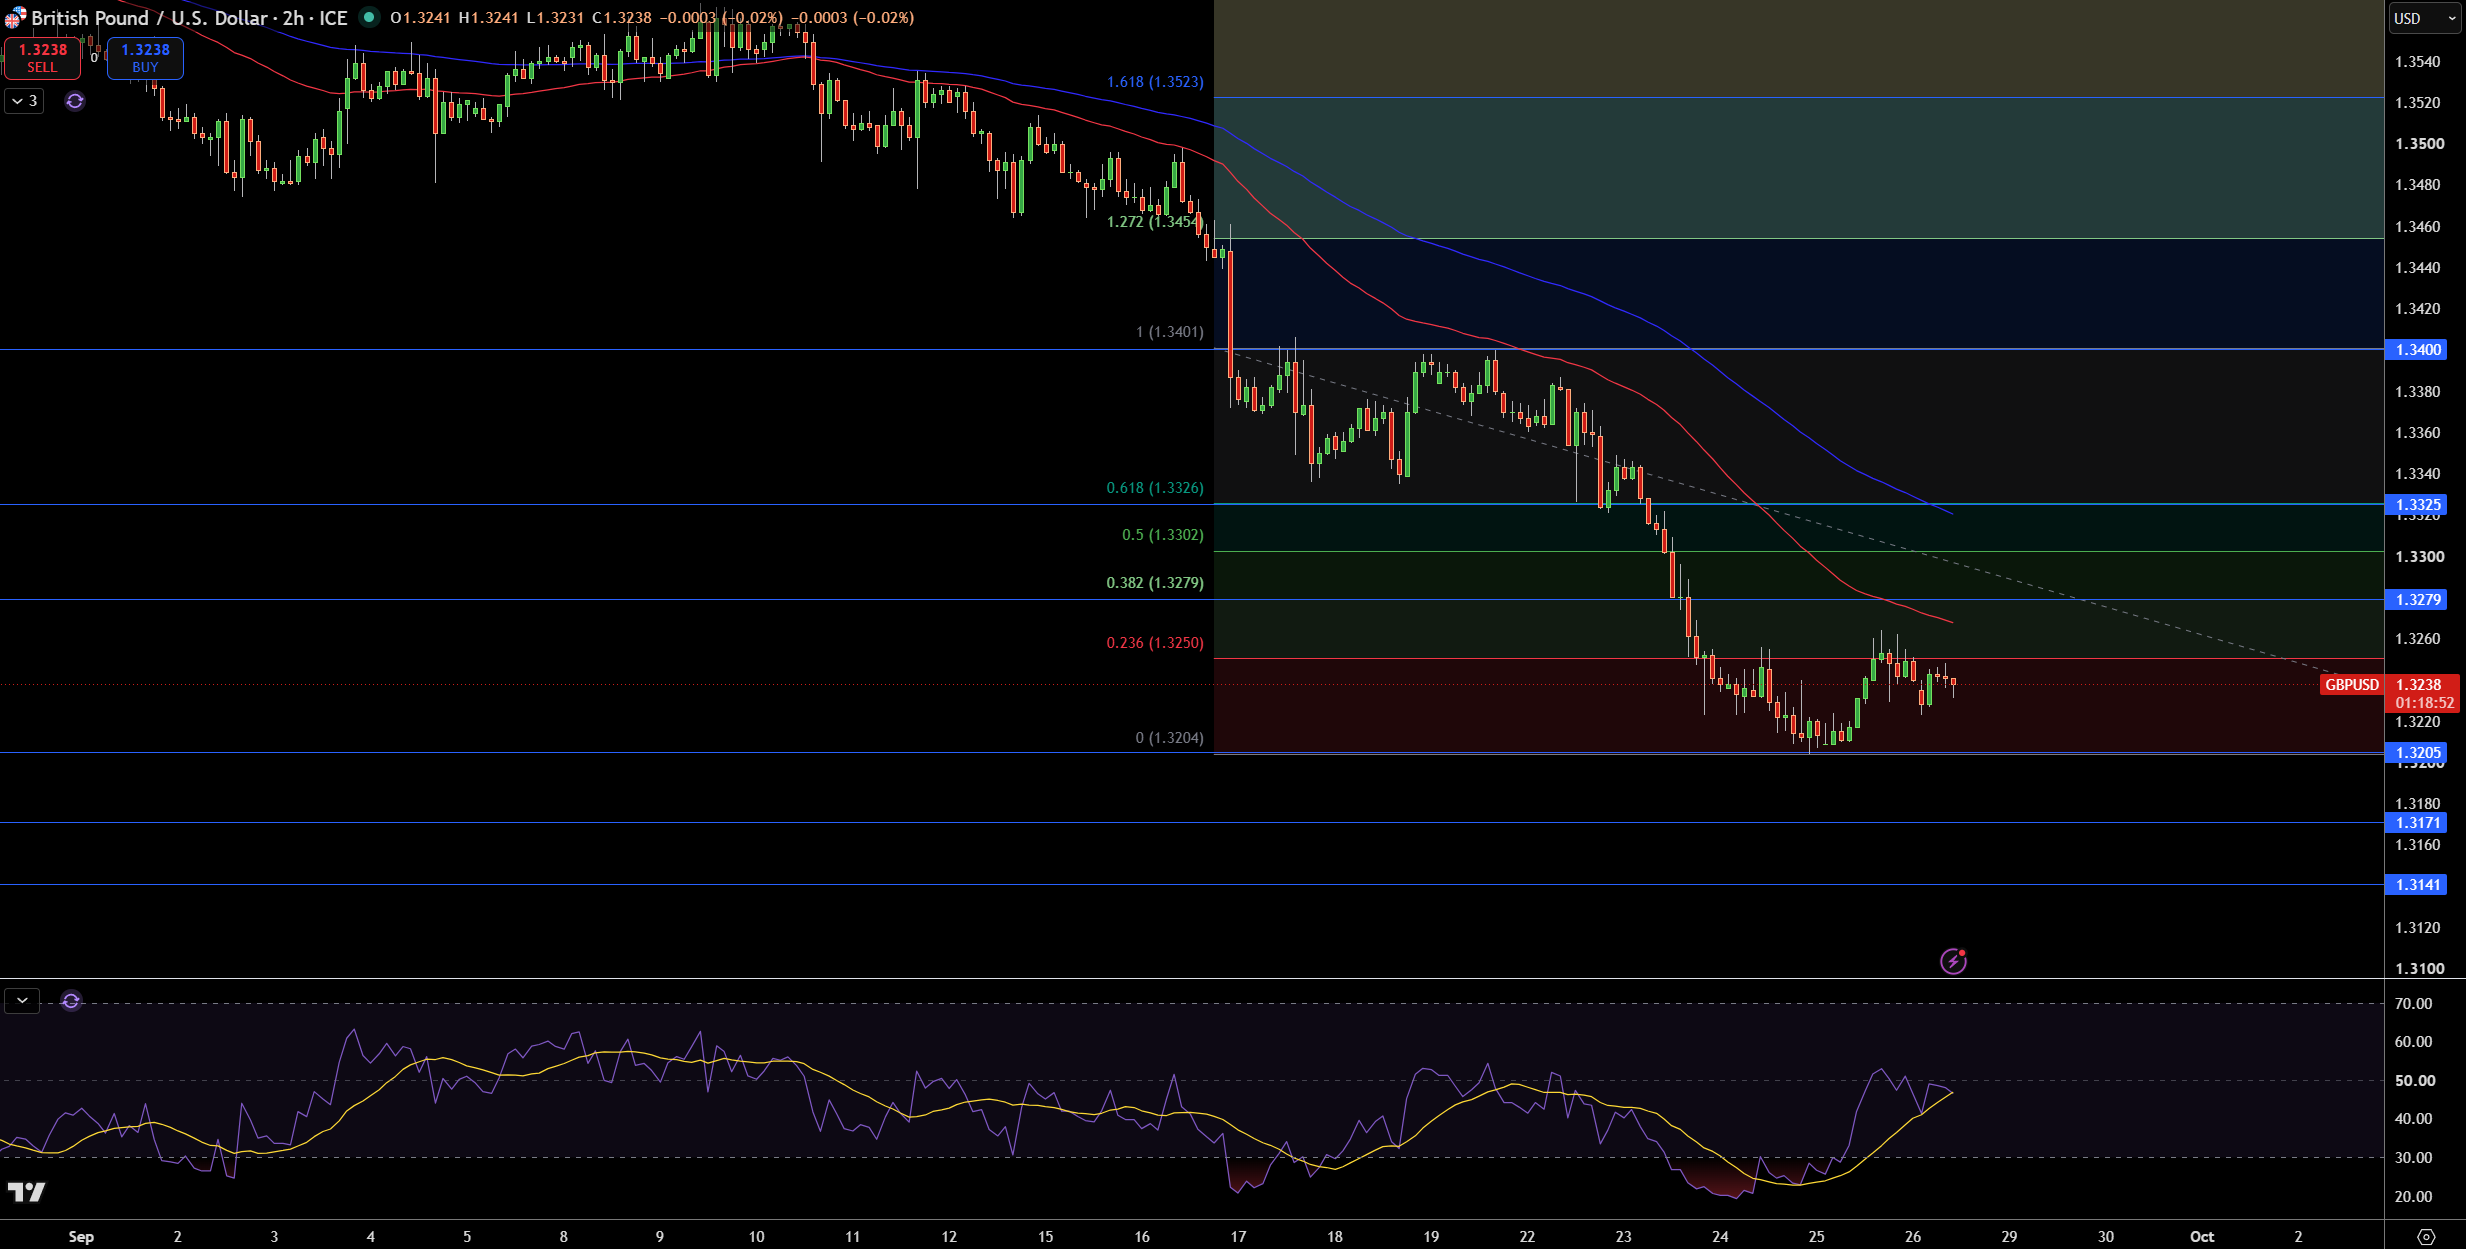
The pair is consolidating above the 1.3205 area on the 2 hour chart. 1.3238 is the recent high and 1.3205 is the low. 1.3238 is the 50 SMA and 1.3205 is the 100 SMA. The bears failed to break below the recent low and the trend remains bearish. A corrective rebound is likely in the near term.
1.3250 will be the first resistance level, and above that, resistance will be at 1.3279, 1.3302 and 1.3325. There is support at 1.3205 and lower at 1.3171 and 1.3141.
RSI is in the neutral zone and trend line support is also in the neutral zone. The trend remains bearish and will remain that way as long as the pair trades below 1.3250-1.3279. A move above 1.3302 would be bullish. A move below 1.3205 would bring the 1.3171-1.3141 area into support.
EUR/USD Technical Analysis: Euro Tests 1.1325 Support as Oversold Momentum Raises Bounce Risk
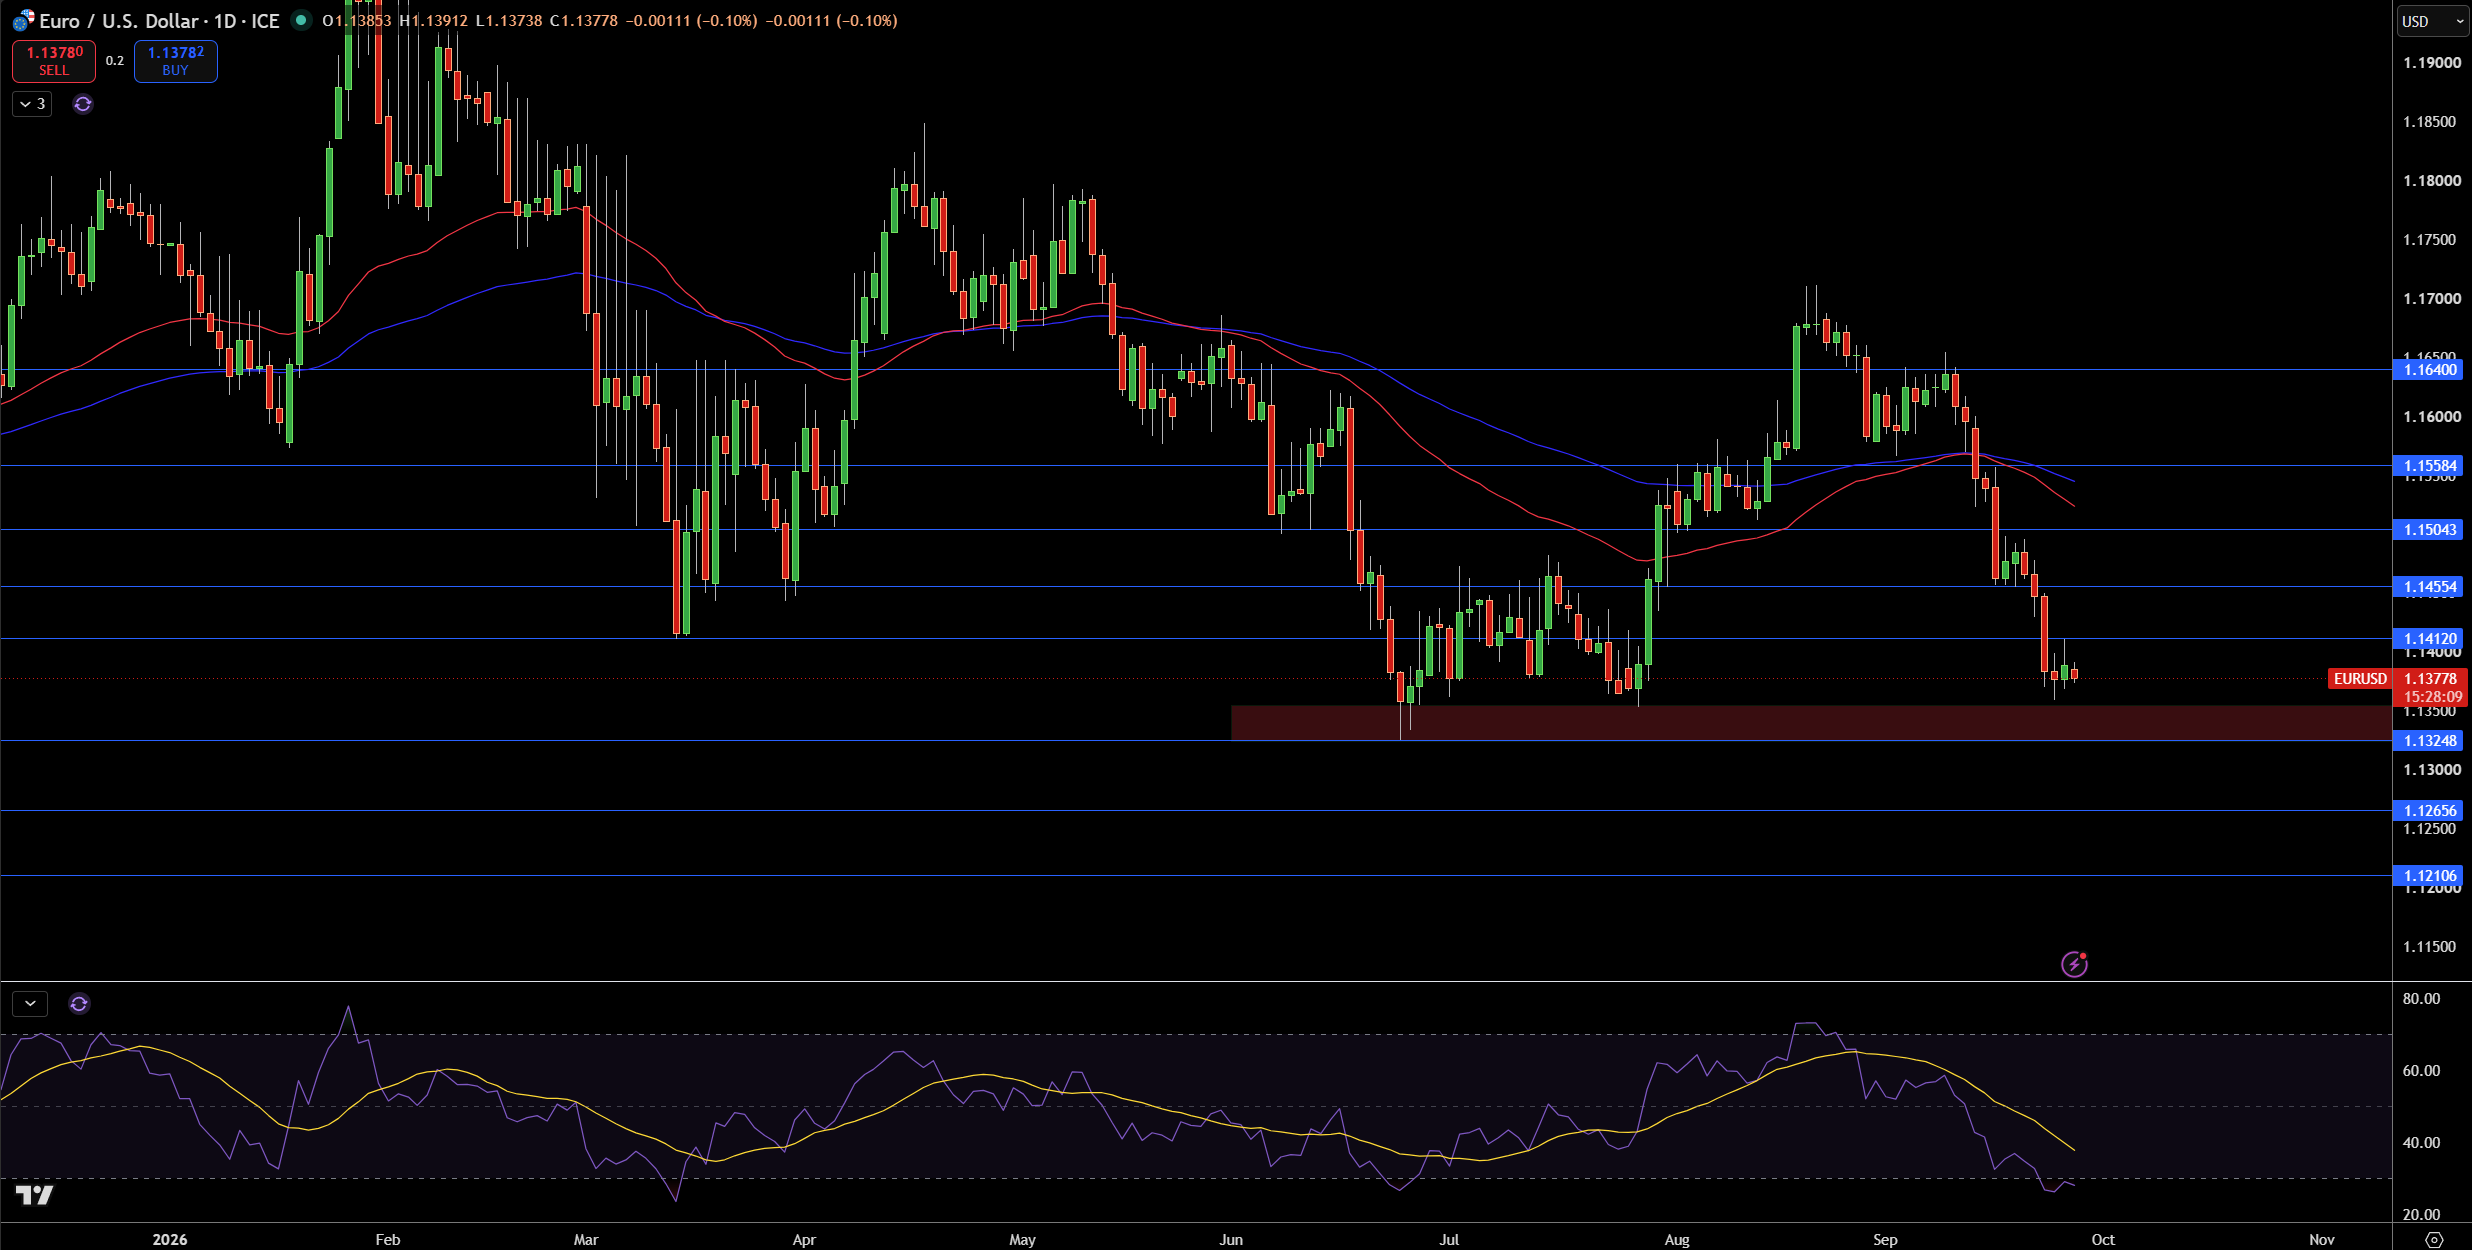
The Euro has trended lower and is currently trading at the 1.1325 support area. The daily chart shows the Euro has been trending lower and currently trades below both the 20 period and 100 period moving averages. Sellers continue to control the trend.
Trendlines tend to cap the downside and provide support to the Euro. There is support at 1.1325, with additional support at 1.1266, and 1.1211. The 1.1412 level is the first trendline resistance. Additional resistance is located at 1.1455, 1.1504, and 1.1558.
The RSI indicates the Euro is Oversold, and could be due for a bounce. However, given the Euro is trading below the 1.1412 and 1.1455 levels, additional trends may be in lower with potential support at 1.1266, and 1.1211. I would look for bounces to be sold, and a move above 1.1455 would give new trendline support and indicate higher levels may be in store for the Euro.