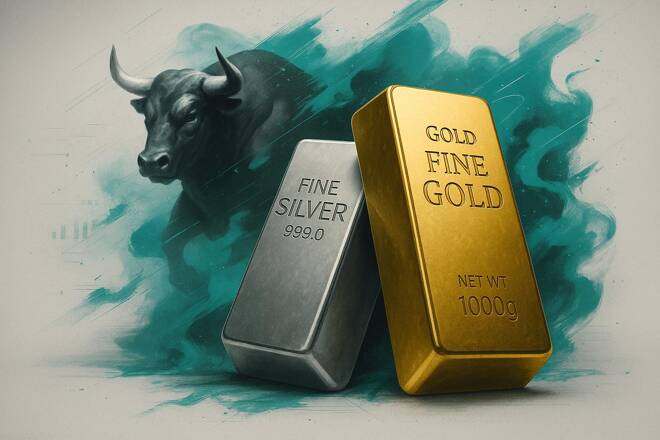
Gold (XAU) and silver (XAG) prices dropped further on Monday after a difficult week. Gold slipped toward $4,200 an ounce while silver dropped below $63. The stalled talks between the US and Iran have kept oil prices high and added to inflation worries. That has strengthened expectations of another rate hike by the Fed. The higher Treasury yields and a stronger US dollar continue to weigh on both metals, even as tensions in the Middle East persist.
The next test comes from US inflation data on Wednesday and the jobs report on Friday. The strong readings could further push the US Treasury yields higher and keep gold and silver prices under pressure. But softer data could give both metals room to recover from their key support zones. In my view, gold needs to hold above $4,200 and silver needs to hold $60 to avoid a deeper decline.
Gold Price Forecast: $4,200 Support Faces a Test After $4,300 Break
Gold Daily and Weekly Charts: Breakdown Raises $4,000 Risk
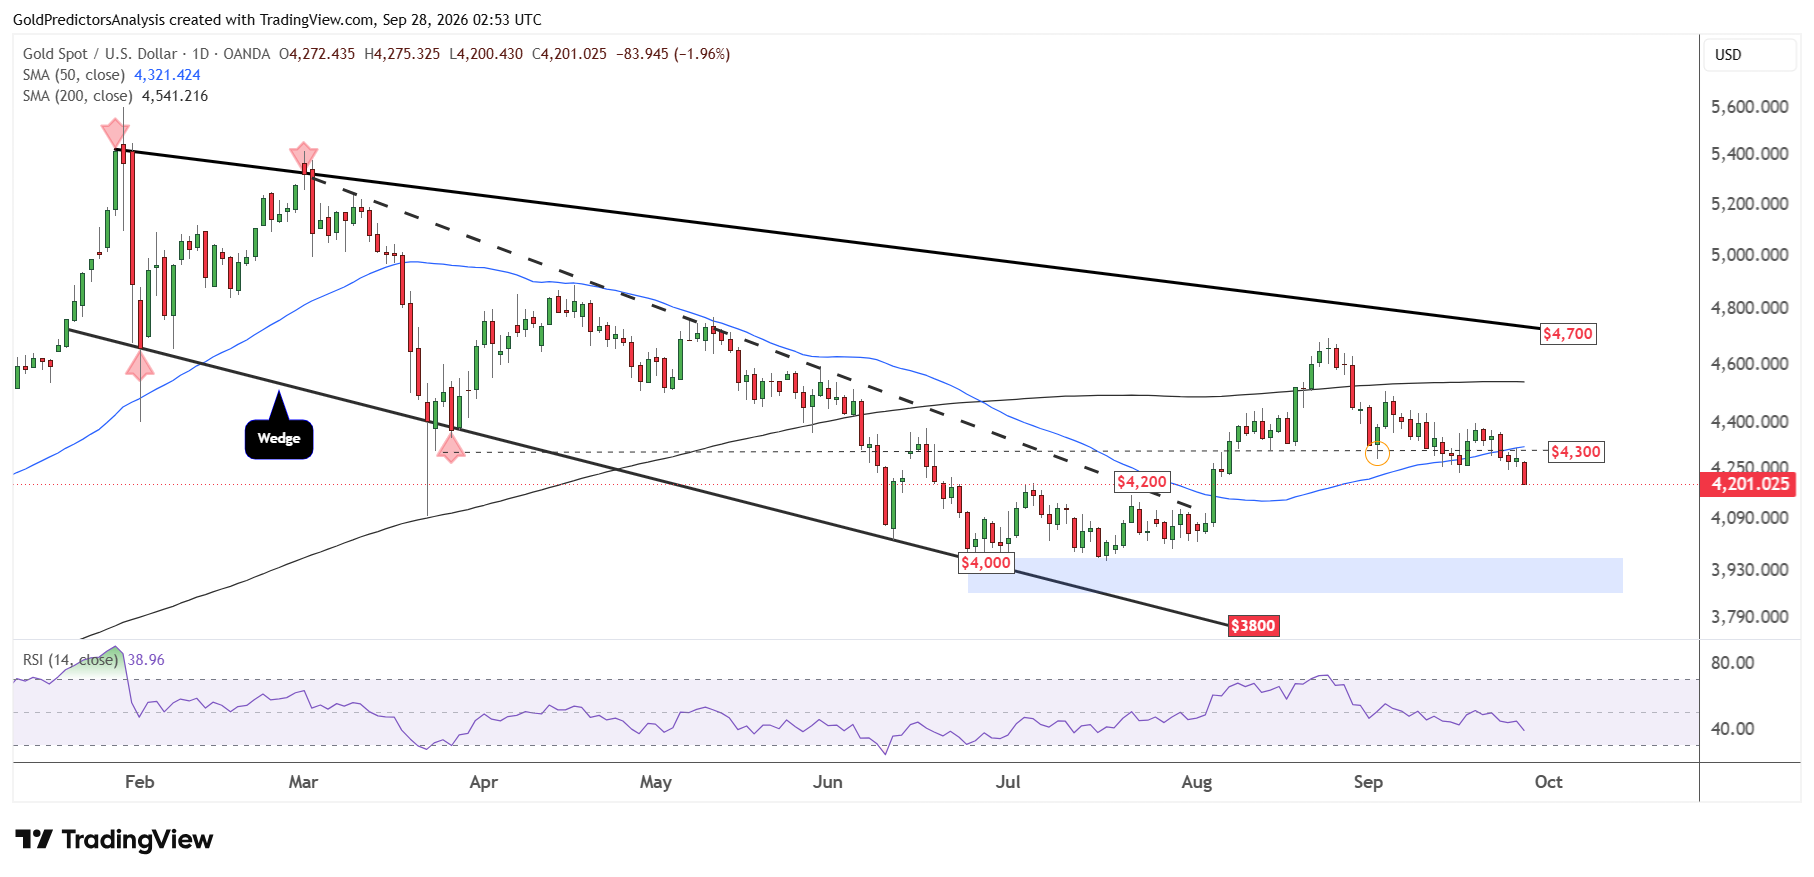
The daily chart for spot gold shows that the price remains under extreme bearish pressure and looks set to drop further. The price has broken below the $4,300 area at the 50-day SMA and continues to move towards $4,200 as immediate support.
A break below $4,200 will open the way for strong drop toward the $4,000 area. The RSI remains below the midline, which indicates further downside in the short term. The emergence of descending broadening wedge patterns from the highs of 2026 suggests heavy volatility in precious metals.
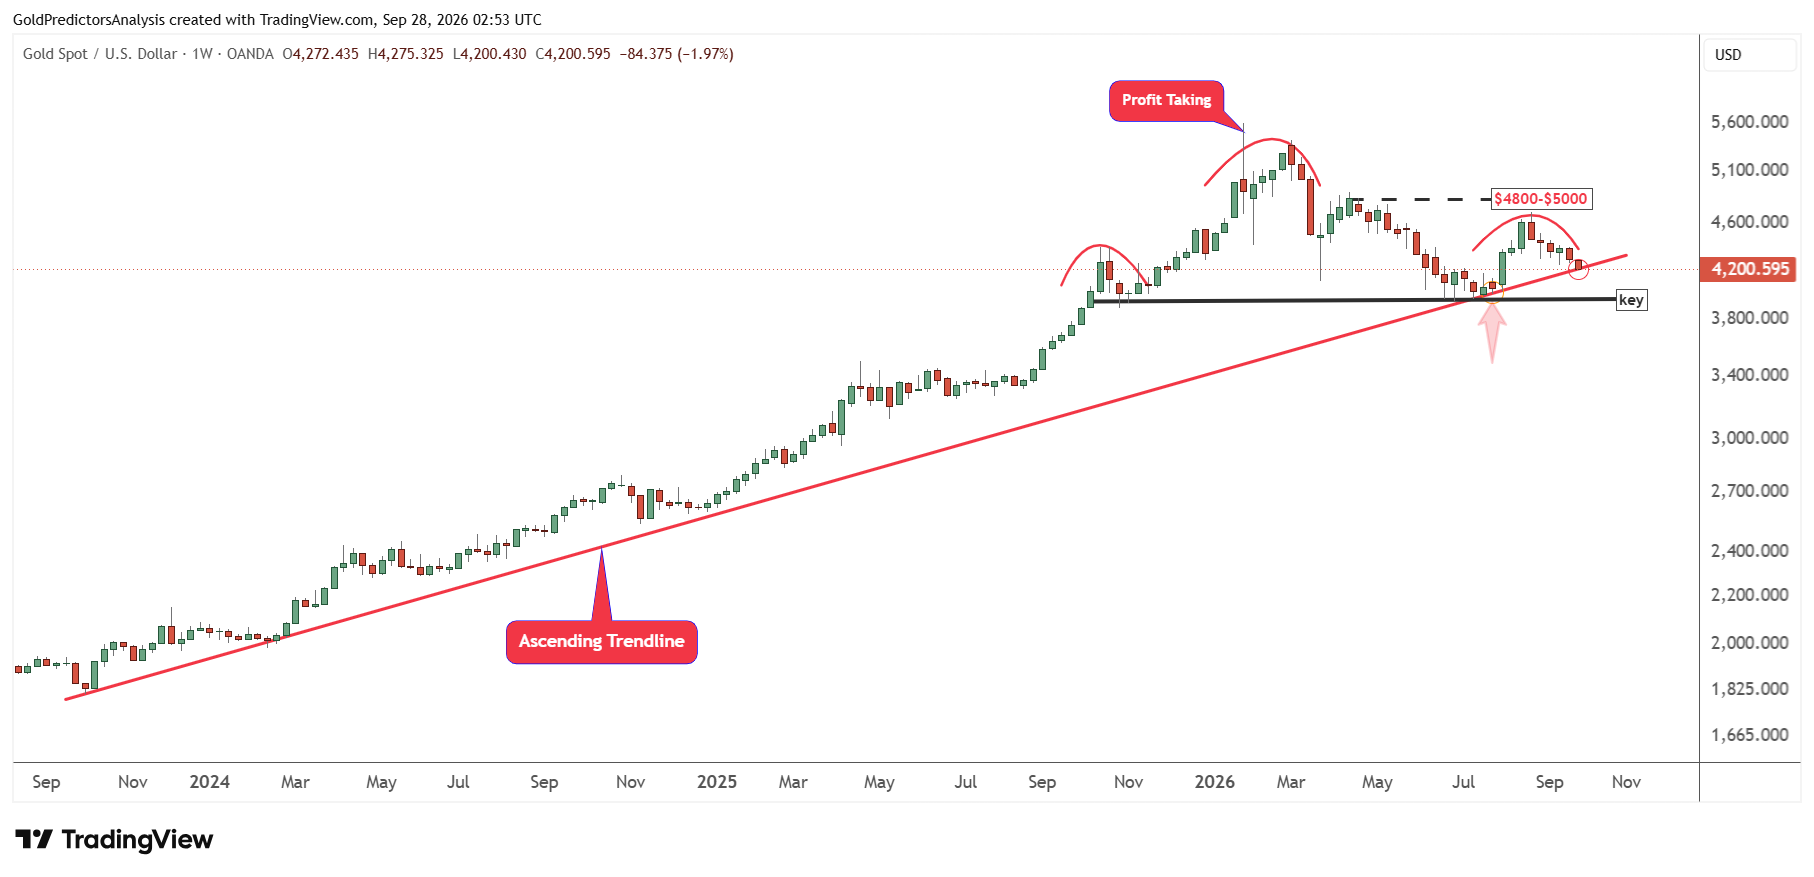
The weekly chart for spot gold shows that the price currently lies at the ascending trend line that stretches from the October 2023 lows. A break below this level will likely trigger a strong drop toward the $4,000 area.
The break below $4,000 will complete a bearish formation as seen in the chart below. Therefore, the price must hold above the $4,000 area to prevent a deeper decline in the gold market. But the immediate support at $4,200 must hold to prevent a decline to $4,000.
Gold Price Forecast
Every new Gold analysis as it publishes, today's technical signal and key levels, live price — on one page.
See all Gold forecastsGold 4-Hour Chart: Head-and-Shoulders Breakdown Below $4,300
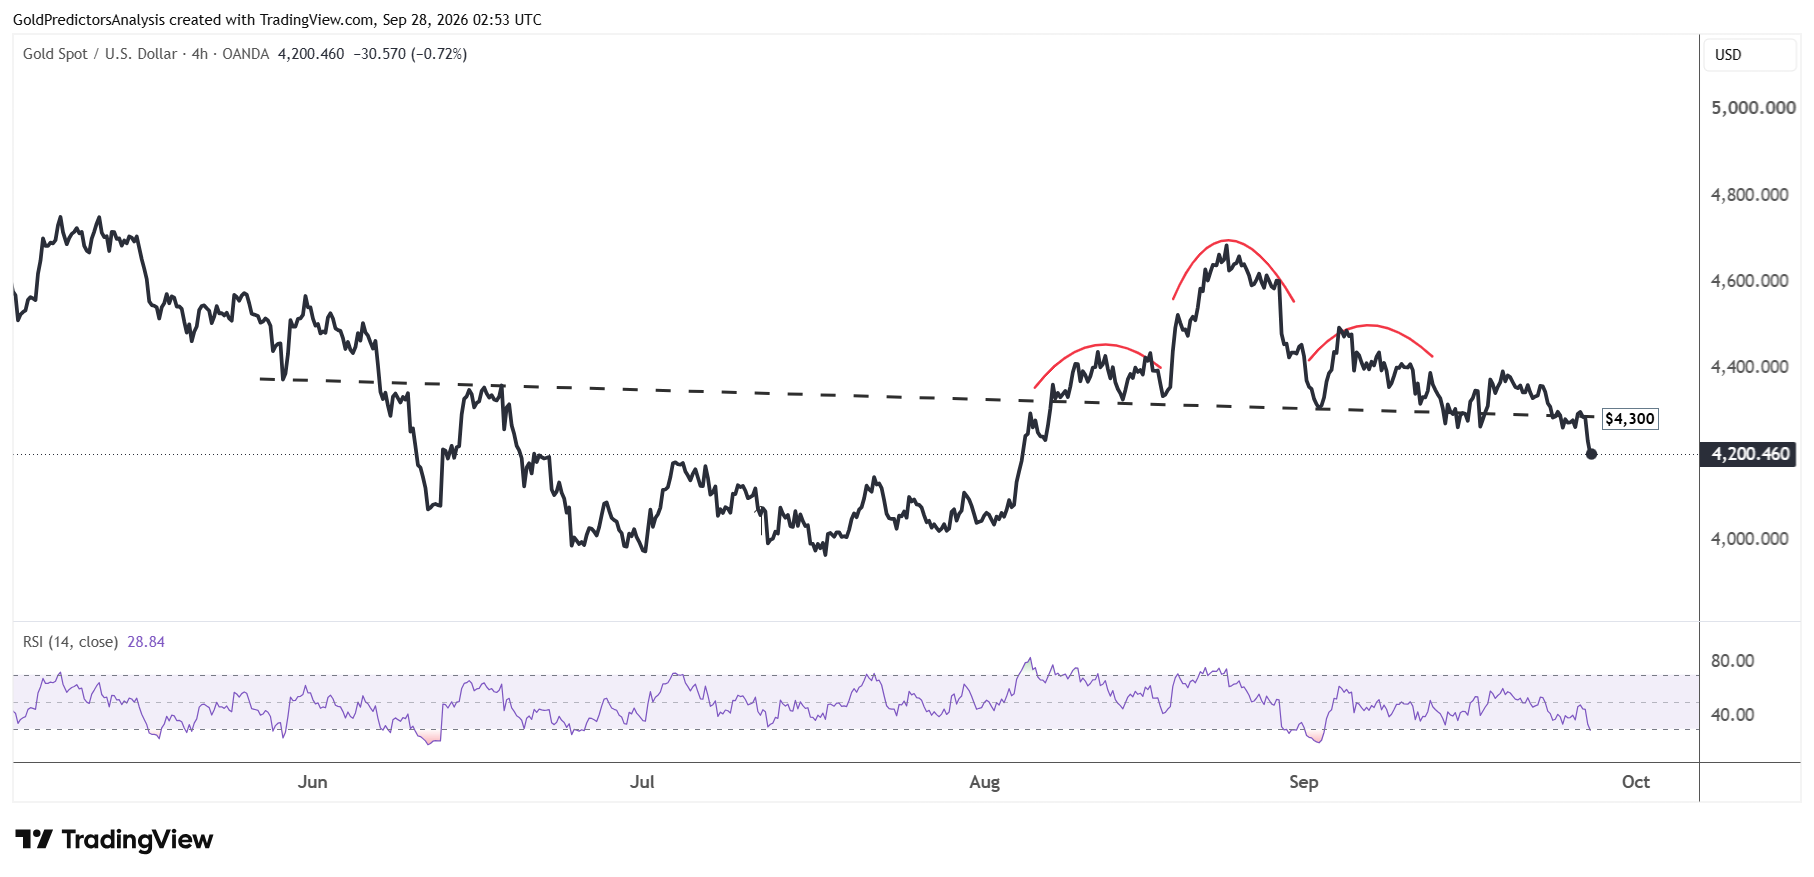
The 4-hour chart for spot gold shows that the price has broken below $4,300 after forming a bearish head and shoulders pattern as discussed in the previous analysis.
The price has hit $4,200, the immediate support after this breakdown. But the negative price action suggests further downside in the short term. The price may move towards the $4,000 area as the next support. A break below $4,000 will open the way for a drop towards $3,500.
Silver Price Forecast: Slide Below $63 Puts $60 Support in Focus
Silver Daily Chart: 50-Day SMA Break Raises Risk of $55
The daily chart for spot silver shows that the price has also broken below the 50-day SMA after consolidating between $64 and $72 during the past few weeks. This breakdown indicates that the immediate support for spot silver is the $60 area. A break below $60 will likely open the way for a strong drop toward the $55 region.
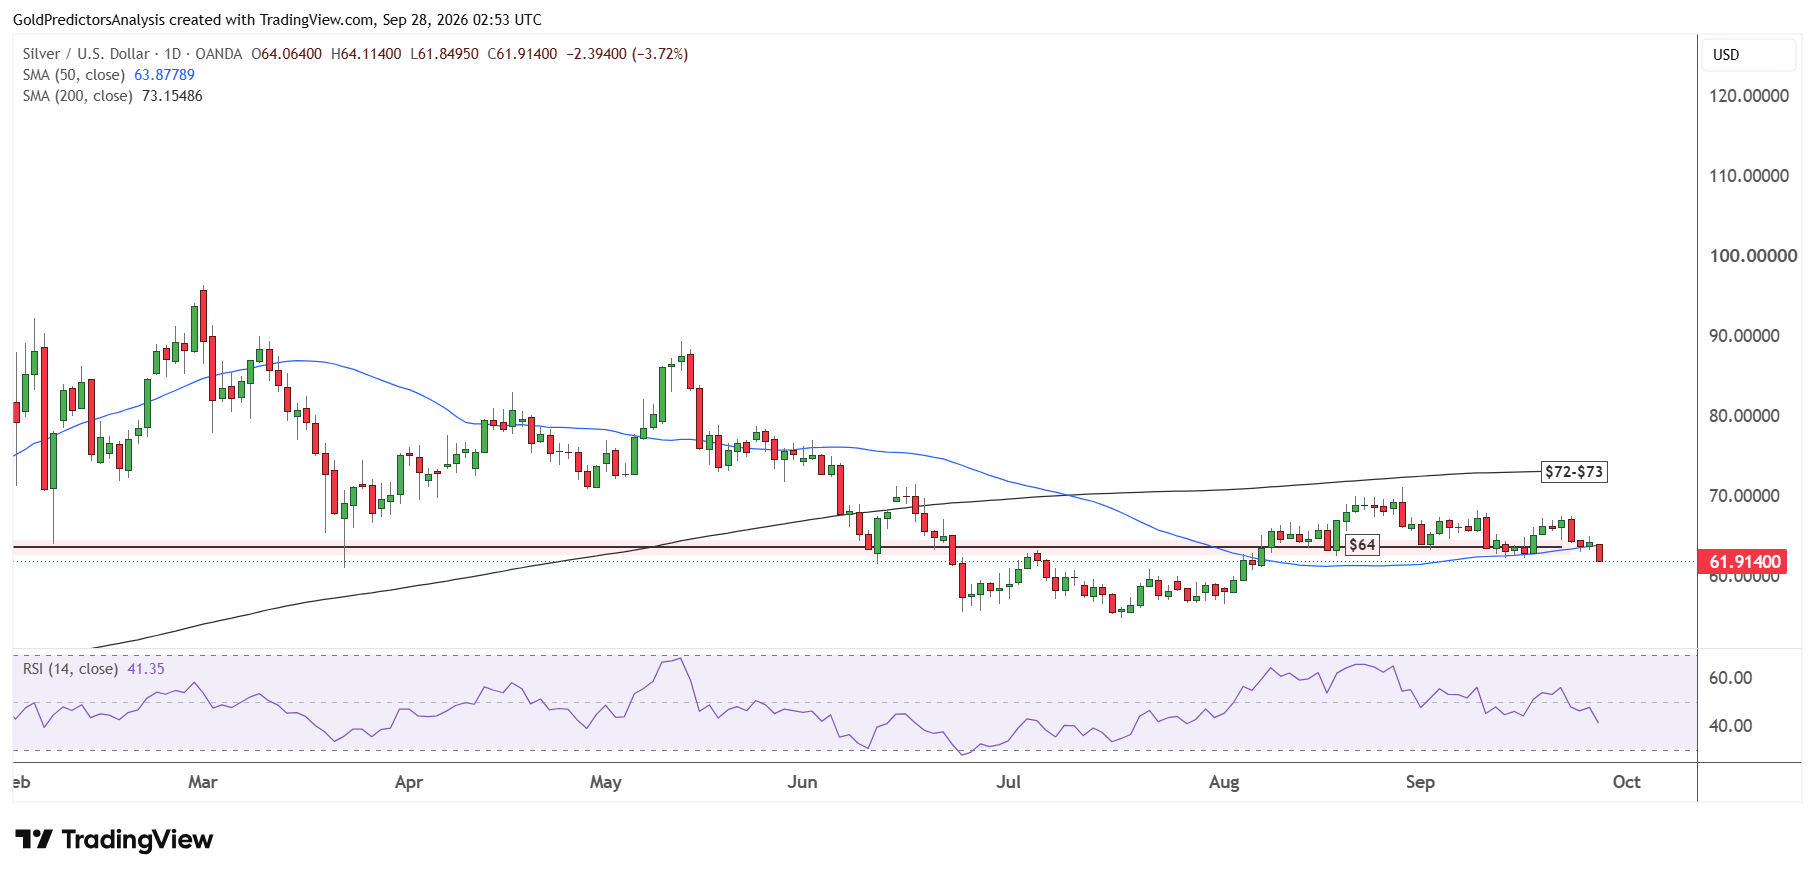
The RSI remains below the midline and suggests negative price action in the short term. But a recovery above $67 in spot silver will likely indicate a reversal in the market and support a move towards the $72 area.
Silver 4-Hour Chart: Break Below $63.10 Opens Path to $60
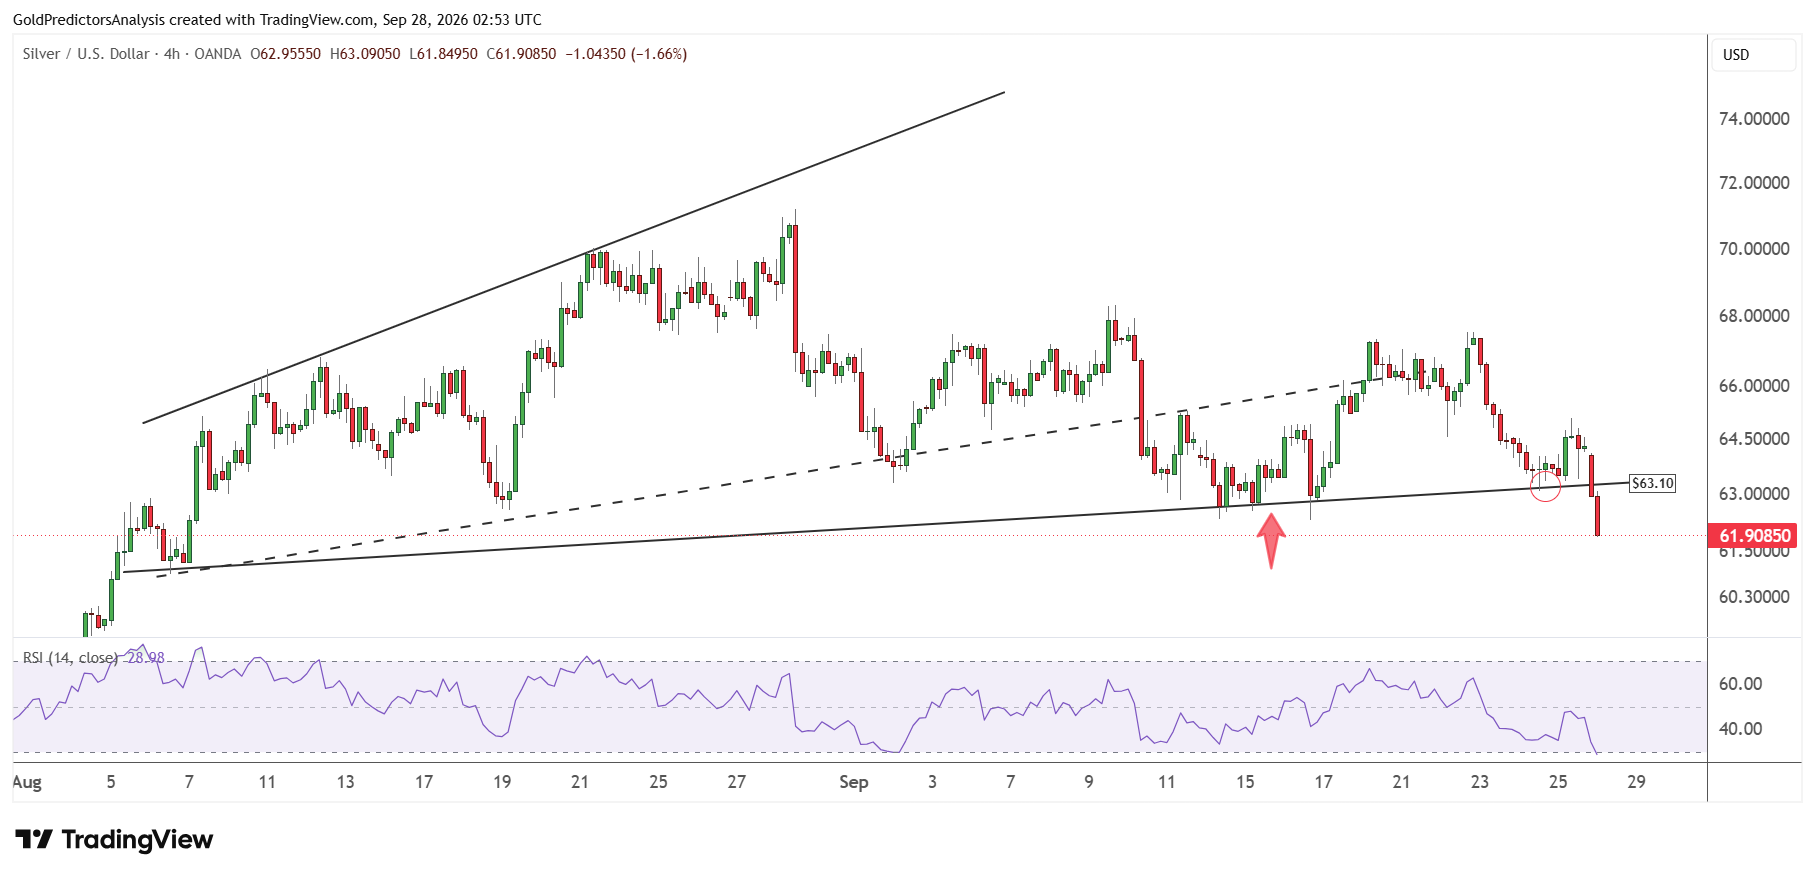
The 4-hour chart for spot silver shows that the price remains in a strong negative trend and has broken below the ascending broadening wedge pattern at $63.10.
This breakdown has opened the way for a strong drop toward the $60 area. A break below $60 will likely trigger further downside towards $55.
What Is Next for Gold and Silver Prices?
Gold and silver prices remain under pressure as higher yields and a strong US dollar outweigh support from tensions in the Middle East. The inflation report on Wednesday and the jobs report on Friday could decide whether this drop in precious metals will continue. Gold needs to hold $4,200 to avoid a move toward $4,000, while silver needs to stay above $60 to avoid a drop toward $55. The strong data from US could ease pressure and give both metals room to recover.
Read more: 5% Yields and Strong Dollar Cap Rebound Ahead of PCE