Gold (XAU) trades near $4,280 an ounce on Friday, while silver (XAG) remains below $64. Both metals are heading for weekly losses. The U.S. 10-year Treasury yield rose to 5.18% on Thursday and the US dollar reached a two-month high. The higher yields make bonds more attractive than metals that pay no interest. A stronger dollar also makes gold and silver more expensive for buyers using other currencies.
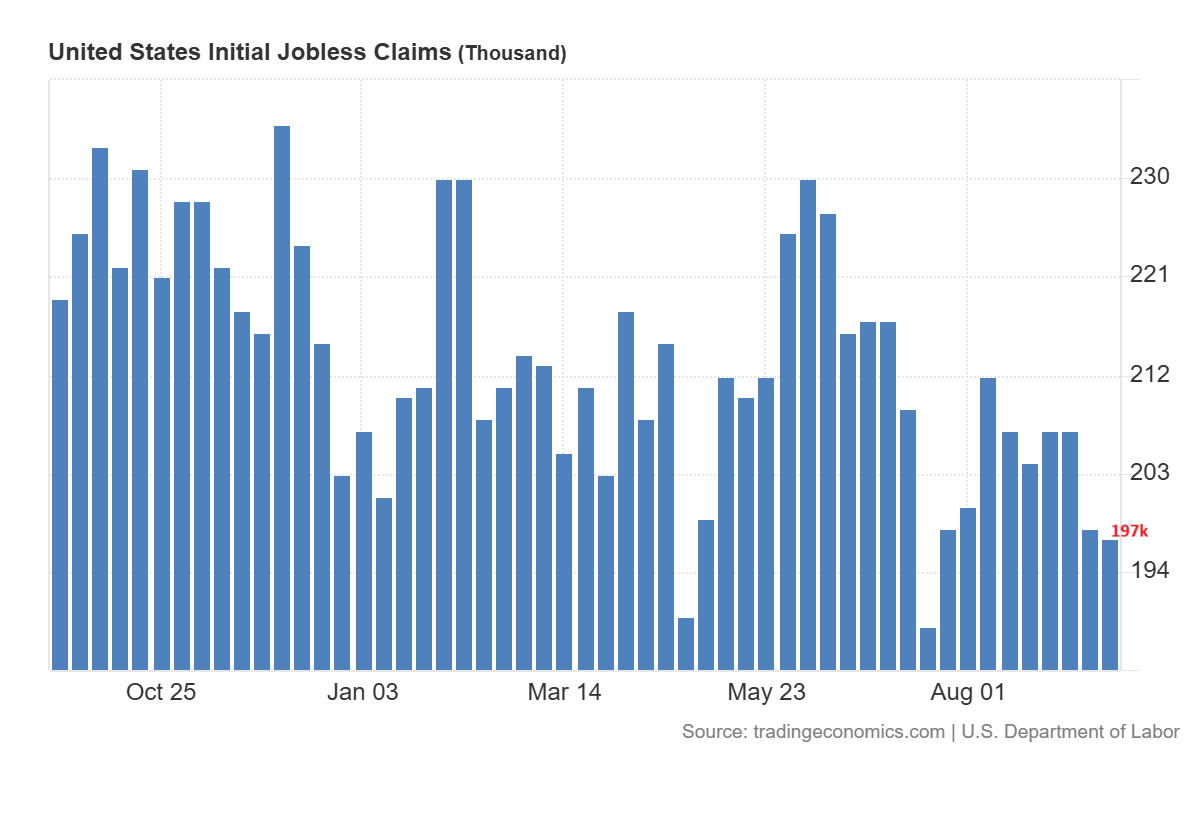
Silver has dropped more sharply than gold this week. The fresh U.S. data added to the pressure on both metals. The jobless claims dropped to 197,000 and the September flash composite PMI rose to 58.4.
Philadelphia Fed President Anna Paulson also said that further tightening may be needed. Oil eased early Friday on reports of a possible deal between the U.S. and Iran, which could help calm inflation concerns. For now, both metals need some relief from the dollar and Treasury yields to sustain a recovery.

Gold Price Forecast: $4,400 Resistance and $4,240 Support
Gold Charts: Short-Term Pressure, Long-Term Uptrend
The daily chart for spot gold shows that the price remains under pressure. It broke below the 50-day SMA around $4,300 and lost 0.32% on Thursday. The RSI remains below the midline, which shows pressure in the short term. However, a break above $4,400 is required to ease this pressure and push prices toward the 200-day SMA at $4,530.
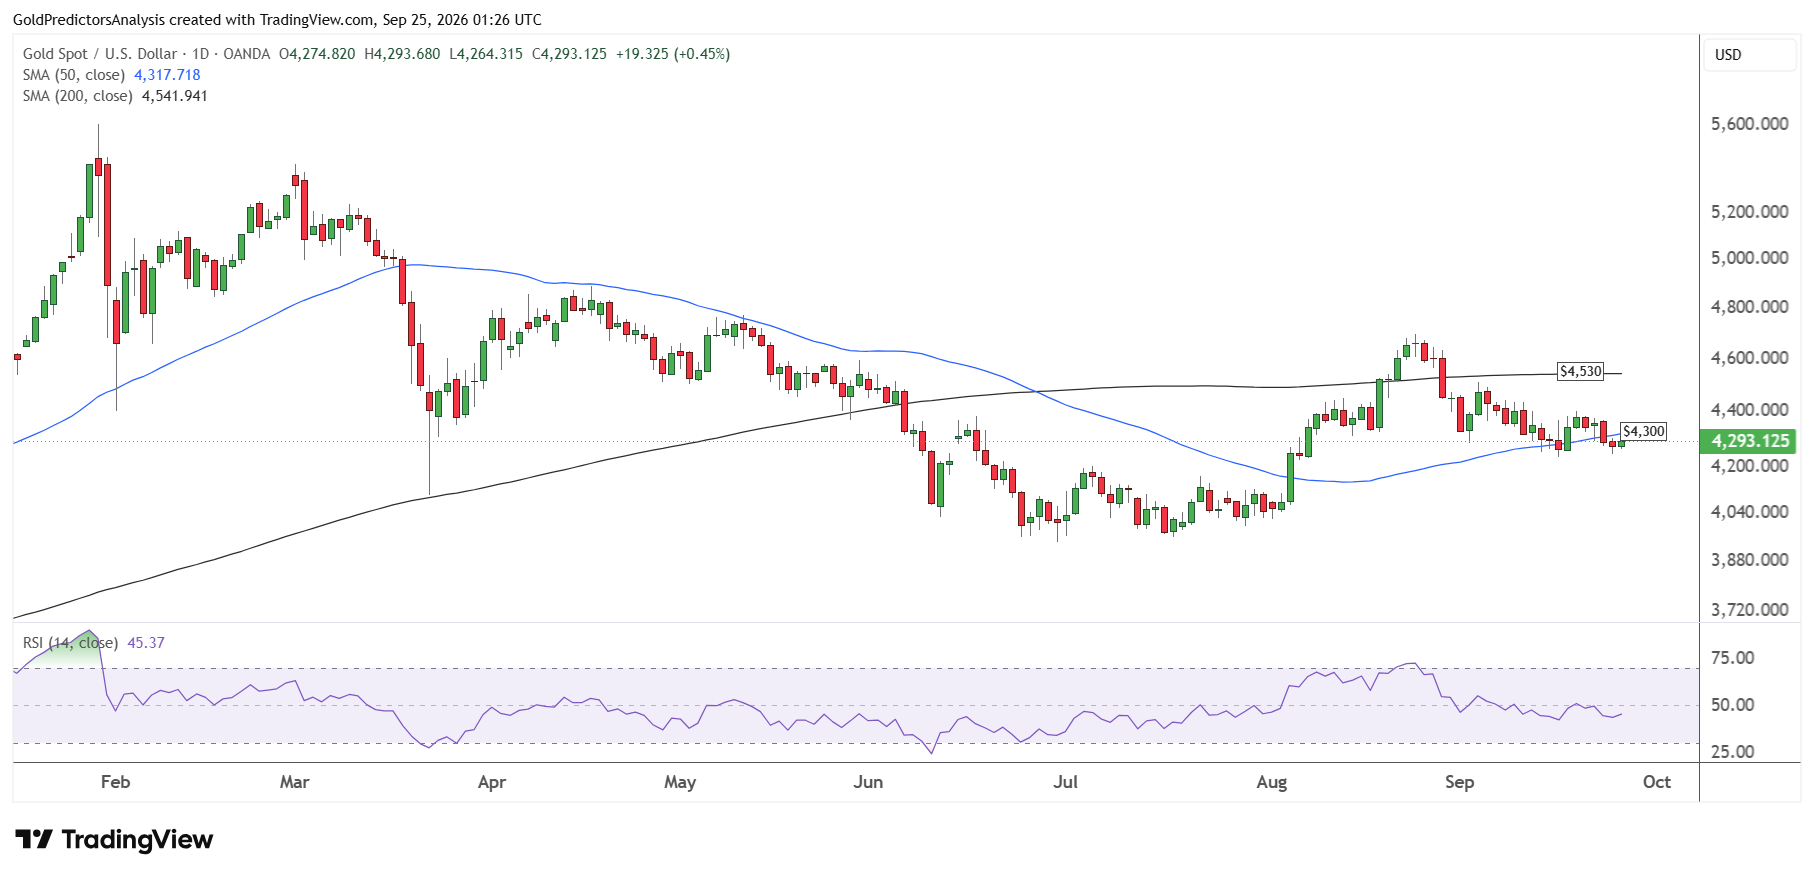
As long as the gold price remains below $4,530, prices will likely remain in a negative trend in the short term and face further downside. Immediate support on Friday is $4,240 and a break below this level will open the way for a drop toward the $4,150 area. A break below $4,150 will push the gold price further down toward the $4,000 mark.
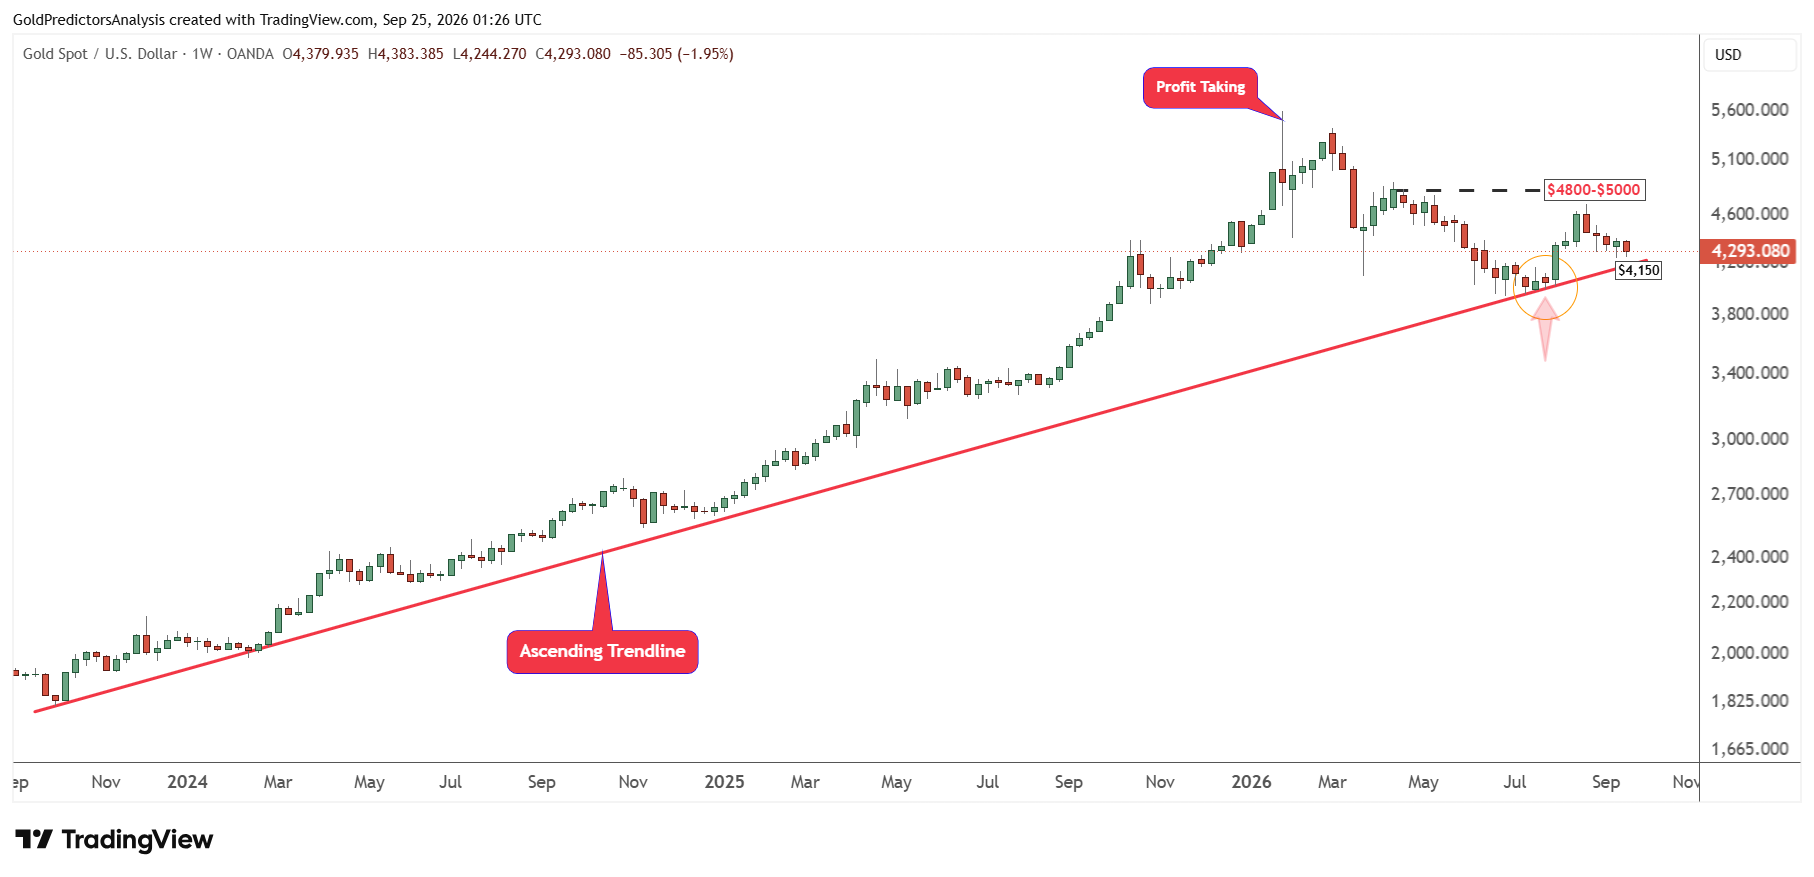
The weekly chart for spot gold also shows that the price remains above the ascending trendline that stretches from the October 2023 lows. The recent correction from January 2026 is due to profit-taking. The price has been consolidating below the $5,000 mark to stabilize the gains. But a break below $4,150 will likely break this ascending trendline and push prices towards the $4,000 area.
Gold Price Forecast
Every new Gold analysis as it publishes, today's technical signal and key levels, live price — on one page.
See all Gold forecastsGold Head-and-Shoulders Pattern Puts $4,240 in Focus
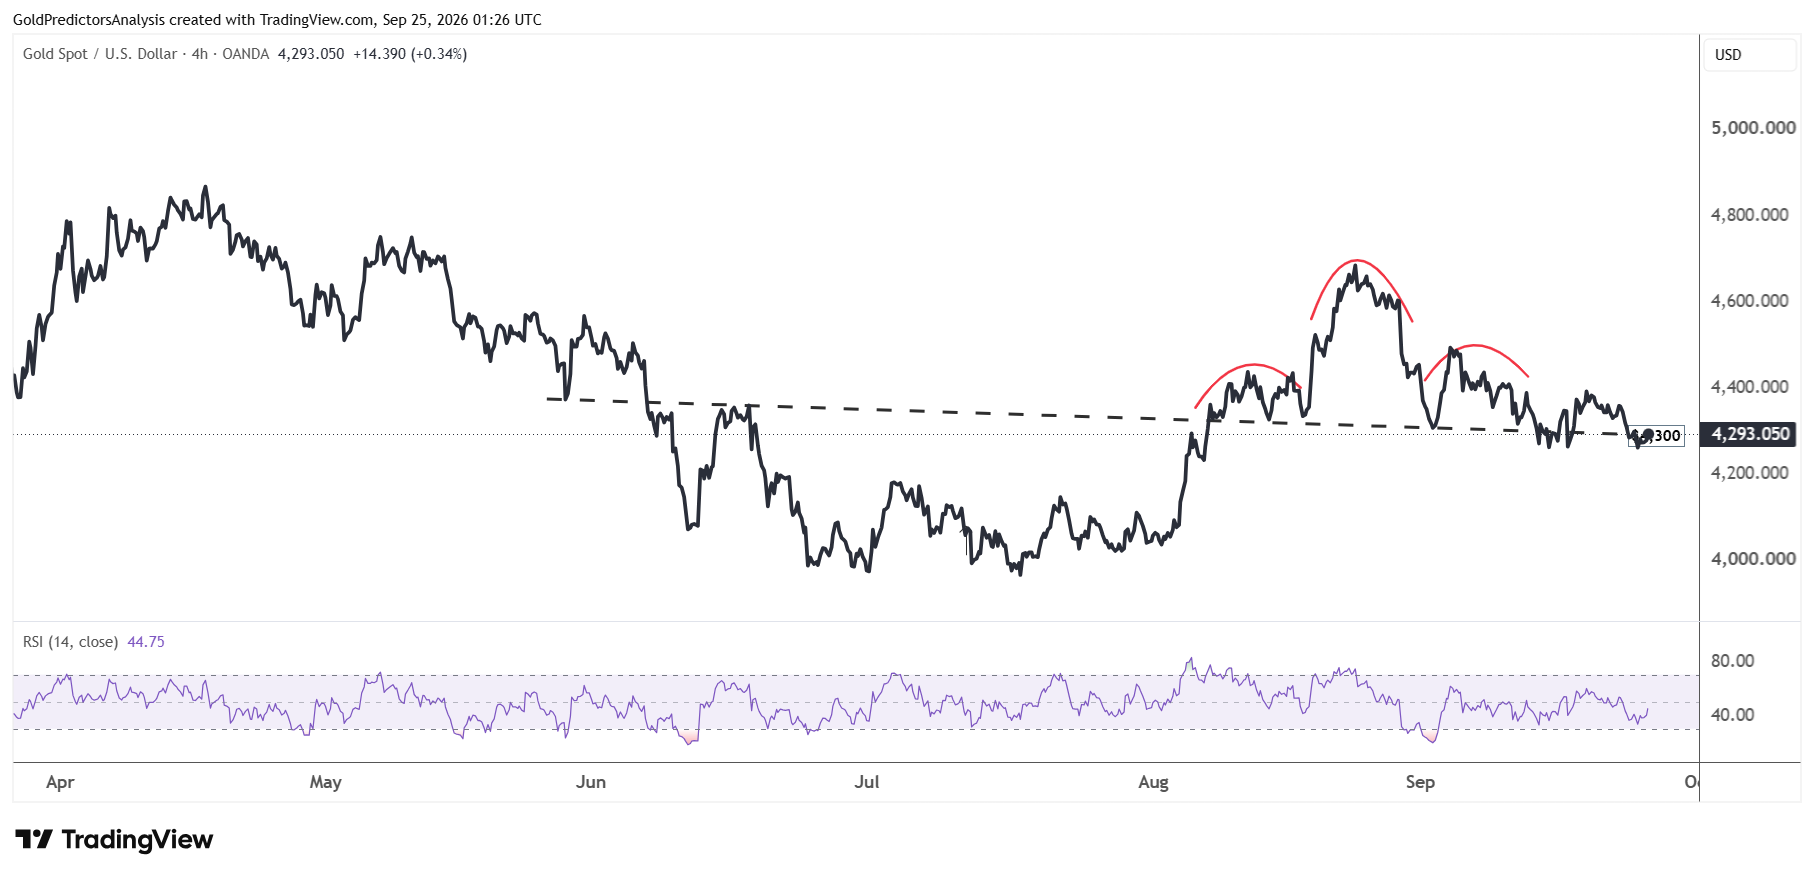
The 4-hour chart for spot gold also shows negative price action around $4,300. The price has formed a head and shoulders pattern in the short term. A break below $4,240 will likely push the gold price further down in the short term.
Silver Price Forecast: $63 Support and $72 Breakout Level
Silver Price Consolidates Between $63 and $70
The daily chart for spot silver shows that prices have been consolidating between $70 and $63 in the short term. Spot silver broke out of the triangle pattern in August 2026, but prices failed to break above $72. This triggered consolidation above the 50-day SMA.
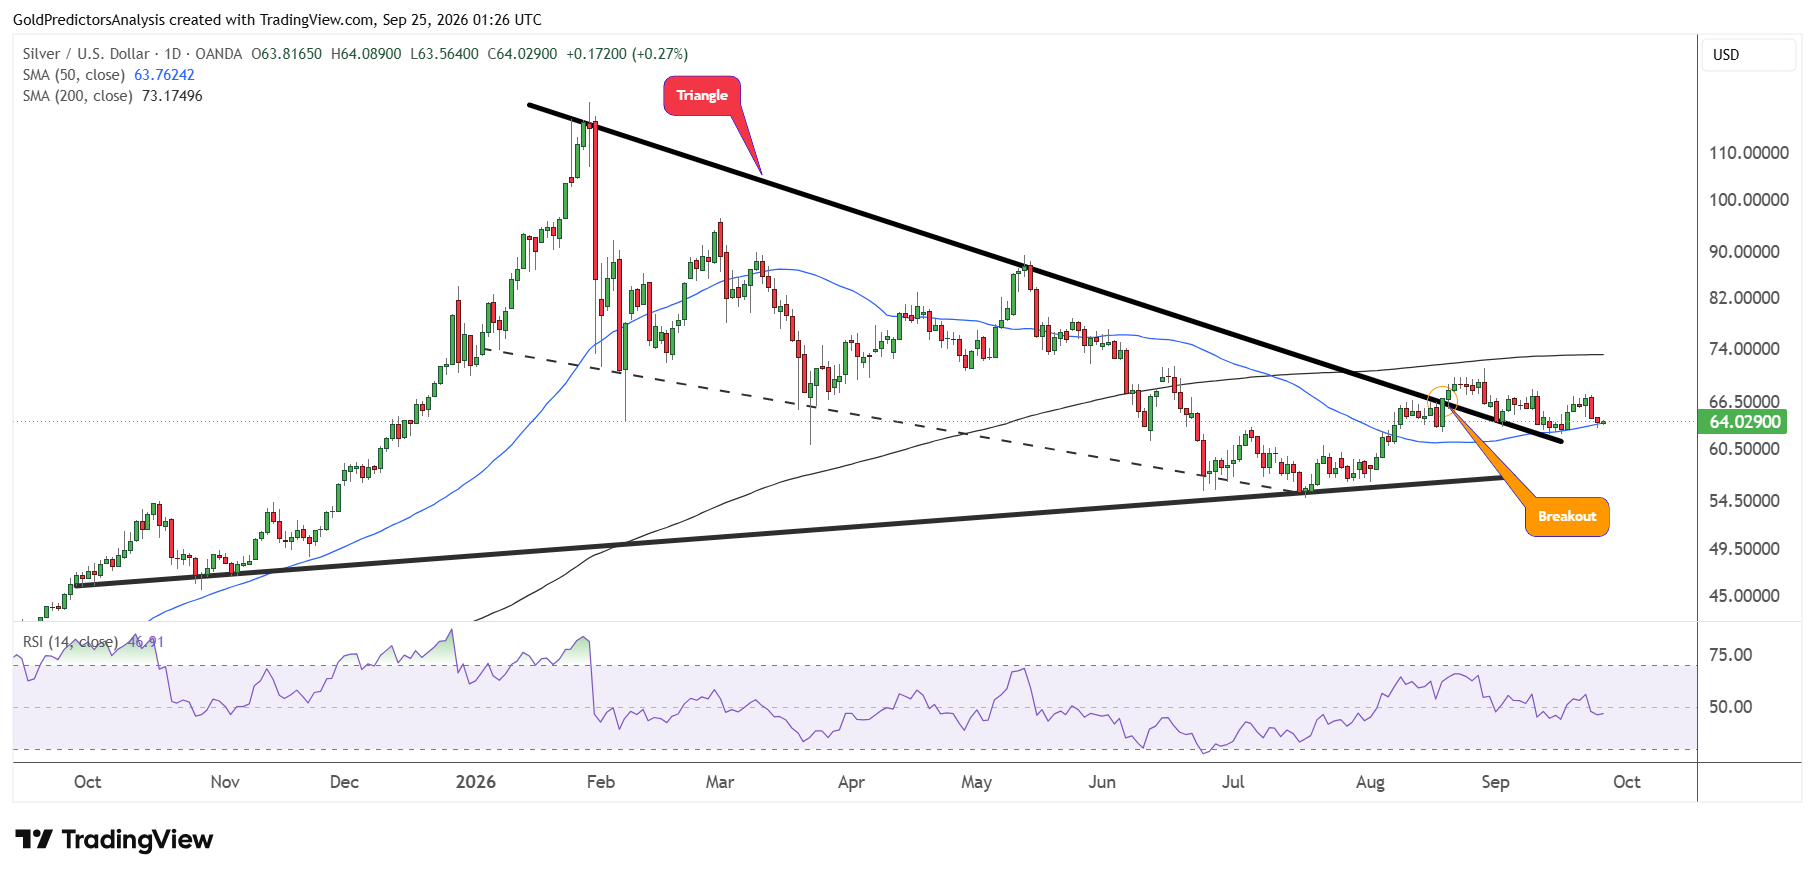
While gold has broken below the 50-day SMA, silver is still consolidating around this SMA. This shows consolidation in the short term. The RSI remains below the midline but has been hovering around it for the past three weeks.
Silver Support at $63.10 and Recovery Above $67.50
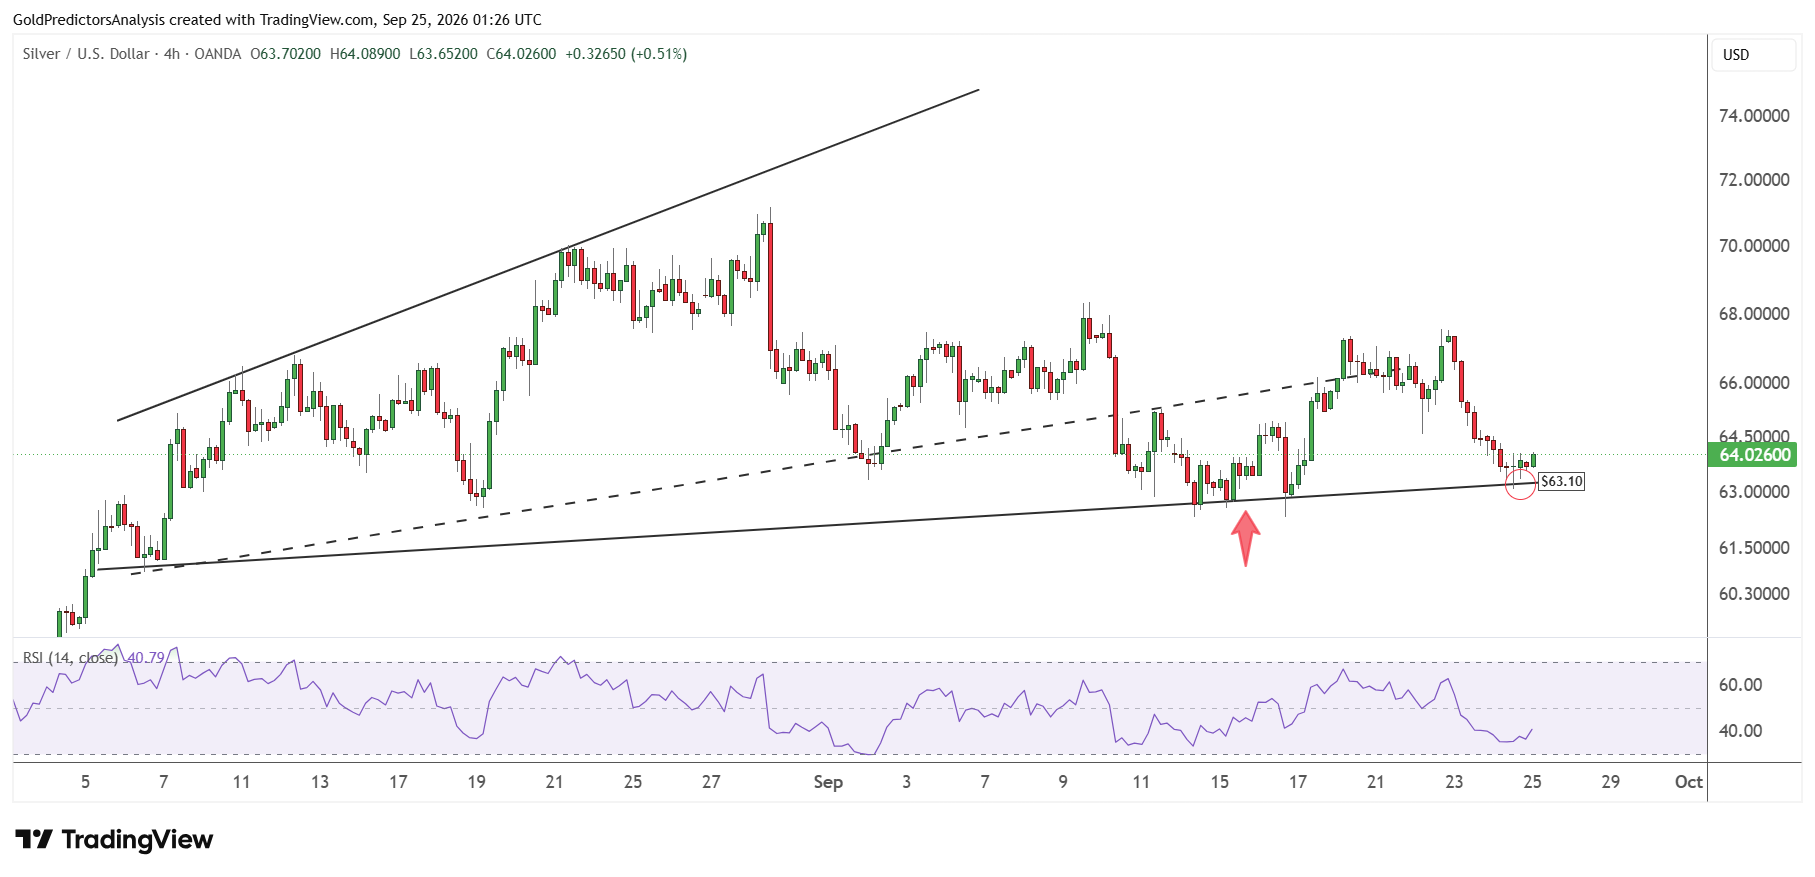
The 4-hour chart for spot silver also highlight the importance of current support around $63. The chart shows that the price is supported by an ascending broadening wedge pattern.
The immediate support remains at $63.10 and a break below this level will likely push the price toward the $60 area. break below $60 will push prices towards the $50-$55 zone, which is considered a strong support in the long term.
However, a recovery above $67.50 will likely indicate another move toward the $72 area in the short term. Silver needs to break above $72 to open the way for a strong rally toward the $90 region.
What to Watch Next for Gold and Silver Prices
Gold and silver are struggling to recover from the lows as high Treasury yields and strong US dollar keep buyers cautious. In my view, gold needs to rally back above $4,400 to regain strength. A break below $4,240 could lead to deeper drop. Silver needs to hold $63.10. A break below $63.10 would suggest a move to $60. If silver breaks $67.50, it could test $72 again. The next U.S. data and Fed comments may determine whether yields ease enough to give both metals room to recover.