


Record High Leaves Breakout Unconfirmed
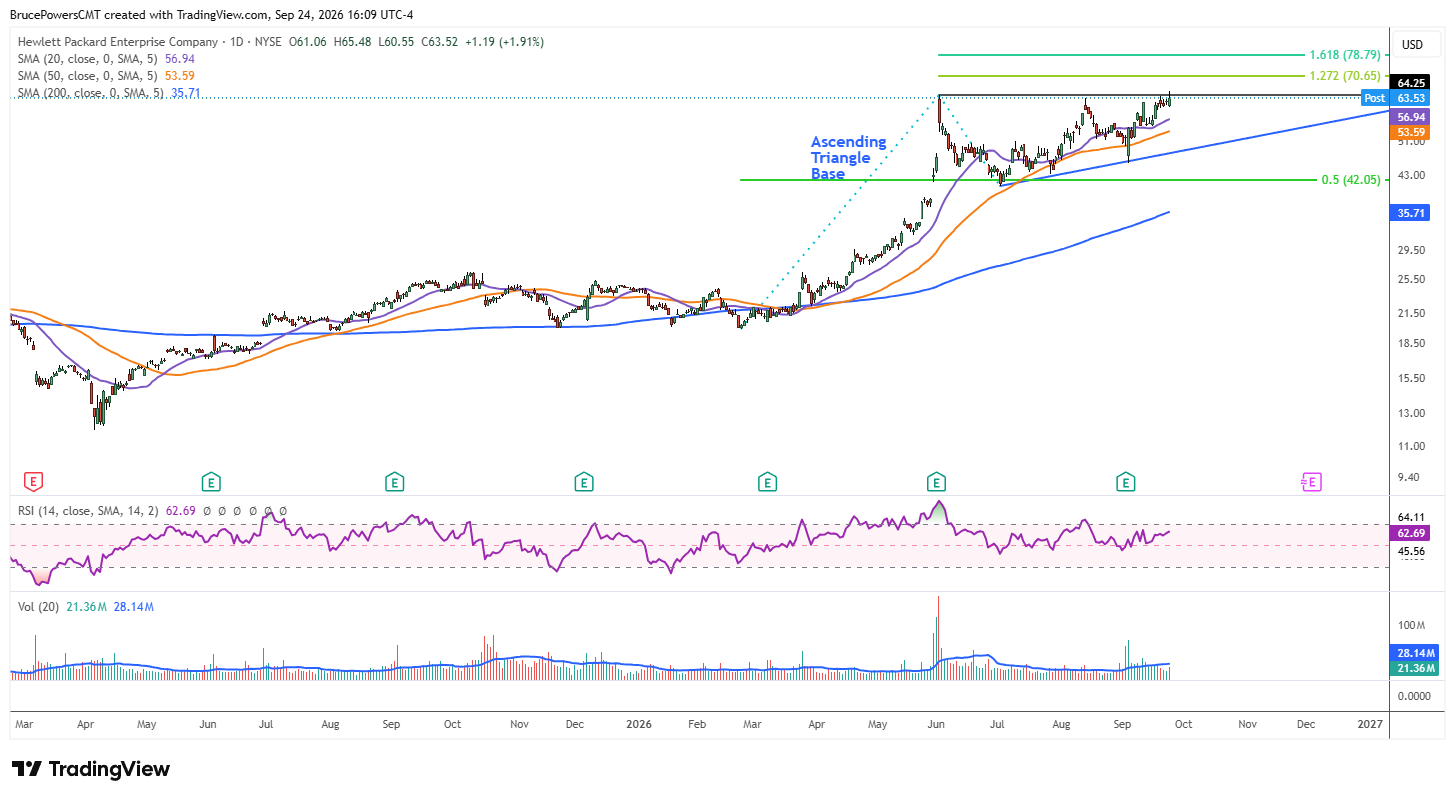
Hewlett Packard Enterprise Company (HPE), a global enterprise technology company, broke out of a bullish basing pattern on Thursday, triggering a continuation signal for the long-term bullish trend and reaching a new record high of $65.48. However, breakouts to new highs are not always successful and prone to failures.
Only an initial signal triggered Thursday, and further signs of strength are needed to confirm the breakout. Although the prior peak of $64.25 from June was exceeded, volume improved by only a small amount to a two-day high and the closing price for Thursday was at $63.53, below the breakout level. That close does not confirm the breakout and its implications.

Ascending Triangle Built the Base
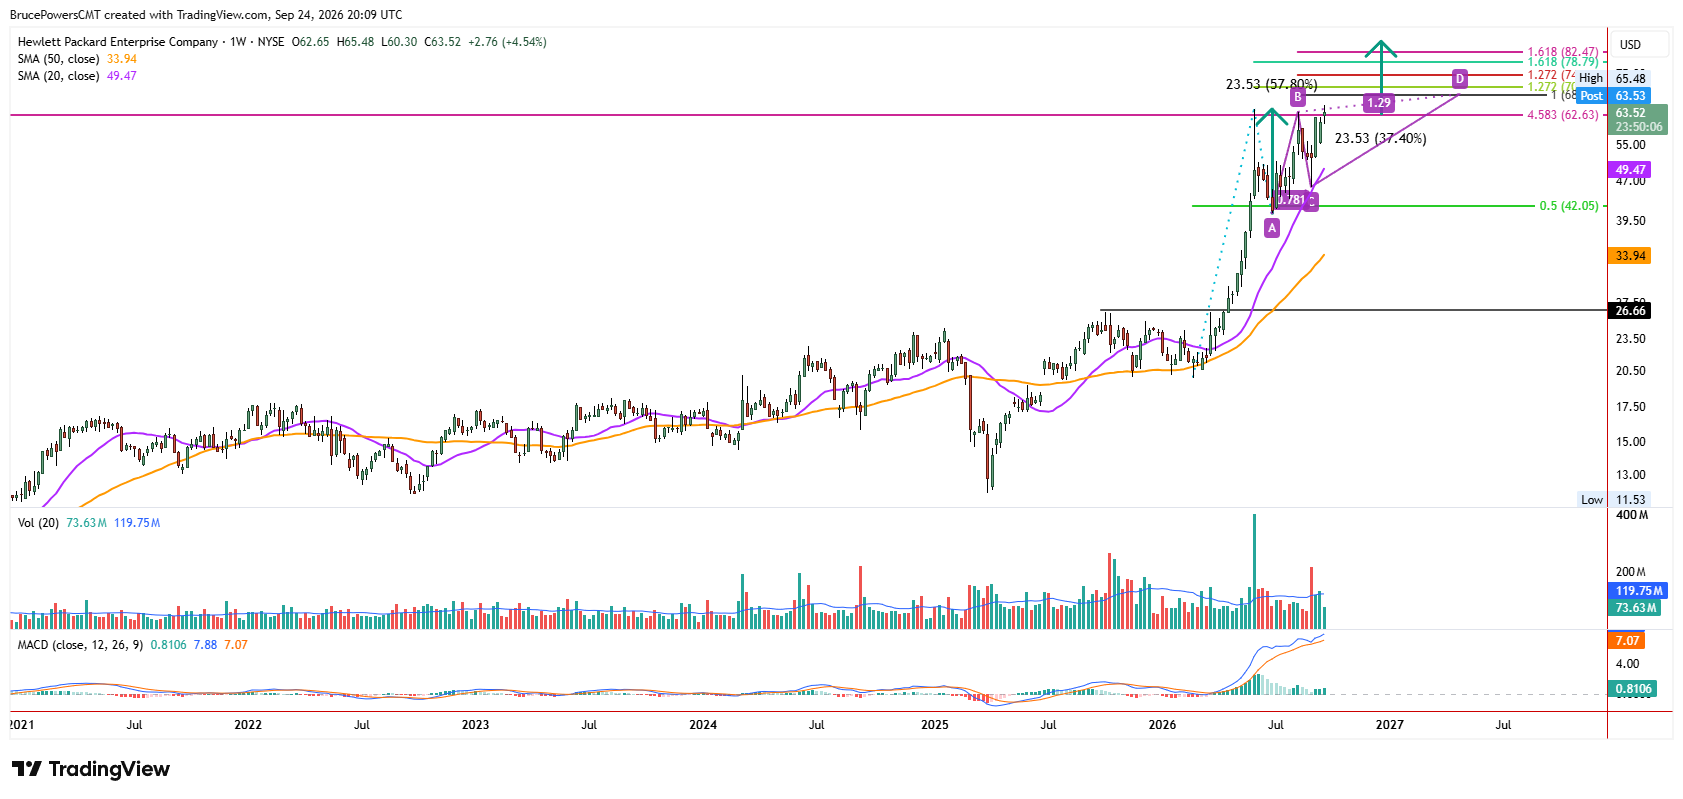
Recent consolidation took the form of an ascending triangle pattern, which formed after completing a 50% retracement of the prior advance and a higher swing low of $40.72 in July. Subsequently, dynamic support near the rising 20-week moving average was identified during an early September decline that resulted in a higher swing low of $45.70 and established the lower boundary of consolidation.
First Defense Sits at $60.30
If further signs of hesitation are seen prior to a bullish continuation above Thursday’s high, short-term support is near the lower boundary of this week’s relatively tight daily range, with a low of $60.30 from Monday. Thursday’s low of $60.55 provided another retest of that support zone. The 20-day moving average near $56.95 will then mark key dynamic support and has a good chance of being tested unless an undercut of $60.30 is followed by a relatively quick recovery. There is also structure support at the recent higher swing low of $55.02.
$86.20 Stays a Measure Only
A decisive and sustained upside breakout above the June peak of $64.25 would put higher potential targets in play. Several projections are on the weekly chart, but there is no confluence of levels, which would help determine the potential significance of upside targets. Notably, a simple measuring objective determined from the ascending triangle points to around $86.20 as a possible upside target. Until that breakout is confirmed by follow-through above $65.48, $86.20 remains a measured objective rather than an active destination – the same test Thursday’s record high still must pass.
If you’d like to know more about technical analysis and how traders use it, please visit our educational area.


