NASDAQ 100 Technical Analysis
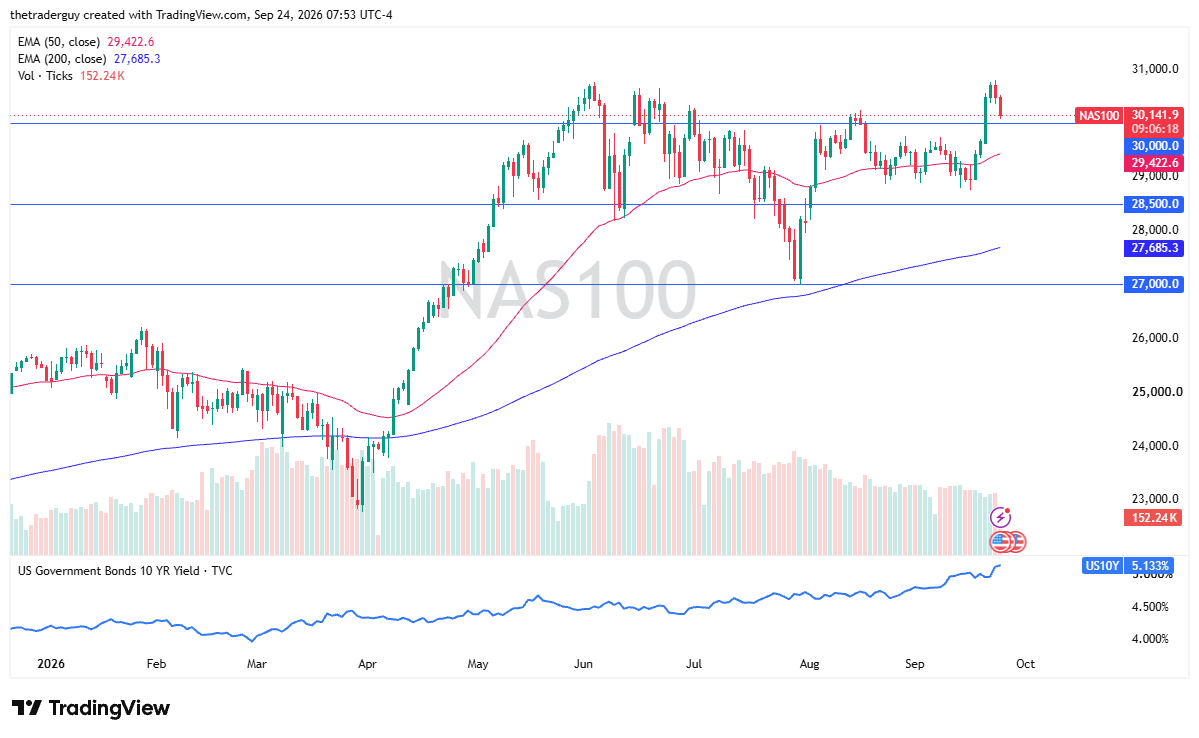
The Nasdaq 100 has fallen pretty significantly during the early part of the session on Thursday as interest rates in America continue to climb. The Nasdaq is looking at the 30,000 level underneath as potential support, so we’ll see whether or not it bounces from there. If we were to break down below the 30,000 level, then it is a situation where it starts to accelerate to the downside.
But overall, you have to keep in mind we just pulled back from the all-time high area. Considering what’s going on around the world right now, the Nasdaq 100 still looks fairly strong overall.

Dow Jones 30 Technical Analysis
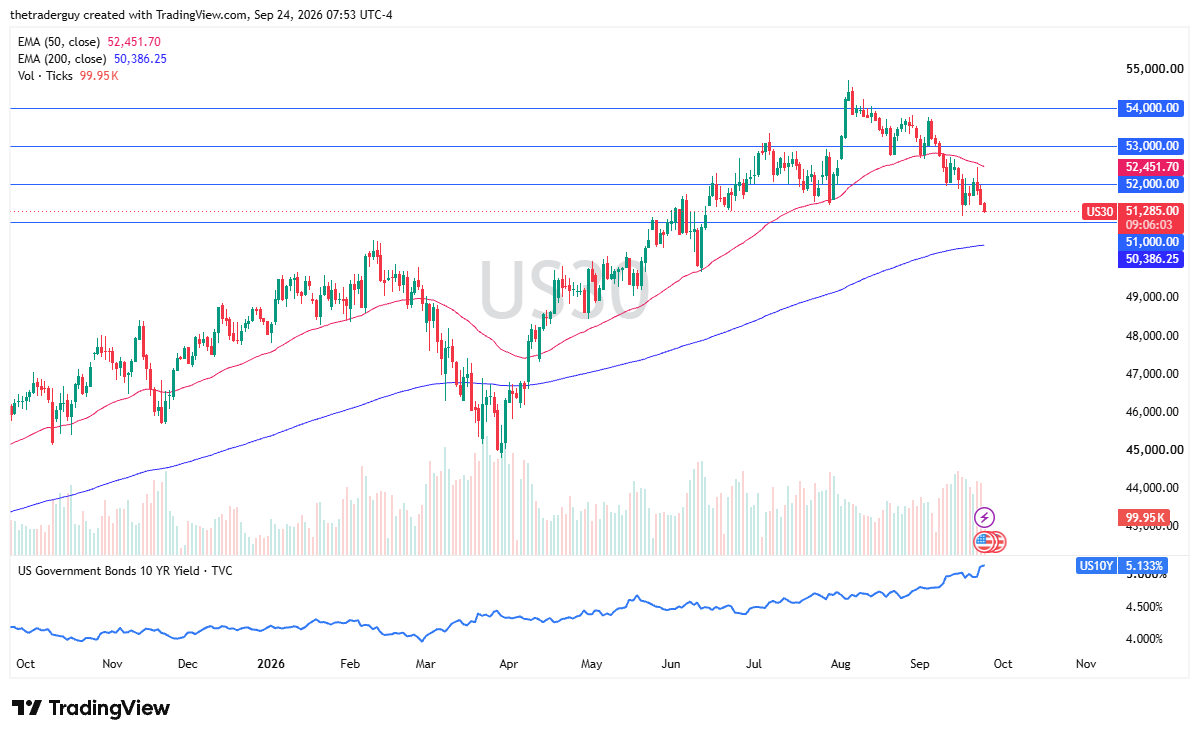
The Dow Jones 30, on the other hand, looks quite a bit weaker, as we have been drifting lower for a while. Now it looks like the 51,000 level underneath might be tested. That is an area that previously had been support and resistance, so we’ll have to see how that plays out. But again, it’s the same story: interest rates and, in this case, oil are really starting to influence that market.
S&P 500 Technical Analysis
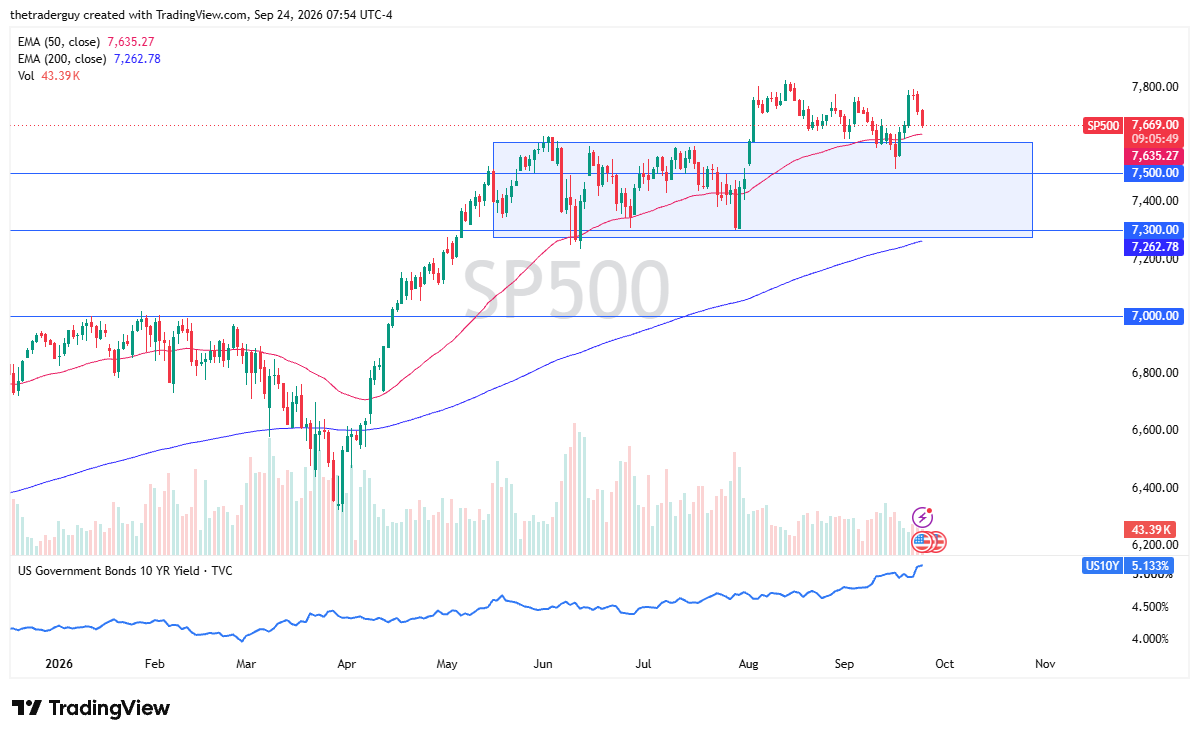
Meanwhile, the S&P 500 finds itself falling as well in pre-market trading. That being said, the 50-day EMA sits just below, and the 7,600 level is an area that we will be watching again, as we have been consolidating for a while.
Overall, I still think this is a market that has plenty of support underneath it, despite the fact that rates are getting out of control. Over the longer term, it has gone from the lower left to the upper right, and until that changes, I look at this as a market where dips offer opportunities. We’ve actually just been consolidating since the beginning of August at this point.
If you’d like to know more about technical analysis and how traders use it, please visit our educational area.