
Gold & Silver Outlook: Strong U.S. Data Fuels Fed Hike Bets as Falling Oil Offers Relief
Gold and silver declined again on Thursday as more hawkish comments from Fed officials this week further strengthened expectations for more aggressive monetary policy tightening.
U.S. economic data released this week showed further strength in the U.S. economy. Markets expect the Fed to continue its rate hiking campaign. The results from the S&P Global monthly PMI survey showed the services and the composite PMI for the U.S. in September at 58.4, the highest level since July 2021.
On Wednesday Fed Governor Michael Barr said it would likely take a series of further rate increases to bring inflation down to the Fed’s 2% target. He was supported by comments from other officials this week including Susan Collins and Tom Barkin, and last week from Philadelphia Fed President Albert Musalem.
Although many of them acknowledged that the labor market is showing signs of tightness and inflation may be easing, they expressed the view that it is too early to ease monetary policy.
Bullion is expensive in the current environment due to rising growth, and rate and dollar indexes. Rising dollars and yields increase the opportunity cost. Additionally, dollars are cheaper to convert to other currencies to purchase bullion.
Oil is currently trading lower due to more positive diplomatic talks with Iran and improved supply conditions in the Gulf. Improved supply conditions and positive diplomacy talks may reduce upside inflationary pressure and capping the FED’s rate hike ceiling.
Investment demand for gold has increased. Holdings of gold exchange-traded funds (ETFs) increased by 121 metric tons in August. Additionally, the PBOC increased its bullion holdings by 20 metric tons.
As with gold, the outlook for silver is bearish given its yield and dollar sensitivity and its role in the global economy.
The outlook for both gold and silver remains bearish with the largest risk to the downside being continued policies to reduce monetary stimulus.

Gold Technical Analysis: XAU/USD Breaks $4,299 Support as $4,274 Becomes the Immediate Test
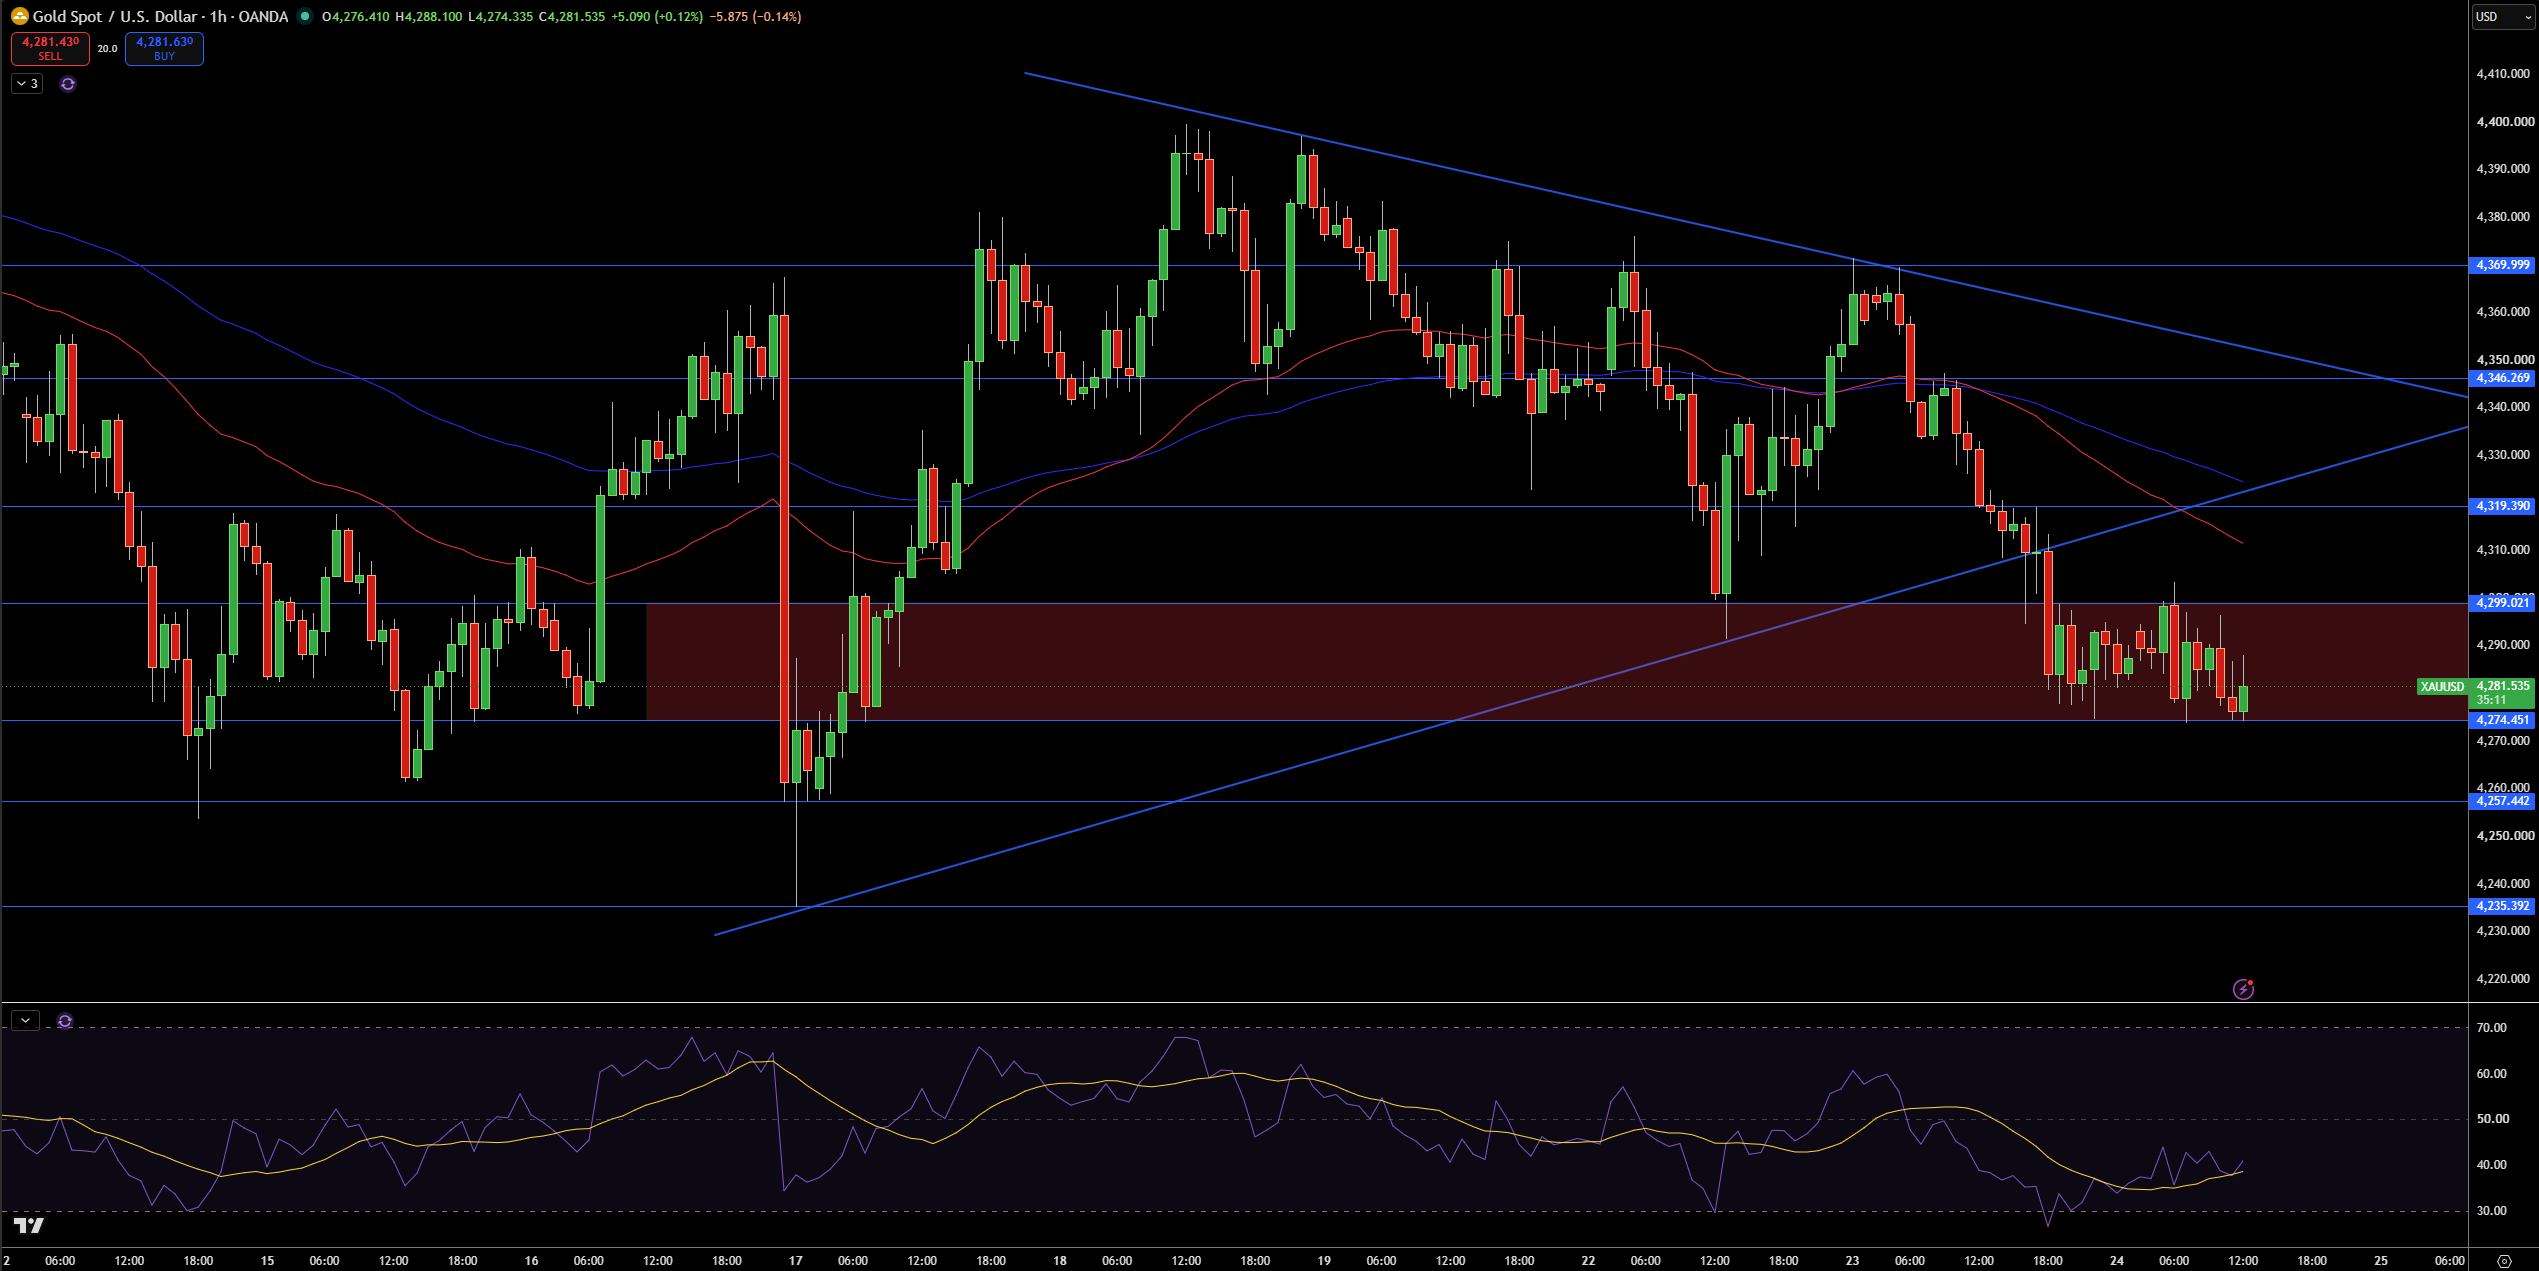
Gold (XAU/USD) broke below the support at $4,299 and the rising trend line, and is currently trading at $4,282. A break below the support at $4,299 caused the trend line to lose its support. The moving averages are currently bearish.
$4,274 is the next support below the current price. Below that, $4,250 is additional support. The trend will remain down until $4,358 is retaken.
Resistance at $4,311 will require a trend change, and $4,332 will also provide resistance. Beyond that, resistance lies at $4,350.
The first support is at $4,274. A break below that will bring the next support at $4,257 and then $4,235.
Resistance is at $4,299, with support at $4,257. A break below $4,257 will bring the next support at $4,235. A move higher brings the next resistance at $4,319, then $4,346 and finally $4,370.
The RSI is in the lower half of its range. The absence of extreme conditions suggests that sellers are not in complete control of the market. The trendline and $4,299 resistance combined with the previous rising trendline makes $4,257 and $4,235 likely, next support levels. The $4,299 resistance may give way to a move higher, but I will maintain a Bearish bias. A closing above $4,319 will make the Bearish case less likely.
Gold Price Forecast
Every new Gold analysis as it publishes, today's technical signal and key levels, live price — on one page.
See all Gold forecastsSilver Technical Analysis: XAG/USD Breaks Below $64.53 as $63.38 Support Comes Into Focus
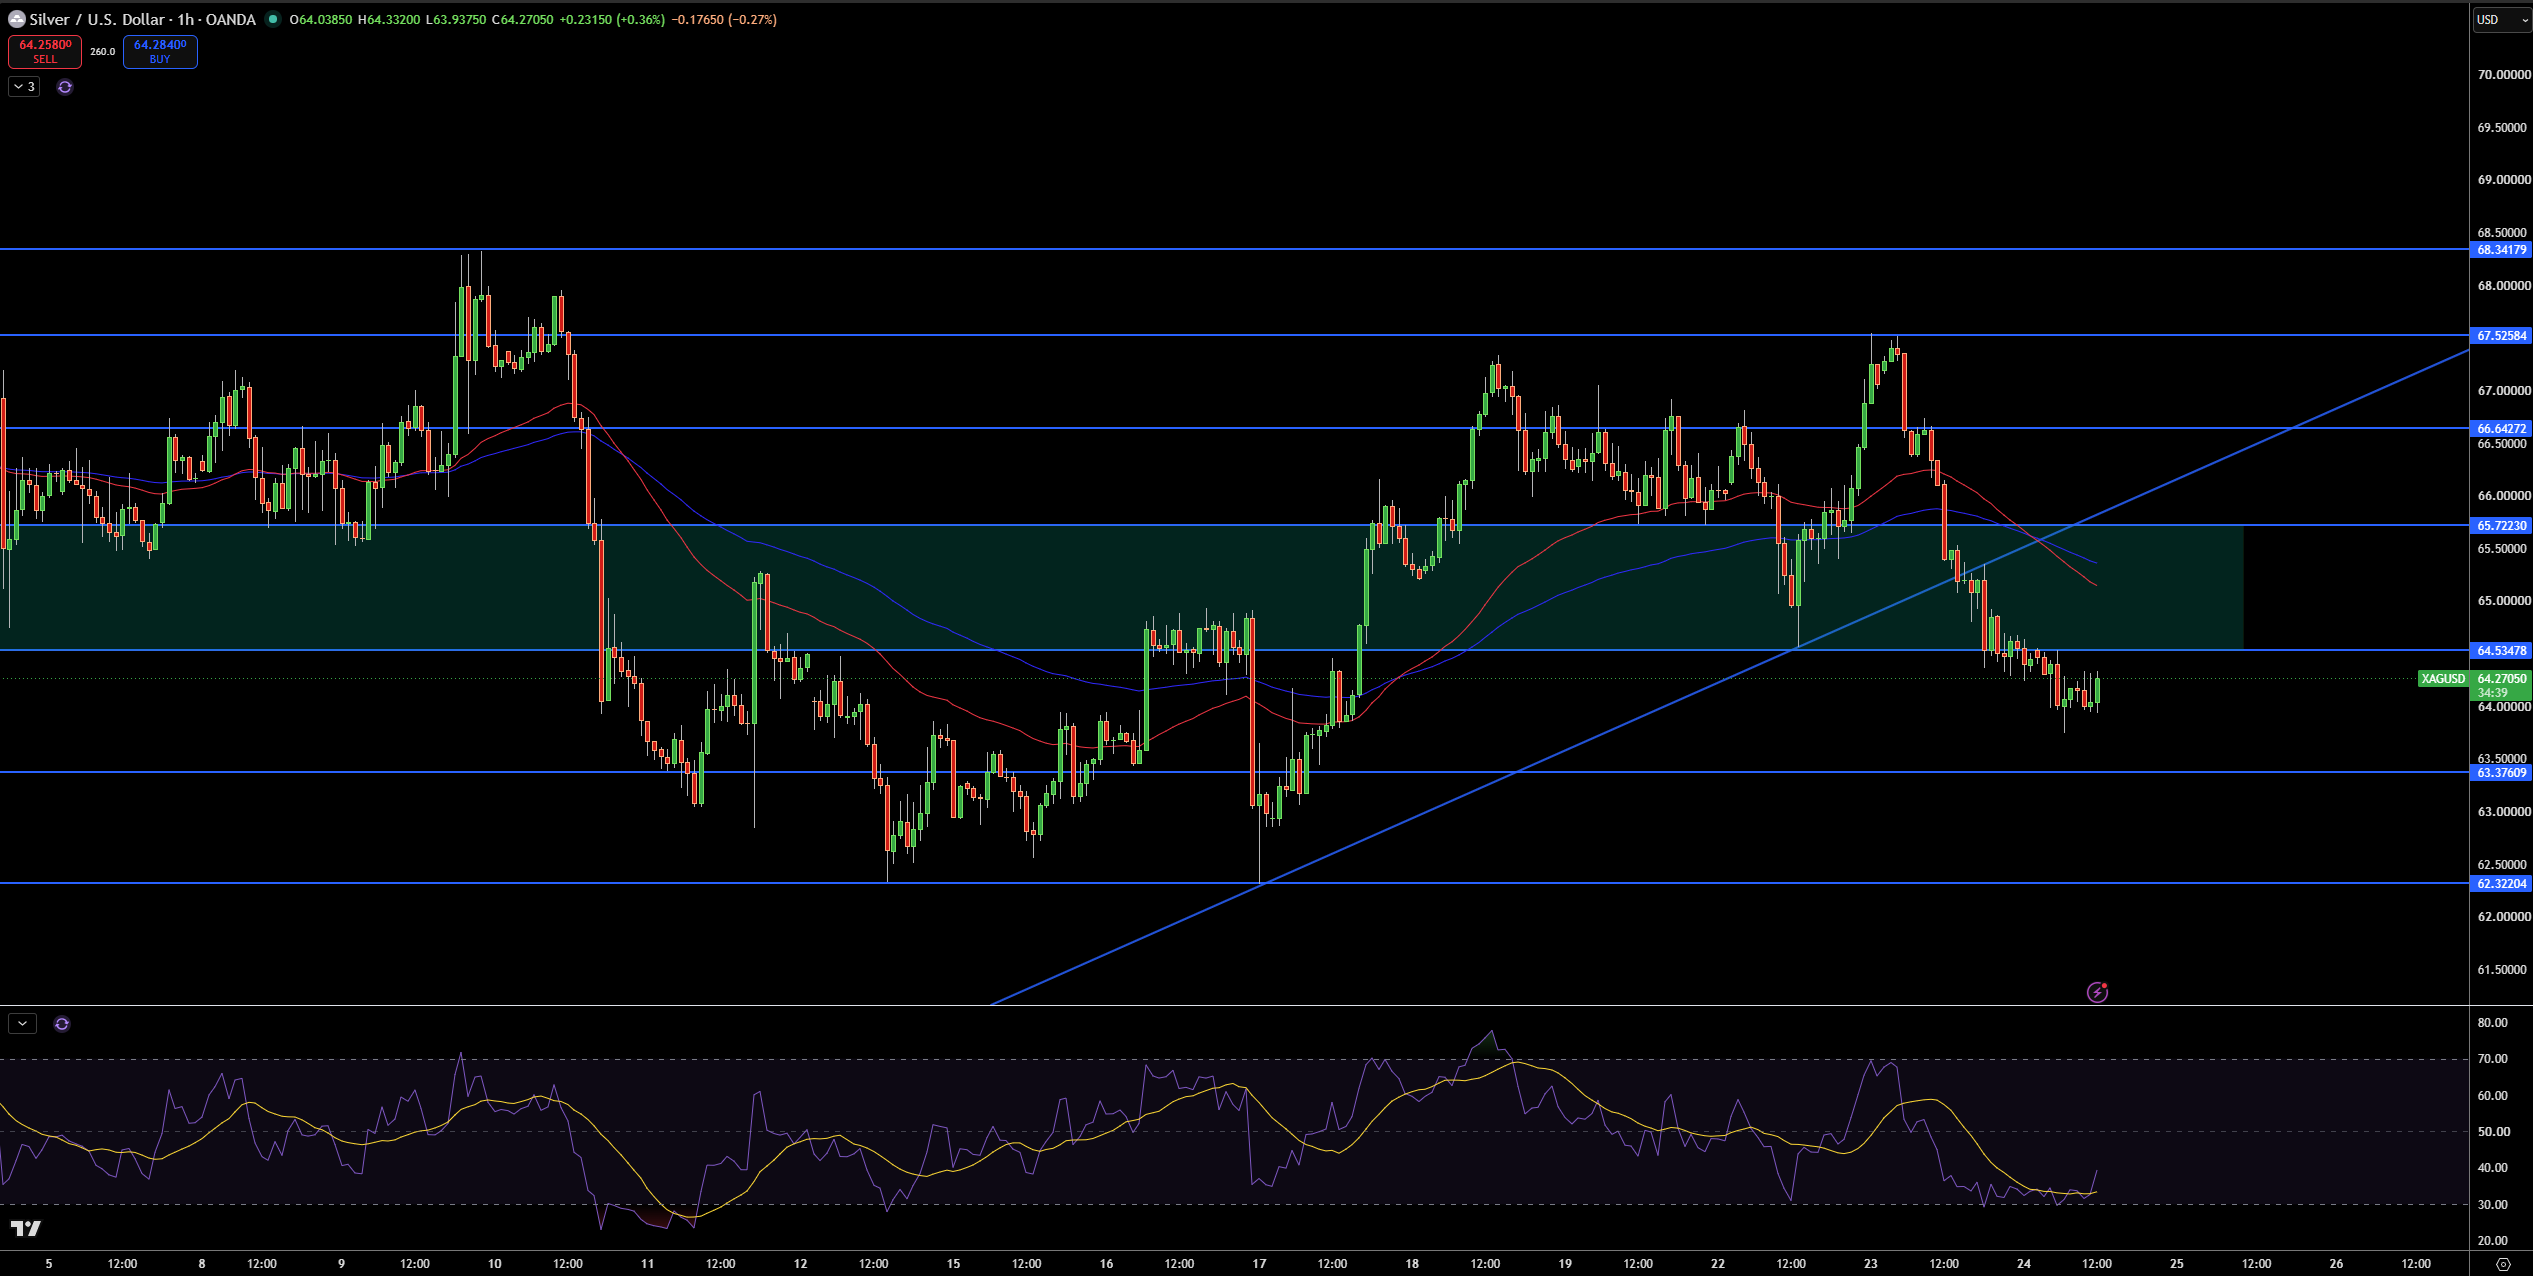
The 1-hour chart shows Silver trading around $64.27 and I see price recently broke below the $64.53 support level. Earlier, price corrected from the $62.54 level and was unable to rebound from the $64.53 level. Also, both the 50 and 200 moving averages are above the price level, indicating a short-term bearish bias.
First, I’ll look for price action around the $63.38 level. If price falls below $63.38, I’ll look for additional offers around $62.53. There is potential for price to rebound towards the $64.53 level. If price falls from the $64.53 level, it could find additional supports at $65.72, $66.64, and $67.53.
I look for potential sell opportunities around the $64.53 level and the 50 moving average. I look for a stop loss above the $65.72 level. The Relative Strength Index (RSI) also gives a bearish signal. The moving average convergence divergence (MACD) line is also below the signal line, giving a bearish signal.